
Published: May 14th, 2020
Following the topic of the US Oil price surge, the Canadian Dollar should struggle as well, especially in the next month or more. We’ve looked at multiple CAD pairs previously, and today will go through CAD/CHF price analysis.
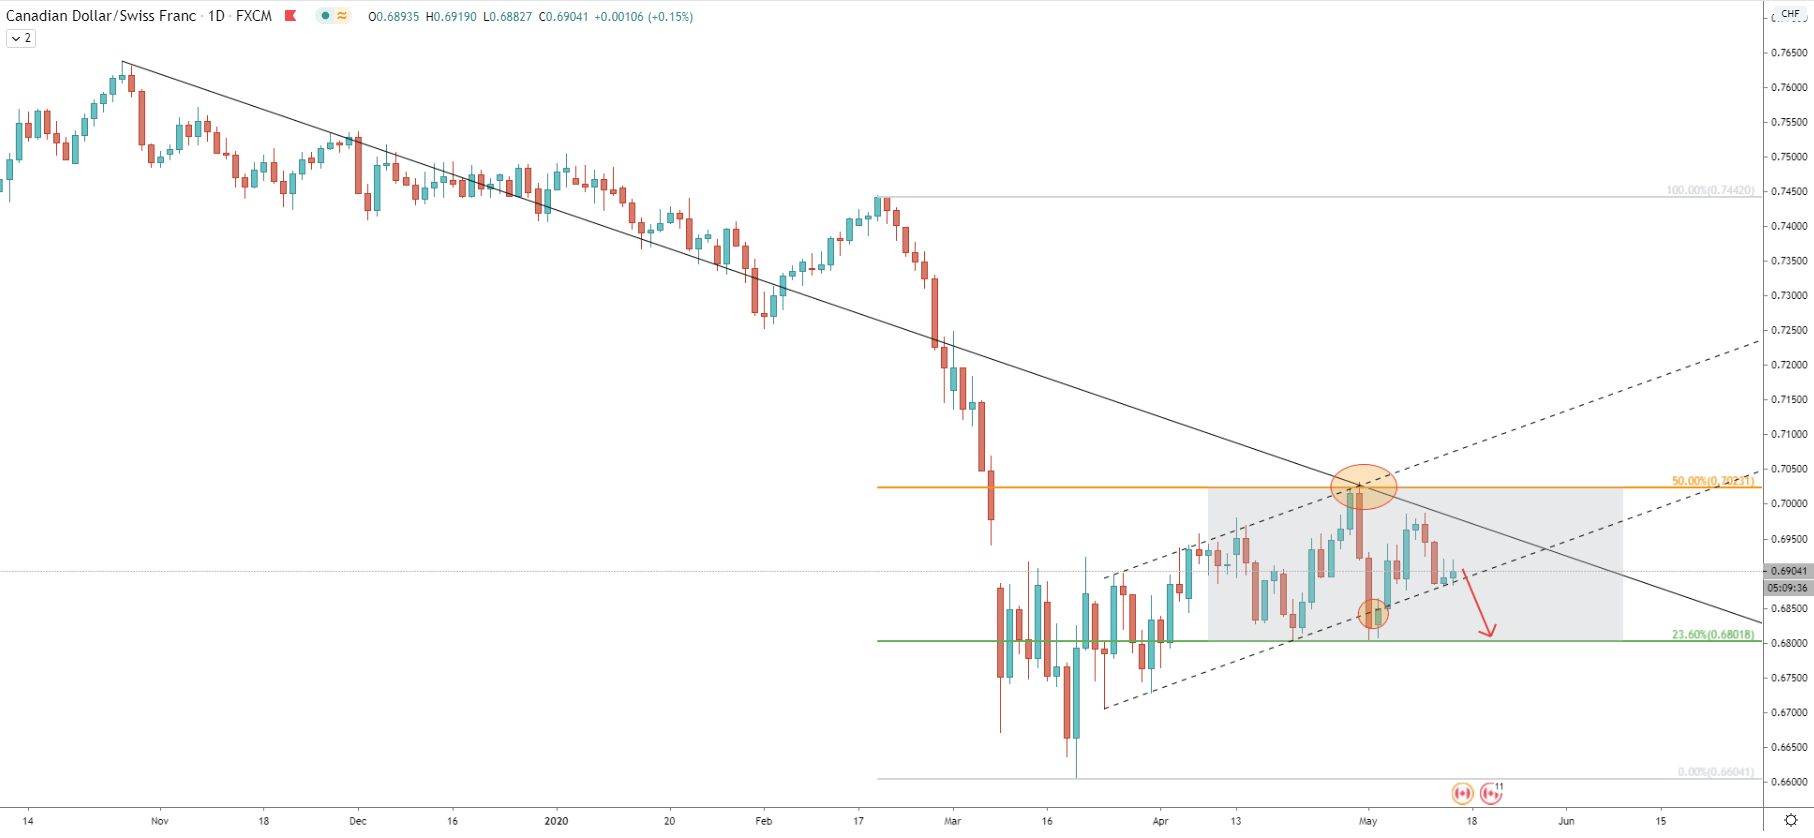
Starting off with the Daily chart, it clearly shows a very bearish tendency. Looking at the price action since October 2019 till May 2020, CAD/CHF rate has fallen by 13.5%. Pice has reached 0.6604 low and corrected up to 0.7032, recovering 6.5%. The correction up has ended when CAD/CHF tested the 50% Fibonacci retracement level applied to Oct 2019 -May 2020 downtrend. Simultaneously, the price rejected the average price trendline, with no further attempts to go higher. Quite the opposite, price has dropped down to 0.6800 psychological and Fibonacci support and rejected it. But what is important, is the brake below the ascending channel. It seems like the price has stuck between 0.7000 resistance and 0.6800 support areas, although channel breakout increases the probability of the long term downtrend continuation. Nevertheless, in order to confirm the downtrend, CAD/CHF must break below the 0.6800 first.
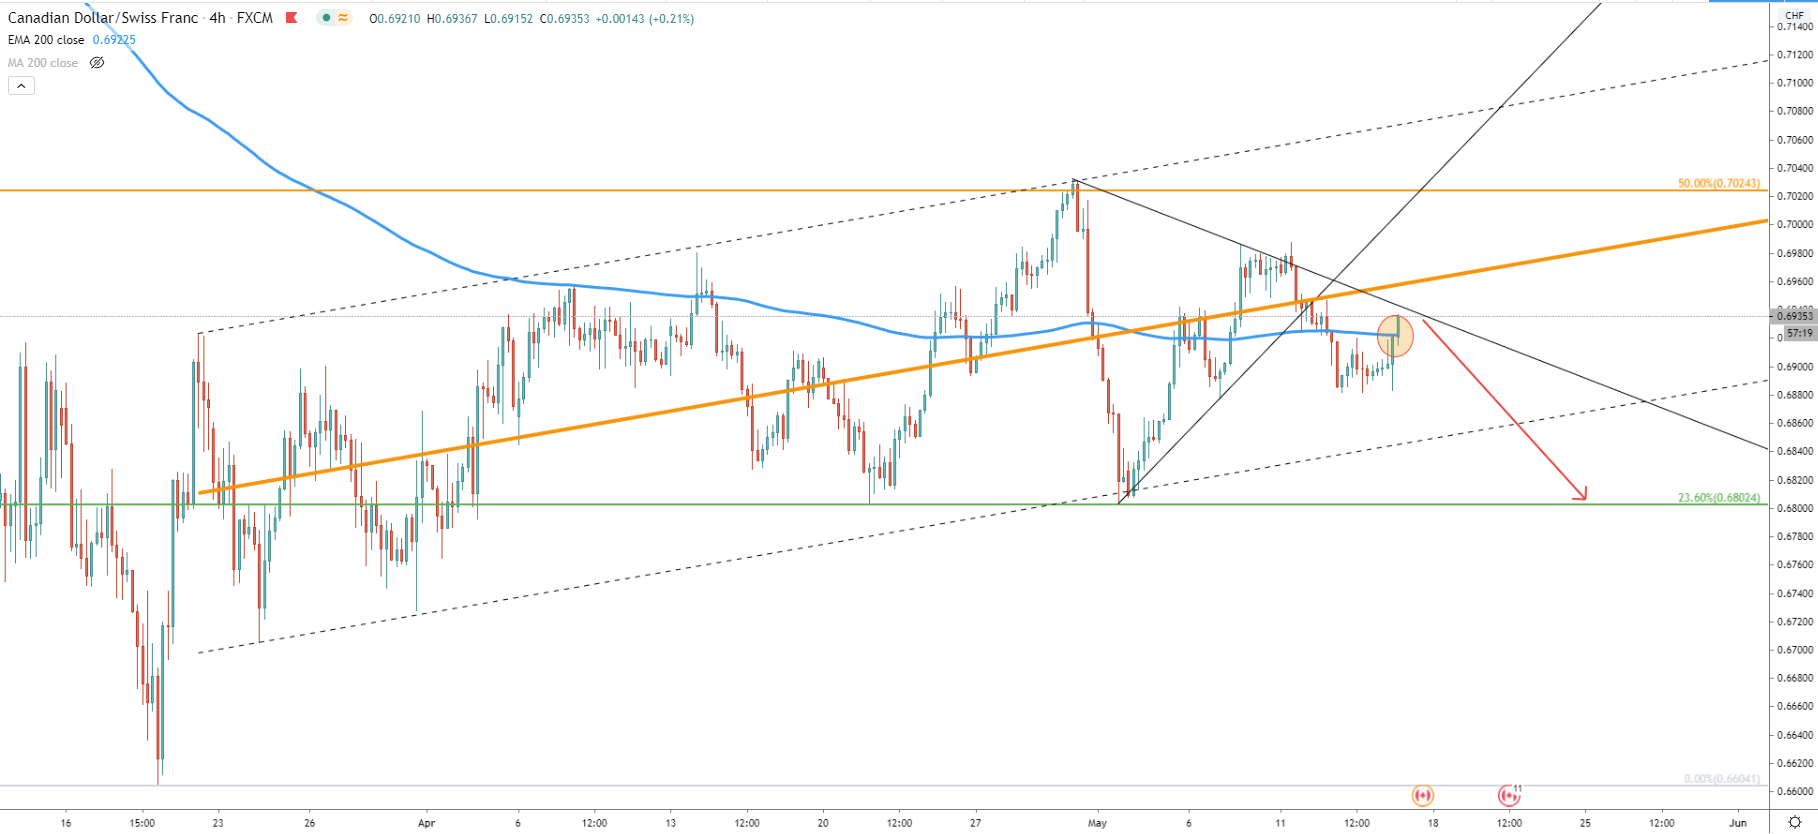
On the 4-hour chart, we have applied another ascending channel, which shows that price still remains within the channel. However, the downtrend trendline breakout could be another sign that the trend is getting more bearish than bullish, although price must close below the 200 Exponential Moving Average to favor the downtrend. If the closing price on the 4H chart will be above the EMA, CAD/CHF is likely to test the downtrend trendline, which could be an area of interest for bears. As long as the downtrend trendline is being rejected, or price remains below the trendline, selling opportunity will be open and CAD/CHF could be heading towards 0.6800 support. Break below 0.6800 will increase selling pressure, and then the price could surge once again, potentially heading for the new lower low.
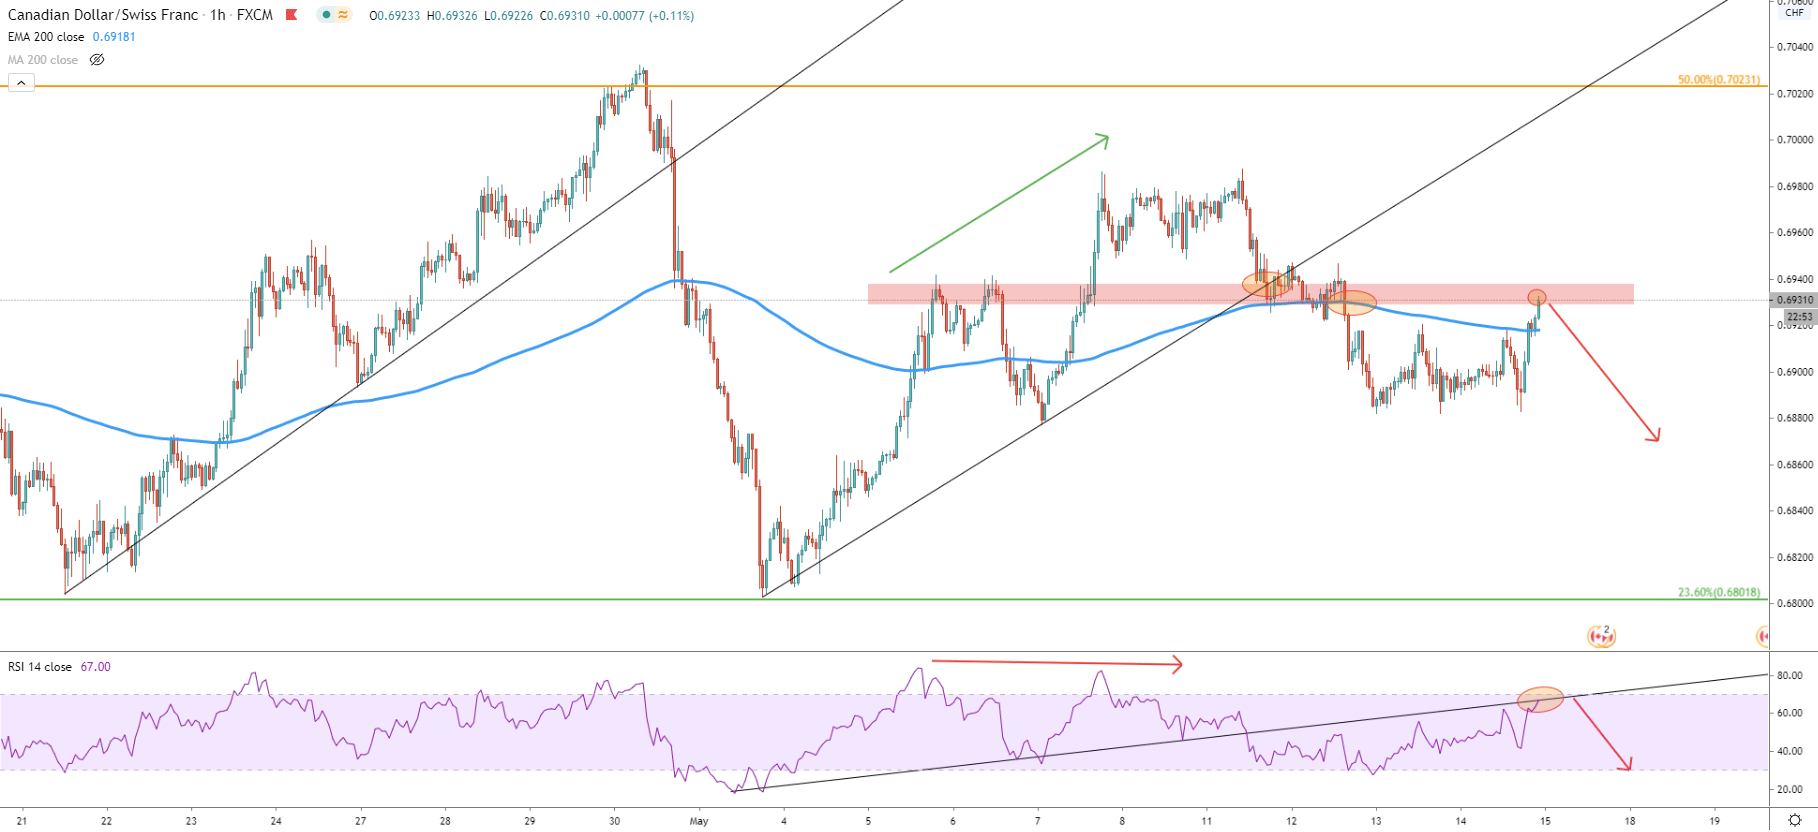
1-Hour chart probably deserves the most attention. Price has broken below the first and then the second downtrend trendlines, clearly showing the domination of sellers. Prior to breaking the second trendline, RSI formed a bearish divergence followed by the break below the 200 EMA. It seems like CAD/CHF has formed a head and shoulders price pattern, although for confirmation we need to see price moving below the neckline. In other words, CAD/CHF must below the most recent support at 0.6880, where the triple bottom was formed. Not only this could be the confirmation of a short term decline, but also a continuation of the major trend down. It is also worth noting that the RSI uptrend trendline was broken and currently RSI found the resistance at the trendline. Not only that, but RSI is approaching an Overbought zone, which eventually should result in the price drop. And finally, CAD/CHF has approached the area of the trendline and 200 EMA breakout, and this is a very important supply zone. Whether it will hold or not, we are yet to see, although if the price remains below this zone, the downtrend is imminent.
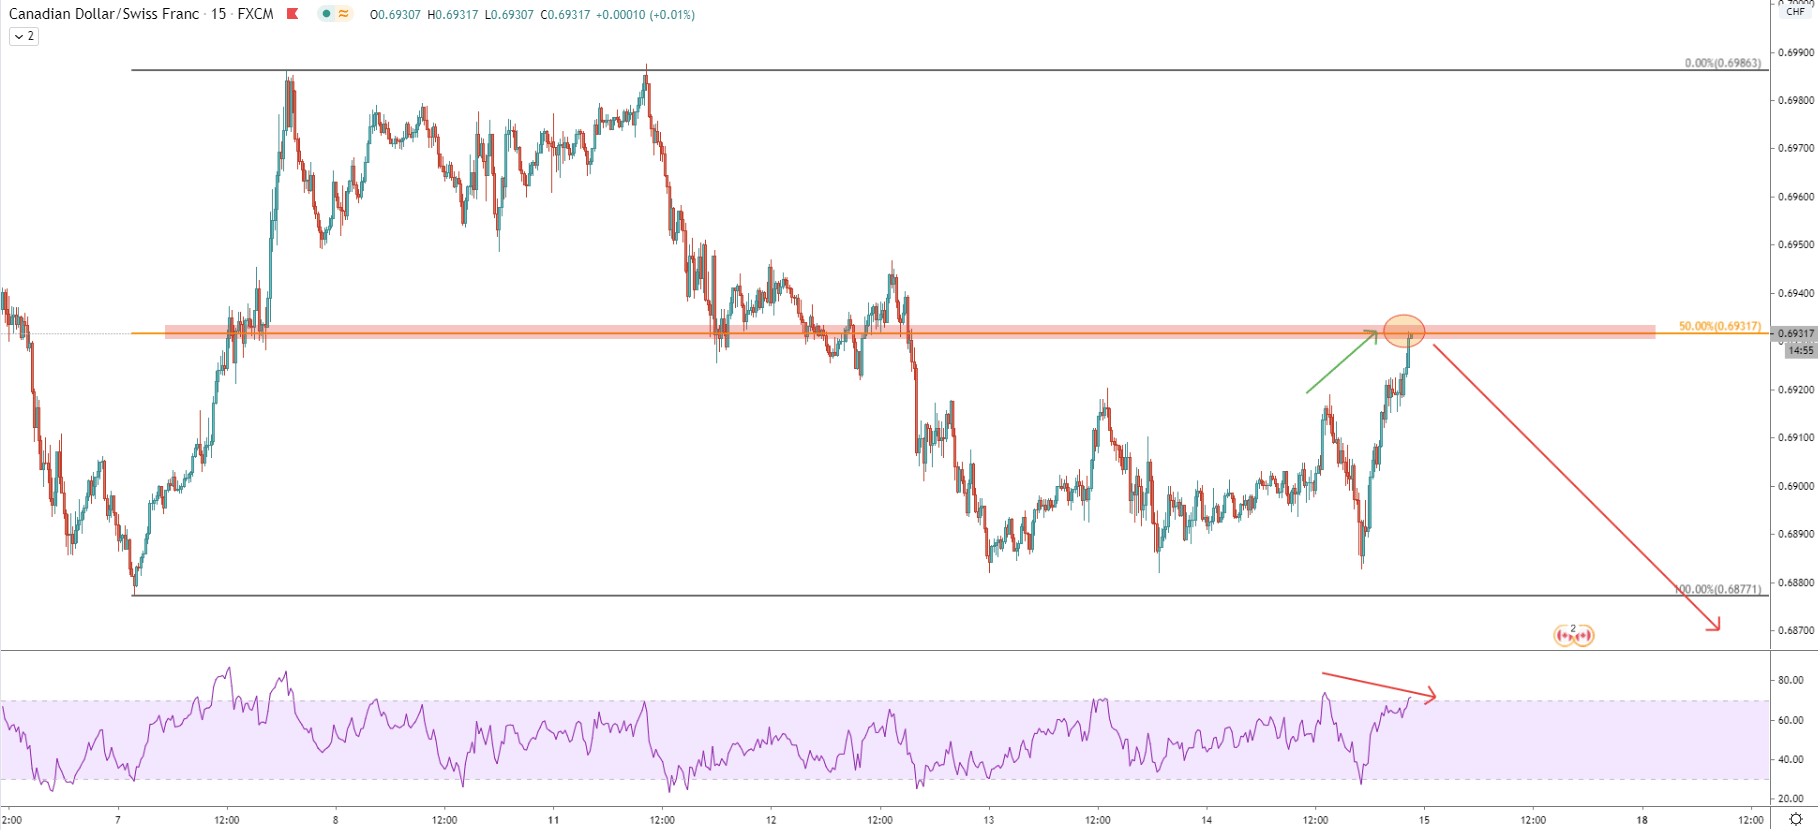
On the 15M chart CAD/CHF has just reached 50% Fibonacci retracement level, which might act as the resistance. We can see that it has produced a new higher high, yet, RSI oscillator failed to do the same and produced a lower low. This is the beginning of the formation of another bearish divergence, suggesting price reversal to the downside at any time.
Looking at the price action during the past month, the pair is clearly consolidating. Although on the shooter timeframe, the probability of price decline remains high. If the support on the Daily chart gets penetrated, CAD/CHF should confirm the continuation of the major downtrend.
While the pair is range-trading, the nearest support and the downside target is seen at 0.6800.
Right now, CAD/CHF is trading at the supply area. If there will be daily break and close above the 0.6937 recent high, short term bearish outlook will be invalidated and pair should be expected to move up towards 0.6976 resistance.
Support: 0.6877, 0.6800
Resistance: 0.6937, 0.7023