
Published: April 27th, 2020
Some time back we provided analysis on GBP/AUD currency pair, where expected target was 1.9300. Recently, it has reached the target and actually went a bit lower. While GBP/NZD is heavily correlated to GBP/AUD, we would like to present analysis on this pair, and a potential long term uptrend continuation scenario.
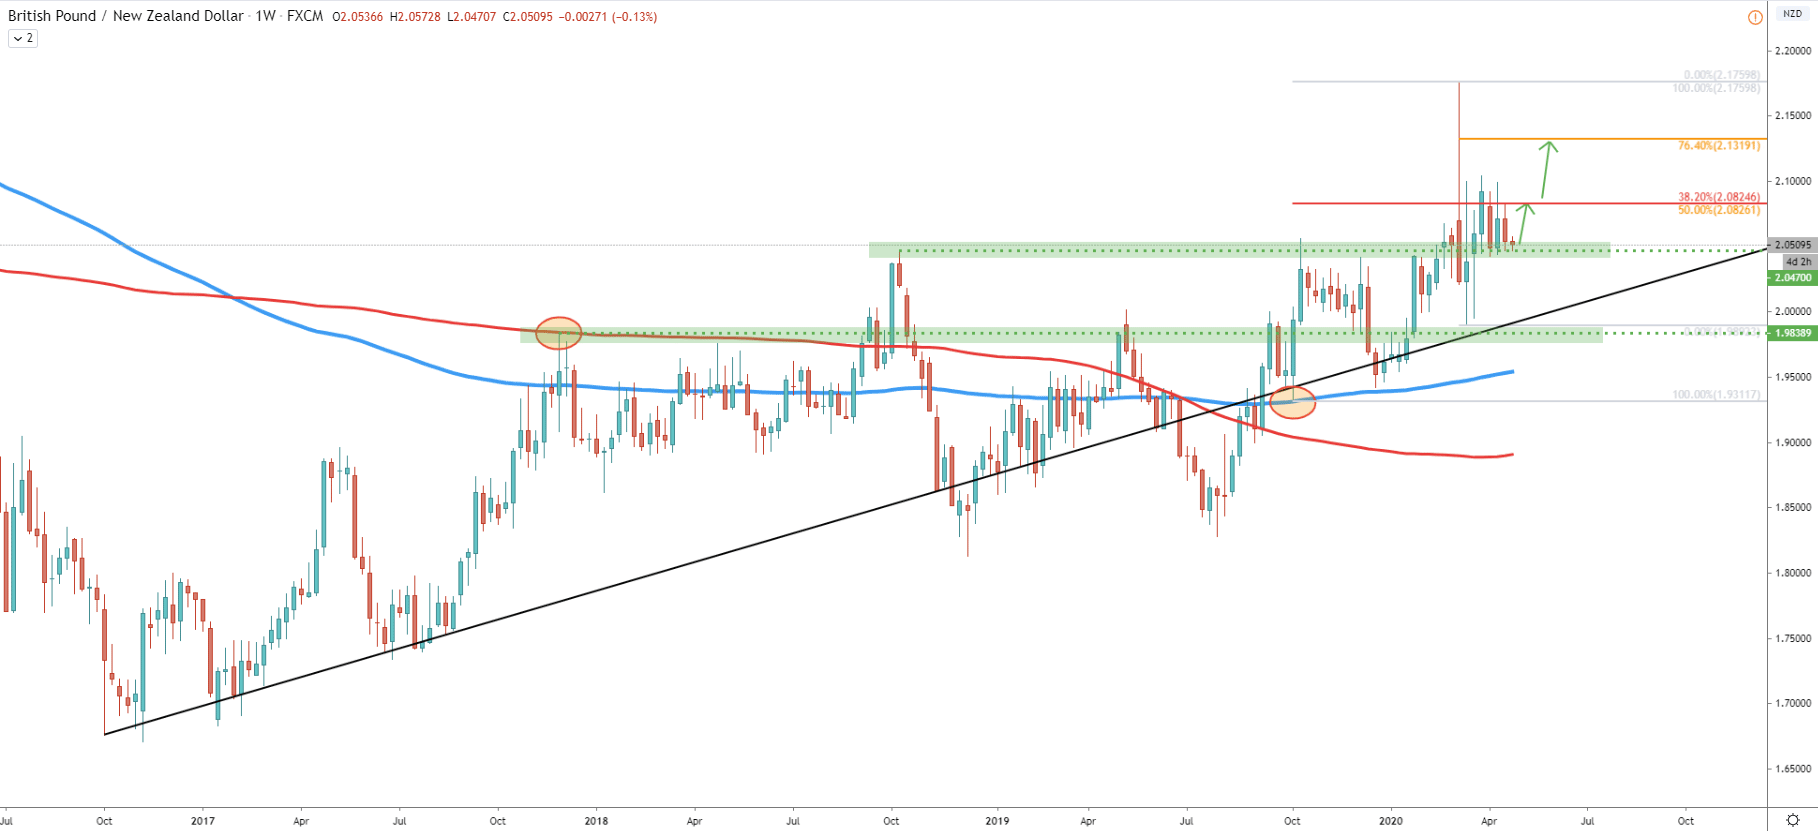
As this is a long term perspective, we’ll start with a Weekly chart. First off, price is still producing higher highs and higher lows, suggesting the validity of the uptrend. Previous resistance at 2.0500, was formed back in October 2018. For the second time, this resistance was rejected in October 2019 making it a key supply area. However, this level has been broken after rejecting the 200 Exponential Moving Average along with the uptrend trendline, after which price went up to 2.7598 level. Correction followed and GBP/NZD went to 1.9892 low while staying above the uptrend trendline. What we currently see, is that price has approached the same level at 2.0500, which previously was strong resistance, but now it is the support. This could be a very attractive price for the long term investors, resulting in a potential rise in price.
We have applied the Fibonacci retracement level to the correction down, which occurred between 09 - 19 May 2020. It shows where potential upside targes could be either 50% at 2.0825 or 76.4% retracement at 2.1320. We will dive deeper into those levels as we move towards an analysis of lower timeframes. It is also worth mentioning that the first target corresponds to the 38.2% Fibs applied to the 07 October 2019 - 09 May 2020 wave up.
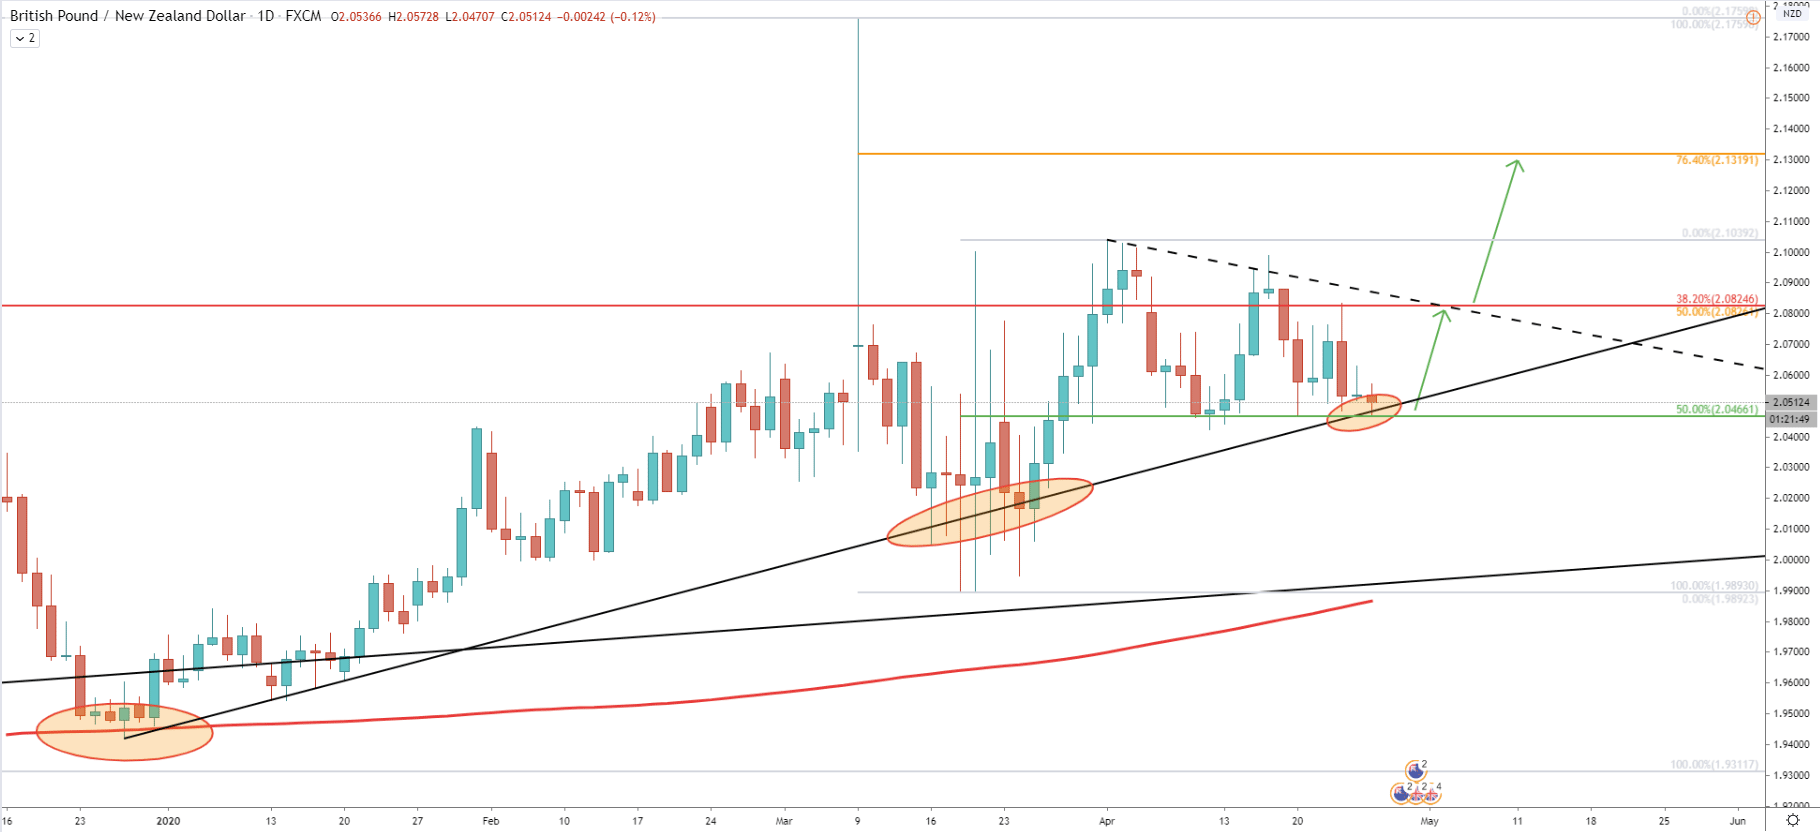
Moving on to the Daily chart, we can see the rejection of the uptrend trendline. But at the same time, we can see a very clean bounce off the 2.0466, which is a 50% Fibonacci retracement level applied to the 18 March - 01 April wave up. The first upside target at 2.0825 corresponds to the downtrend trendline, which could be the nearest major obstacle prior to further rise. If the trendline will be broken with a daily close above this price, further growth towards 2.1320 should be expected in the long run.
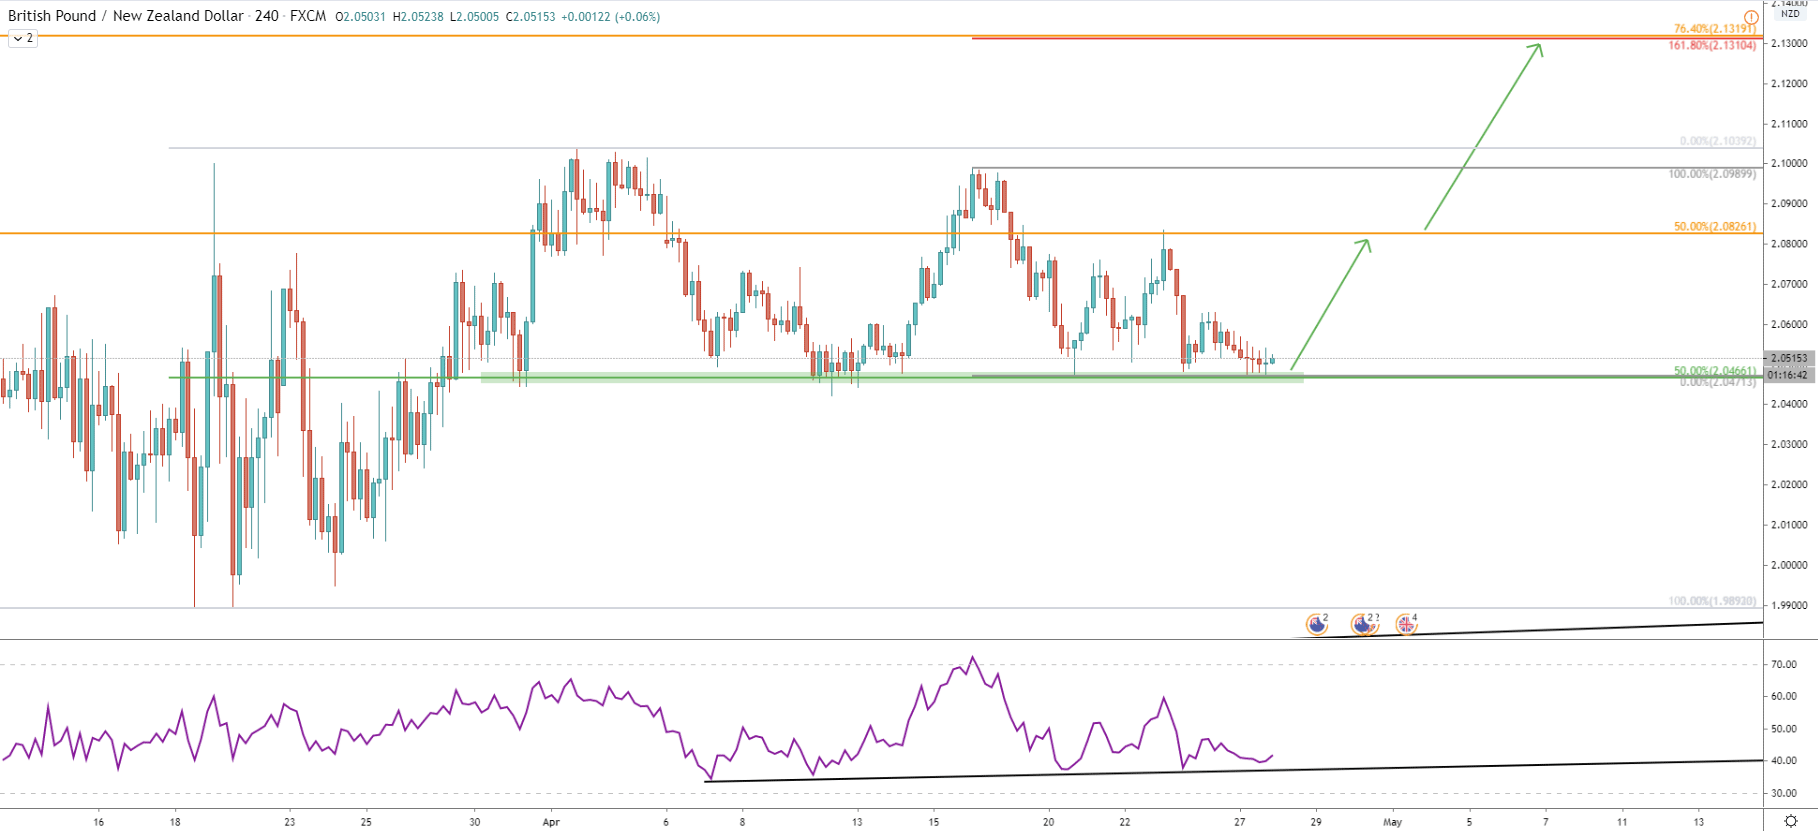
The 4H chart shows the importance of the 2.0466 support level, which has been rejected multiple times, Just recently we saw another rejection along with the RSI oscillator bounce of the uptrend trendline. Overall, this could mean that price remains at the attracting buying area for the investors and swing traders. At the same time, we can see that 161.8% Fibs, applied to the most recent corrective wave down, clearly corresponds to the second upside target at 2.1320. But, on the other hand, it also gives information on the potential trend reversal point, where Daily break and close below the 2.0471 would invalidate bullish outlook and could send the price much lower.
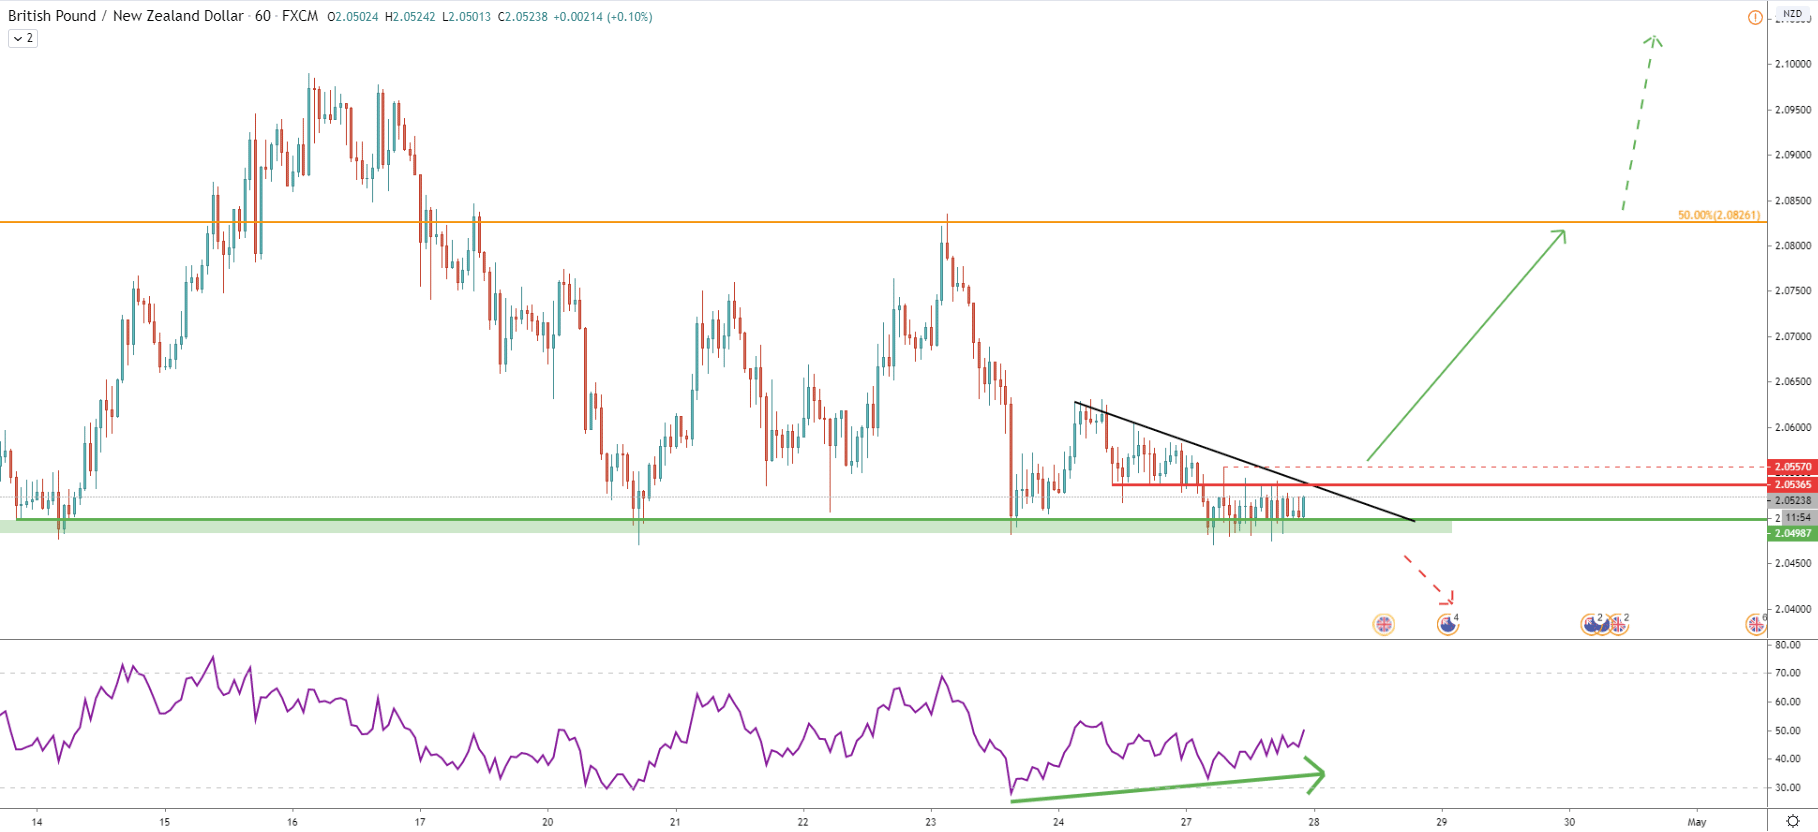
Finally, we will look at the 1-hour chart, which can be used as a signal for buying opportunity. The most important point is the formation of bullish divergence on the RSI oscillator, which shows that trend can reverse to the upside at any time. However, the price remains below the downtrend trendline, suggesting market indecision in the short term. Perhaps the best entry point for bulls would be 1H break and close above the downtrend trendline, that can happen anytime this week. But, if the price will remain below and will break to the downside, selling will become the priority.
All-in-all, GBP/NZD is currently trading at the massive support area and as long as it holds 2.0471, price should be expected to move up, towards the first or second upside target based on Fibonacci retracement levels.
As per the Weekly chart, we can distinguish two major upside targets. First is the 50% Fibonacci retracement level at 2.0824 correspondings to the downtrend trendline. Second is 76.4% Fibs at 2.1320 area, which is less important, although should not be ignored.
There is only one scenario of the downtrend, where the daily closing price will be below the 2.0471 level. If this will happen, a bullish outlook will be completely invalidated, and price should be expected to initiate a long term downtrend.
Support: 2.0471, 2.0500
Resistance: 2.0557, 20826, 2.1310