Published: April 28th, 2022
The Graph (GRT) is an indexing protocol used for querying data for blockchain networks like Ethereum and IPFS. Anyone can build and publish open APIs to retrieve the blockchain data through this platform. Moreover, the hosted service in production allows developers to build the Graph that is currently supported by indexing data from Ethereum, POA and IPFS networks. Moreover, some other networks are waiting to be connected to this system, which will be a price driving factor for GRT.
Already more than 3000 subgraphs are operated by thousands of developers through the network like UniSwap, AAVE, Decentraland, Balancer and many more. On the other hand, the Graph is working to bring a decentralized public infrastructure where the native token GRT will be the main method of exchange.
GRT is an ERC-20 based token built on the Ethereum blockchain, used by active indexers, delegators and curators to earn income from the network. Currently, there are 4.72 billion GRT tokens in circulation, which is 47% of the total supply. Let’s see the future price direction of the GRT token from the GRT/USDT technical analysis.

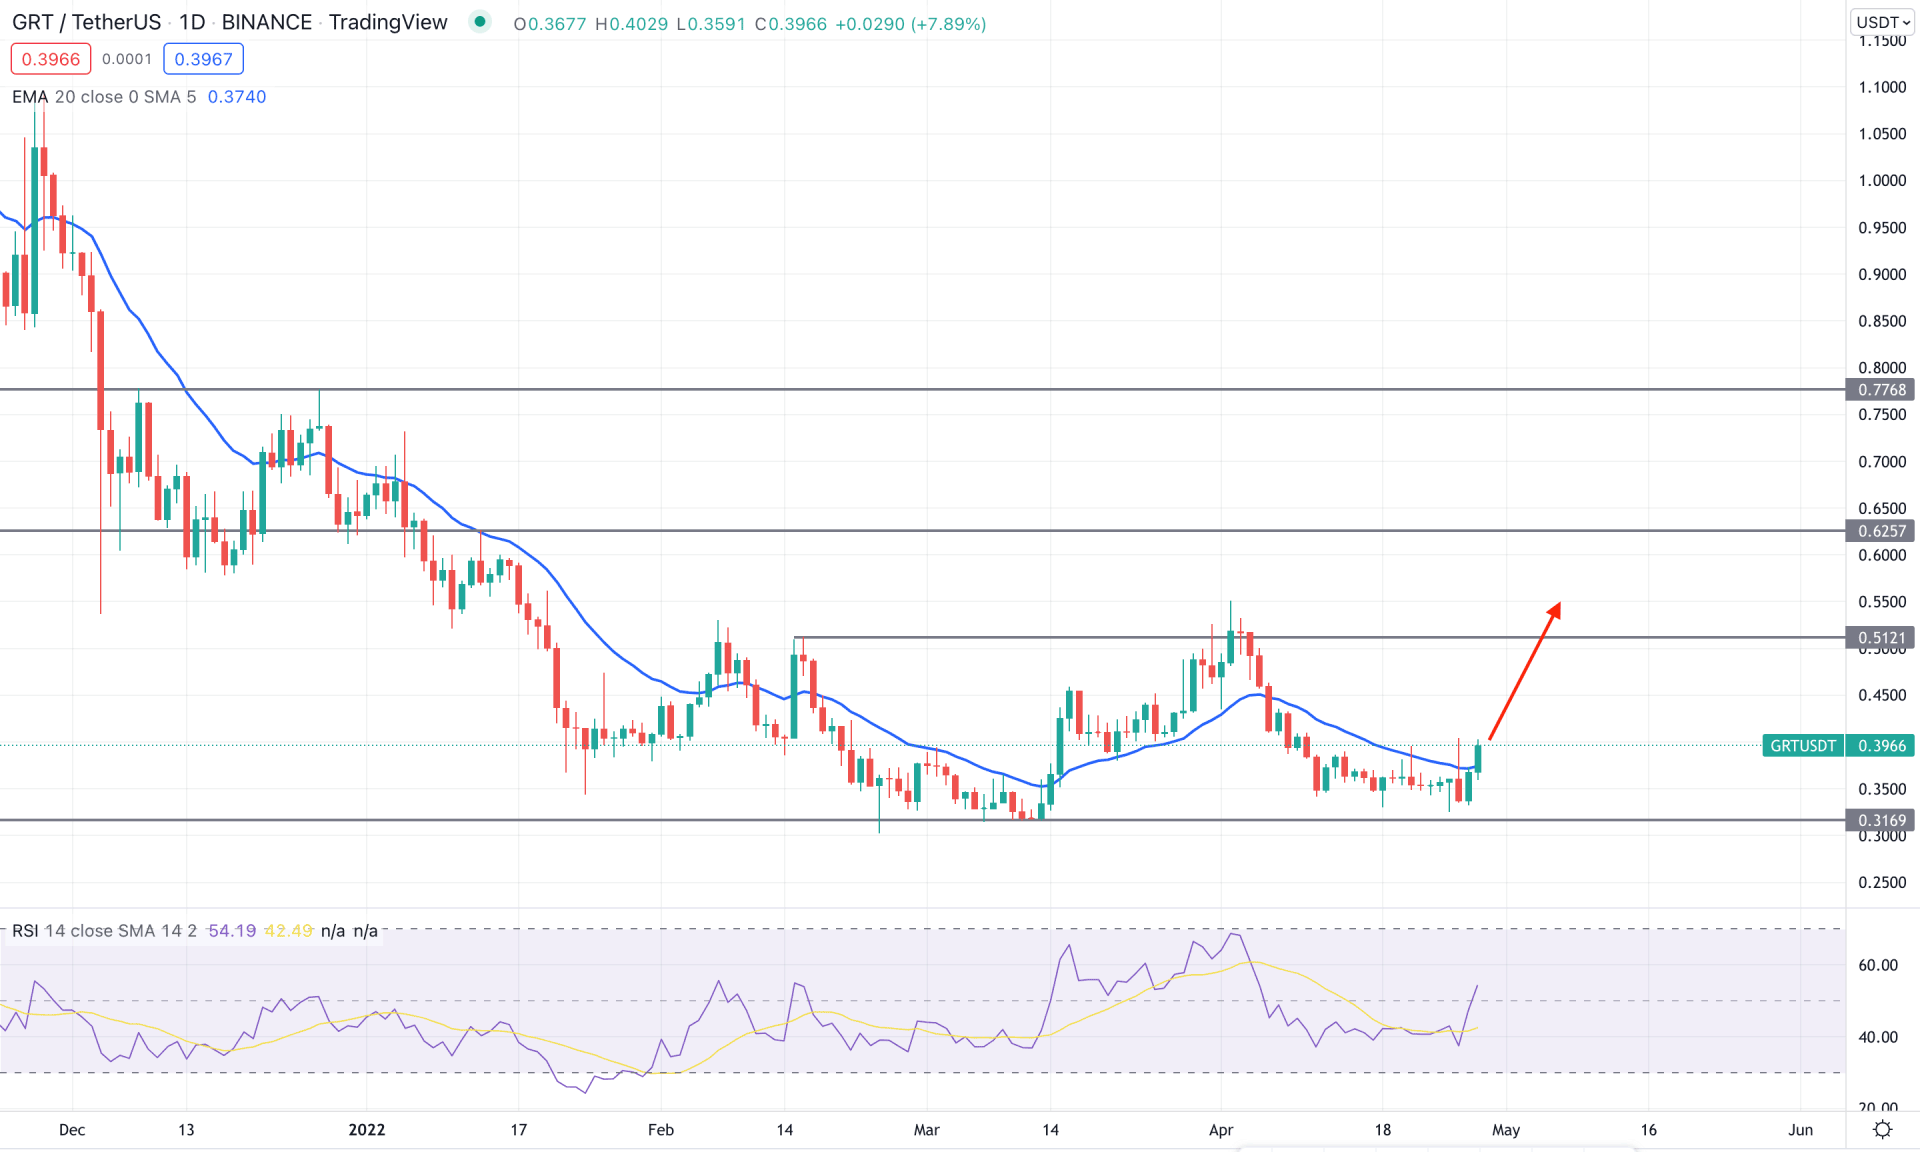
GRT/USDT soared after launching on major exchanges, but the price rebounded immediately within a few months. Moreover, the coin started trading in 2022 with a negative vibe that made a new swing low at 0.3169 level, which is the near-term support level. In the weekly chart, the price showed multiple bullish rejection candlesticks from the 0.3169 level by changing the character to bullish. Moreover, the Weekly MACD Histogram is bullish, followed by divergence, while the RSI is above the oversold 30 level.
The above image shows the daily chart of GRT/USDT, where the new swing high above the 0.5121 level made 0.3100 to 0.3350 a valid demand zone. Moreover, the current price is trading above the dynamic 20 EMA while the RSI is above the 50 neutral level. In that case, as the price showed a bullish rejection from the daily demand zone, it may move higher towards the 0.6257 level in the coming days.
Based on the daily price structure, investors should find bullish opportunities from the 0.3100 to 0.3350 demand zone to aim for testing the 0.6257 resistance level. However, the alternative approach is to wait for the price to break below the 0.3000 level with a strong bearish daily candle to see a new one at the 0.2000 area.

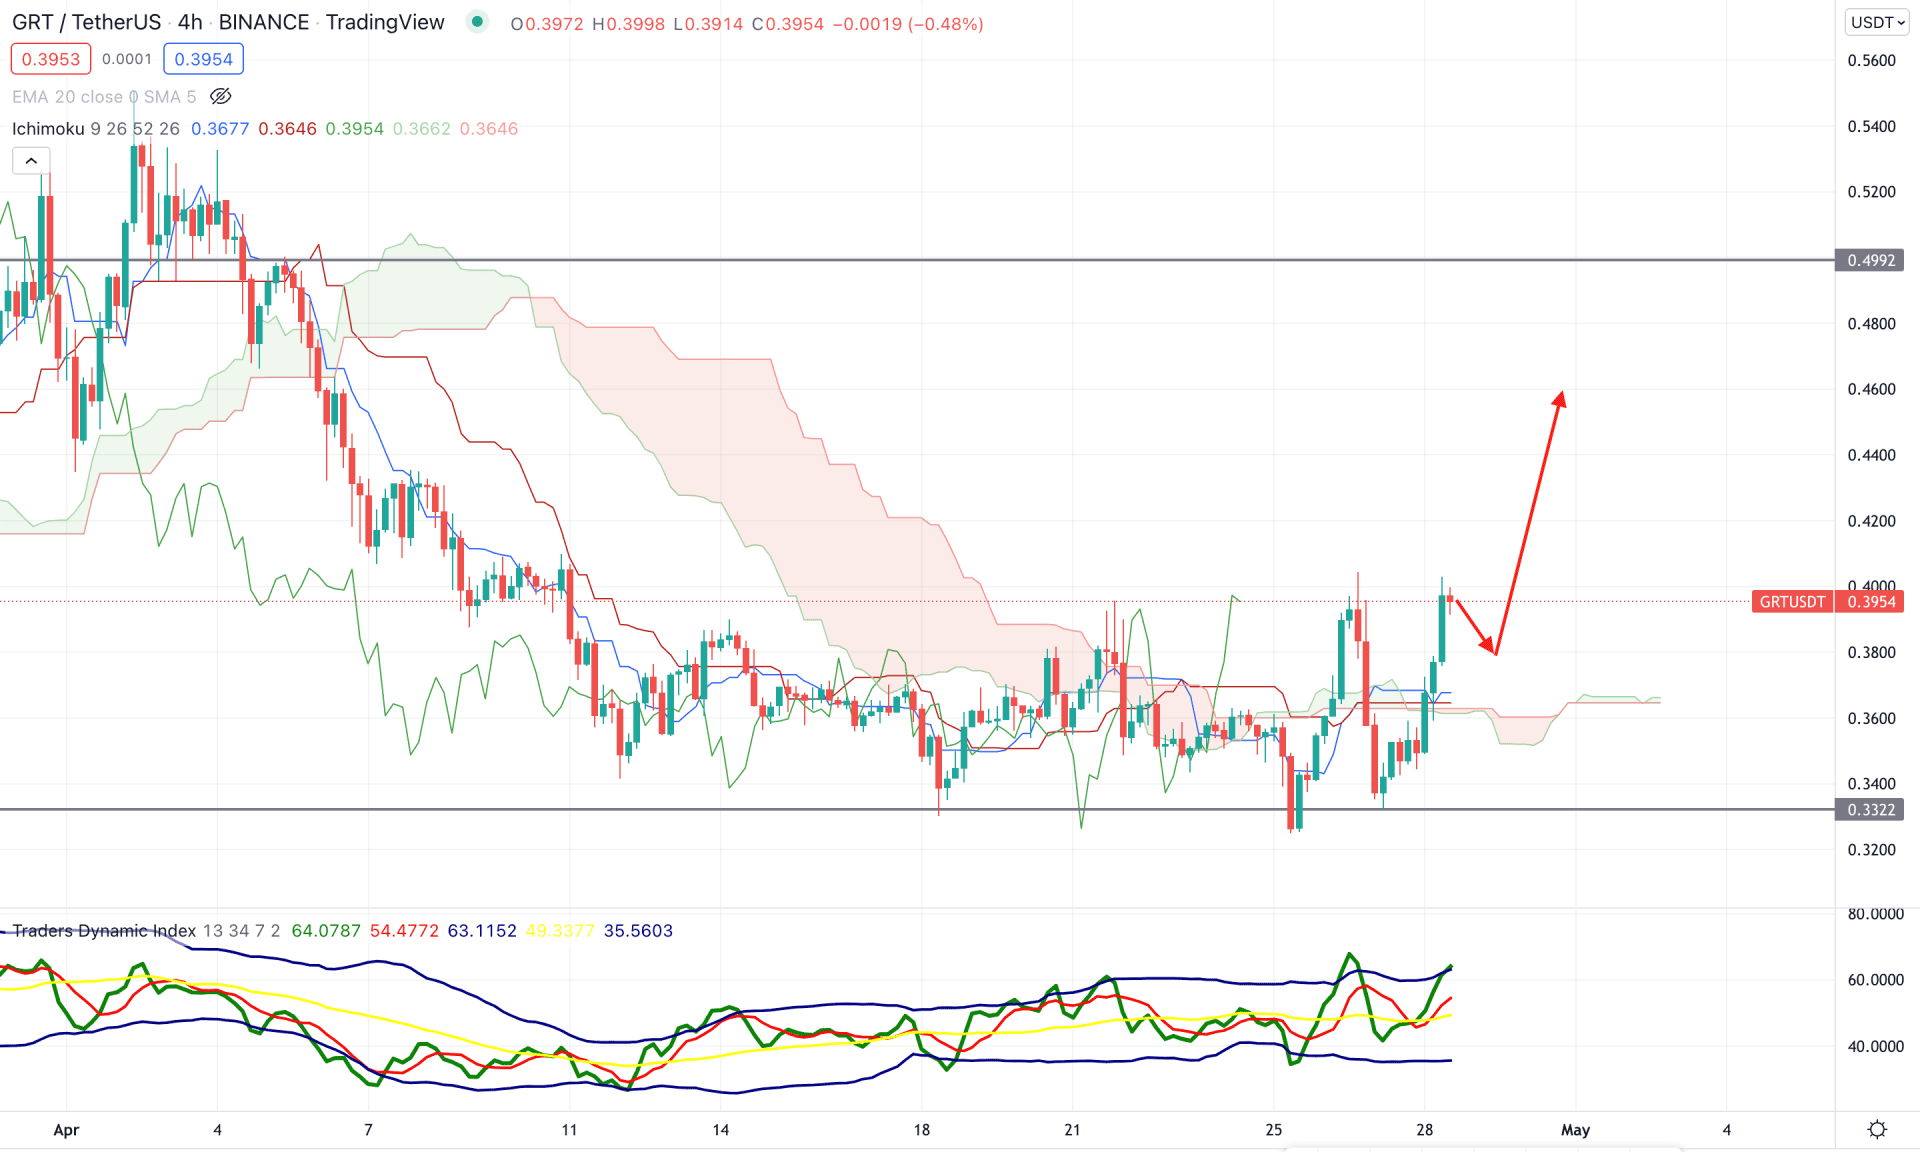
According to the Ichimoku Cloud, the GRT/USDT is trading at the beginning phase of a bullish trend from where taking a bullish position with a tight stop loss is possible. The price moved above the dynamic Kumo Cloud with a counter impulsive momentum while the Senkou Span A moved higher in the future cloud. Meanwhile, the lagging span is above the price, indicating further bullishness in the coming sessions.
The Traders Dynamic Index shows an extreme bullish pressure in the indicator window as it rebounded to the upper band after testing the 50 neutral level. Moreover, the dynamic Tenkan Sen and Kijun Sen are below the price and working as minor supports. In that case, any bullish rejection from the dynamic Tenkan Sen would increase the buying pressure.
Based on the current price structure, investors should monitor how the price trades at the dynamic Kijun Sen area, from where any bullish rejection would raise the price higher to the 0.5000 level. On the other hand, a break below the 0.3322 level would be an alarming sign for bulls that may incur further downside pressure in the price.

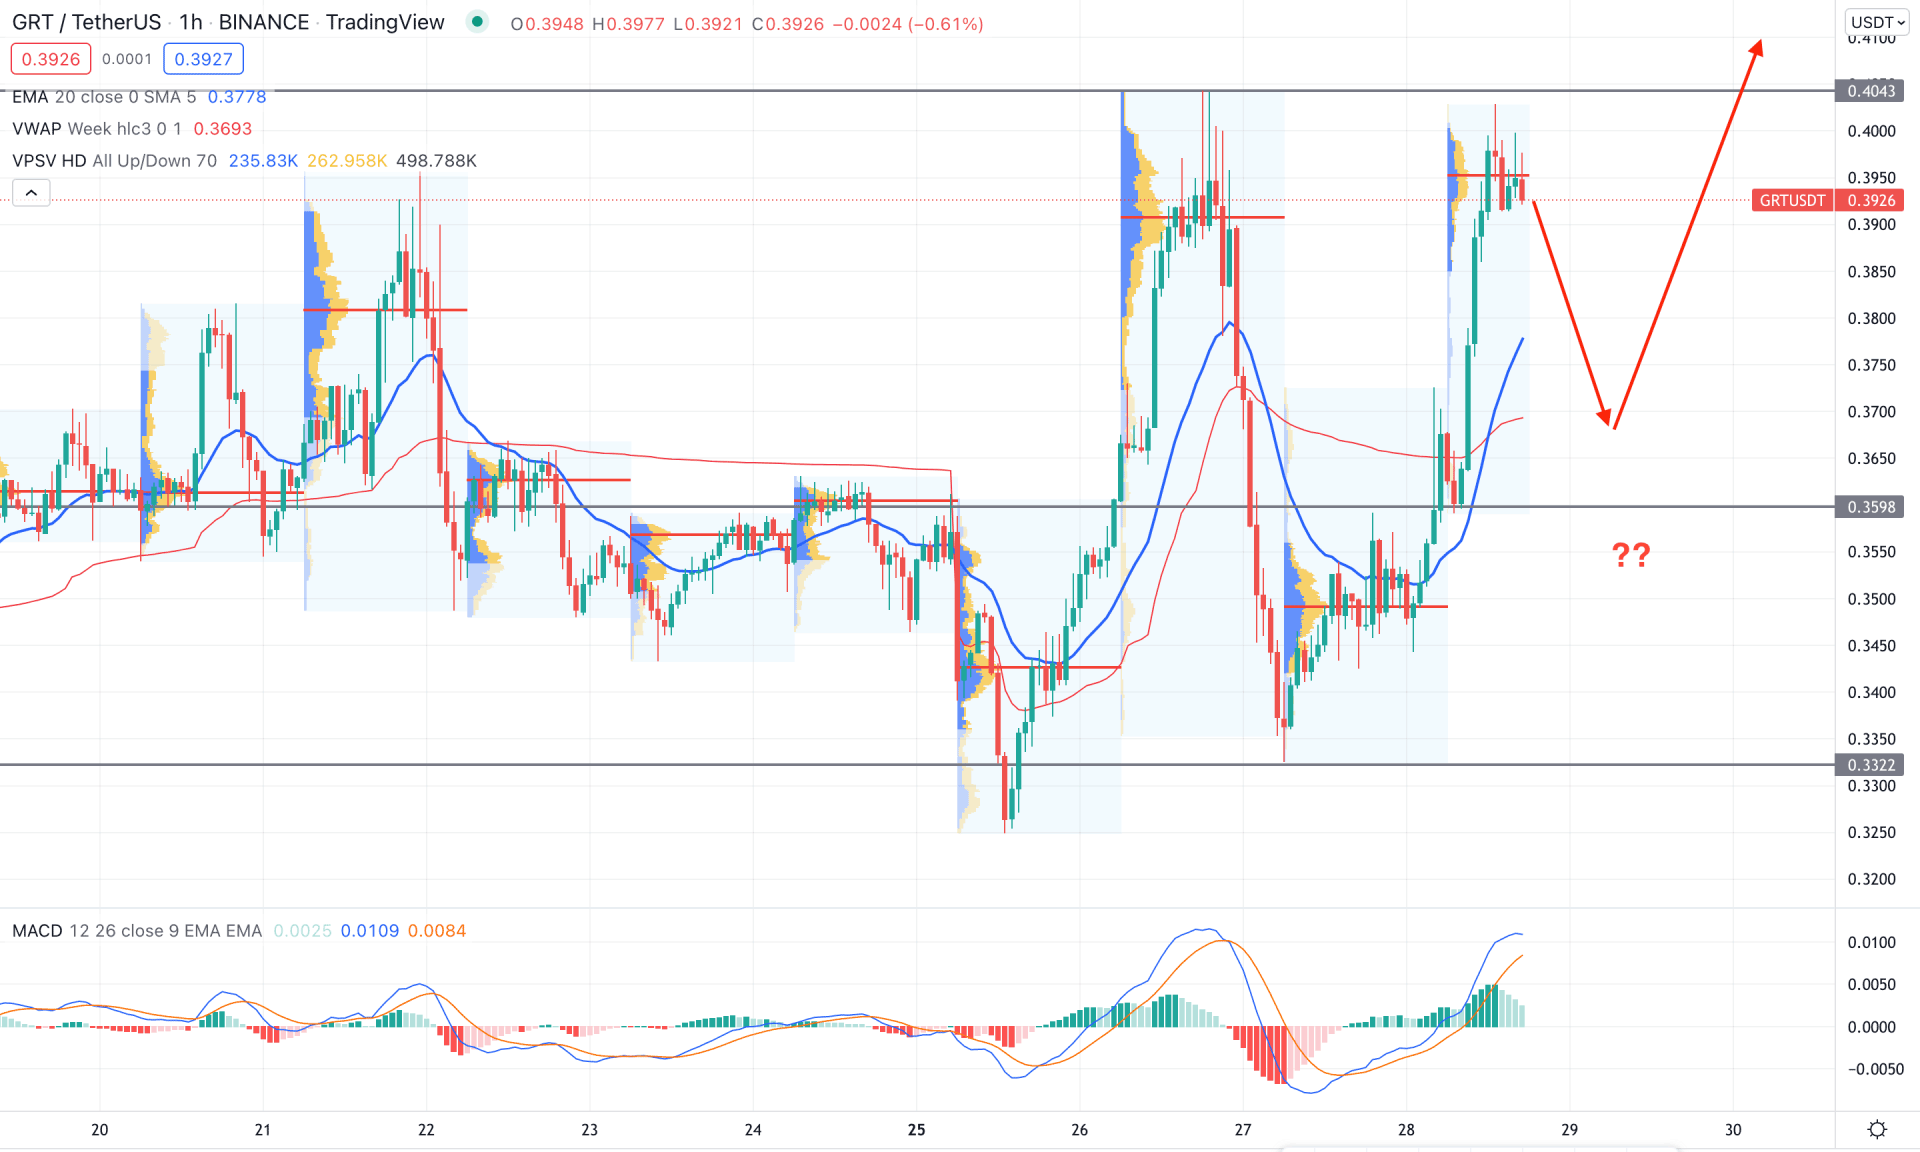
In the intraday chart, GRT/USDT is trading within a corrective momentum where the most recent price faces an intraday resistance of 0.4043 from where a bearish corrective pressure may come. Moreover, the gap between the price and dynamic 20 EMA is expanded, signifying that the price should come lower as a mean reversion.
The above images show that the MACD Histogram is bullish but decreasing its bullish momentum, while the most recent intraday high volume level is above the current price. Meanwhile, the weekly VWAP is below the price, which may attract bears to take the price down.
Based on the hourly price action, the bullish pressure may extend after taking out the 0.4043 resistance level with an H4 close. Moreover, another buying opportunity is available upon finding bullish rejection candlesticks from weekly VWAP and 0.3600 support areas. However, the break below the 0.3350 level with a bearish H1 close would alter the current market structure and increase its bearishness.
Based on the current multi-timeframe analysis, GRT/USDT has a higher possibility of testing the 0.5000 level with a 27% gain from the current market price. However, the broader crypto market is still corrective, which requires additional attention to the intraday price action before going long in this pair.