
Published: December 25th, 2020
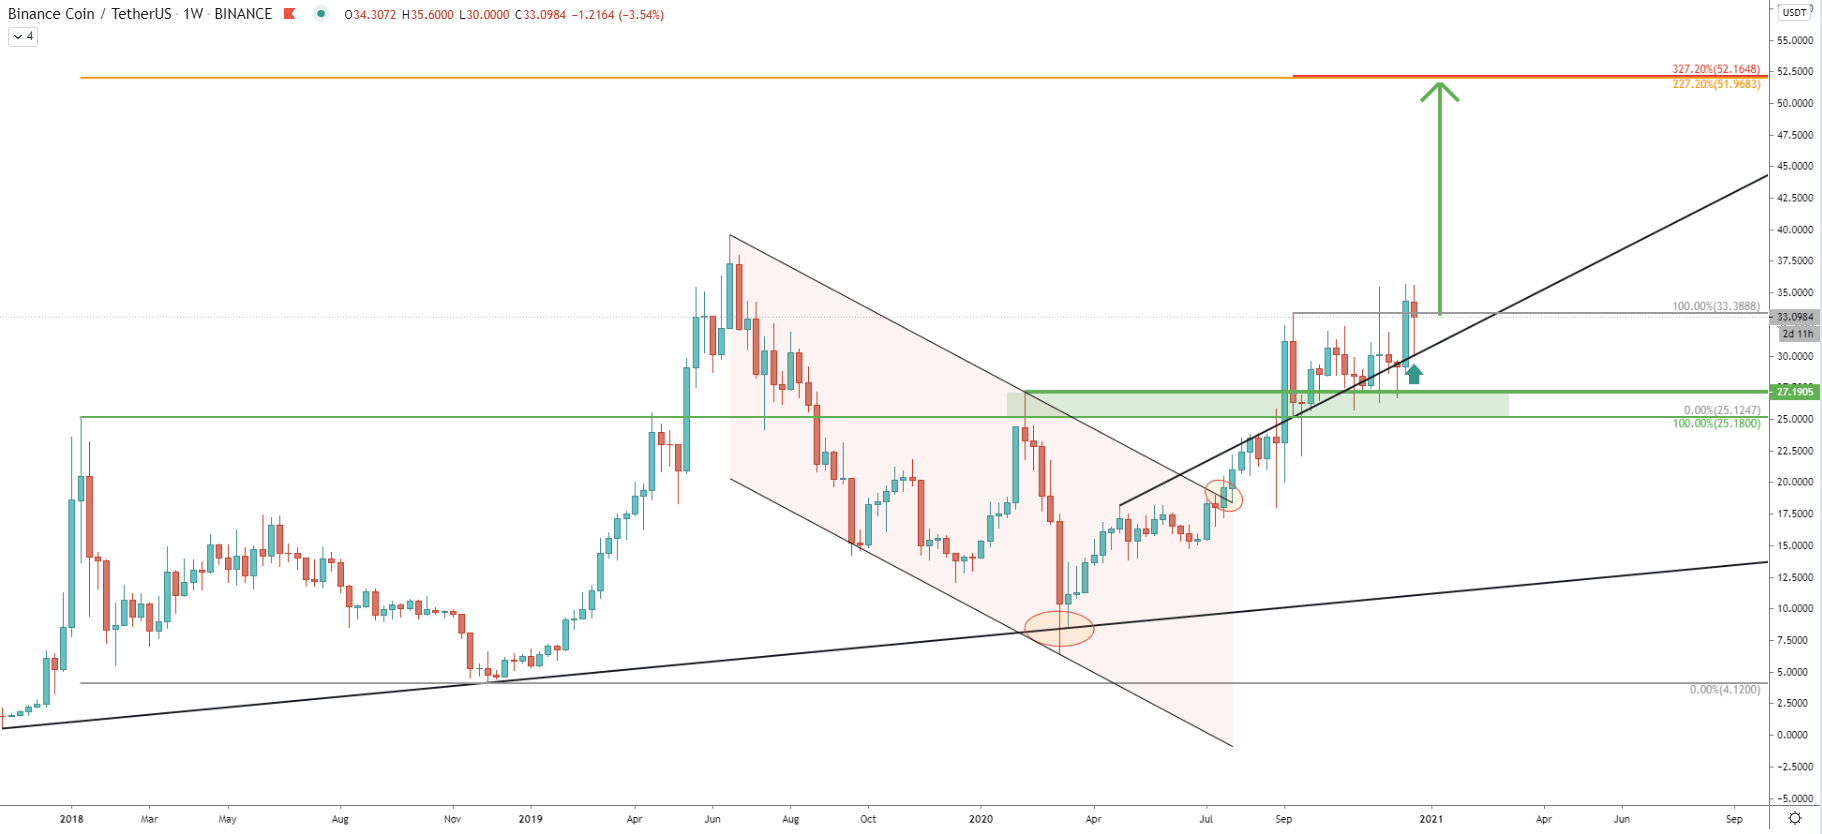
The Binance coin has been one of the most interesting cryptocurrencies throughout this year. The price has been consistently rising since March, while moving from the 6.38 low, up until the recently printed high at 35.69. Such uptrend resulted in a 360% growth in just 10 months, and what is most important that there are no strong indications that the trend is about to end.
Quite to the contrary, there are far more bullish signs than bearish, which means the probability remains in favor of an uptrend continuation. After BNB rejected the long-term uptrend, it broke above the descending channel back in July, after which the price went further up and broke the key resistance area near 27.19.
As can be seen, this resistance area has now become the support, which has been rejected consistently during the past three months. At the same time, the average-price uptrend trendline got rejected, and then price produced yet another higher high. This validates the uptrend and is likely to result in further growth, potentially towards a $52.00 resistance area.
This resistance is supported by two Fibonacci retracement levels. First is the 227.2% Fibs, applied to the first strong downside correction occurred back in 2018. The second is the 327.2% Fibs, applied to the recent correction where BNB/USDT rejected the average-price uptrend trendline. If/when this upside target will be tested, it will result in a 60% growth.
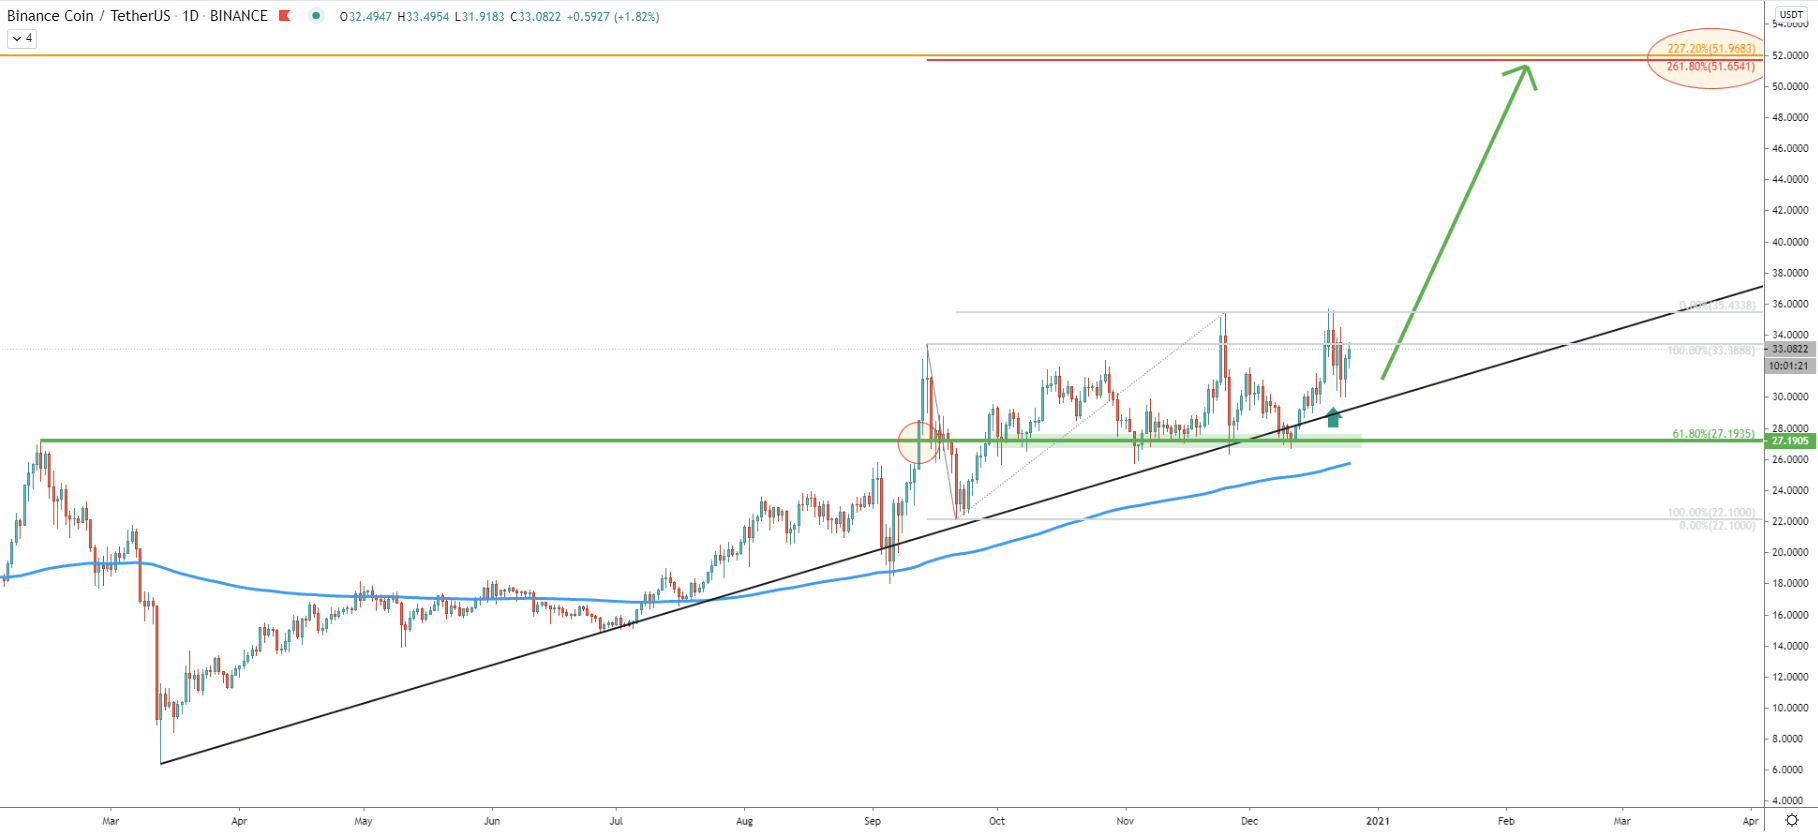
The daily chart goes to show that the simple uptrend trendline along with the 200 Exponential Moving Average is being rejected. The lower lows and lower highs pattern is in place, confirming the ongoing uptrend. The previous level of resistance at 27.19 is now acting as the support. Moreover, this support exactly corresponds to the 61.8% Fibonacci retracement level as can be seen on the chart.
Fibonacci, applied to the corrective wave down, after the 27.19 resistance got broken, shows that there is yet another Fibonacci retracement level, corresponding to the $52.00 resistance. This is the 261.8% Fibs, which is located at 51.65
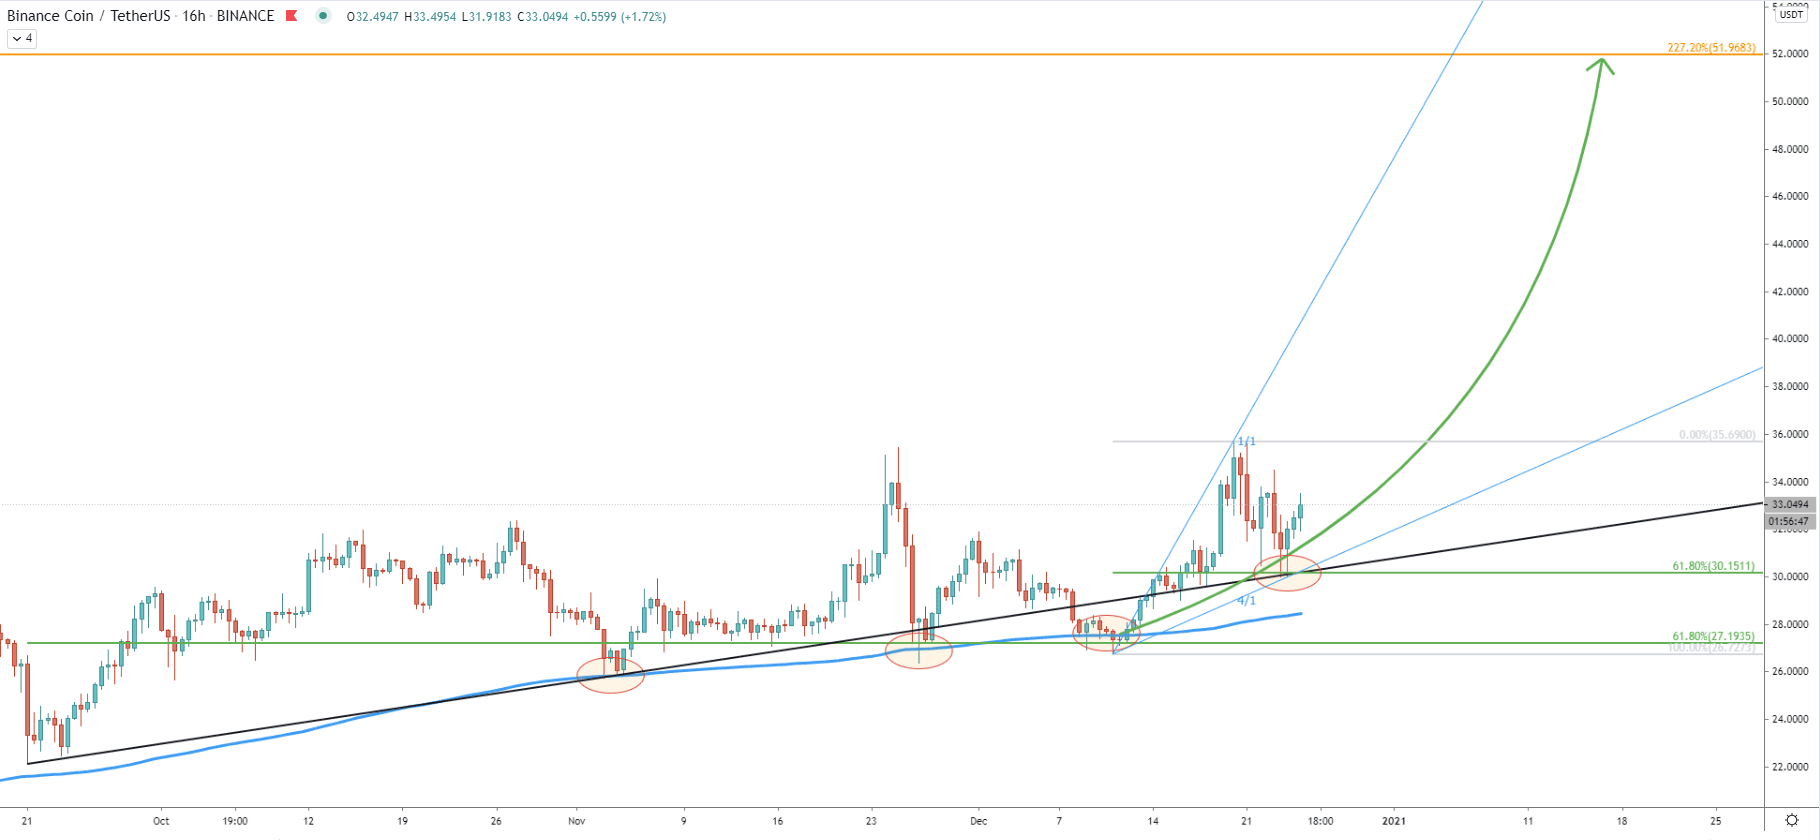
On the 16-hour chart, the price continues to bounce off the 200 EMA. As can be seen, there were already 3 bounces, implying the importance of the 27.00 support area and showing how strongly buyers are defending it. The most recent correction resulted in the rejection of the 61.8% Fibs at 30.11. At the same time, the 4/1 Gann Fan trendline was rejected. Therefore, right now, the most important support area to what is located near the key psychological level at 30.00. As long as it holds, the probability of the uptrend continuation will remain extremely high.
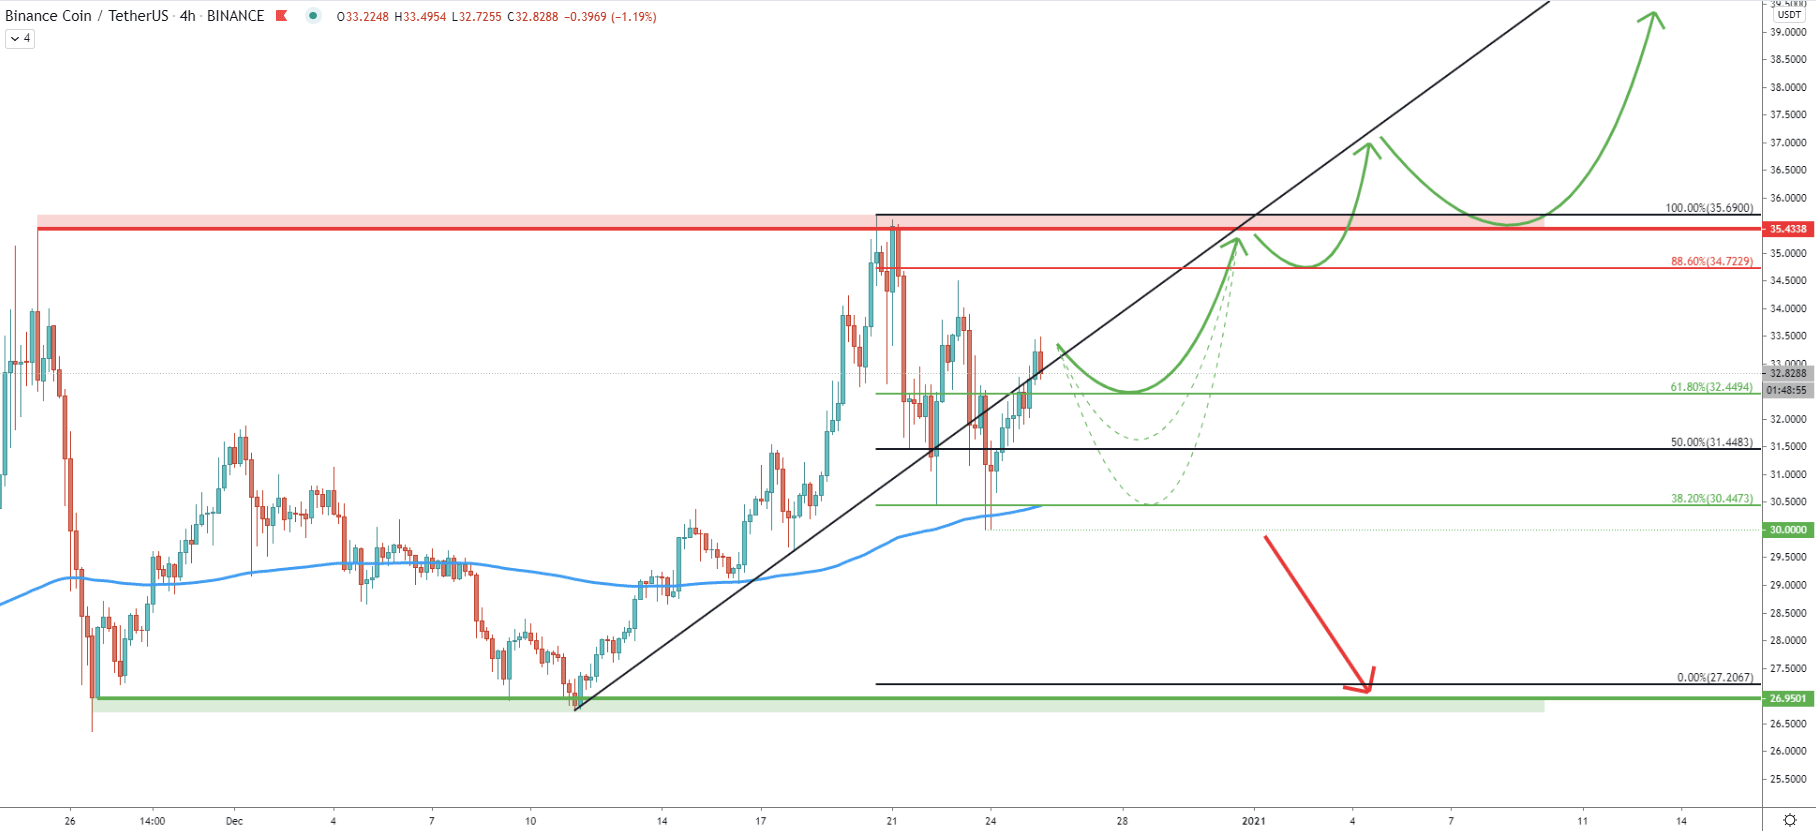
While the uptrend is intact, the current resistance area must also be taken into consideration. It can be seen taht the resistance has been formed near $35.50, where a double top has been produced. After forming a double top, BNB corrected down strongly but found support at 38.2% Fibs. This Fibonacci indicator was applied to the uptrend trendline breakout point and shows that it has been respected, along with the 200 EMA.
Currently, it seems that the correctional phase is over, and sooner rather than later the Binance coin should continue trending up. However, there could be yet another wave to the downside, to test one of the support levels as can be seen on the chart.
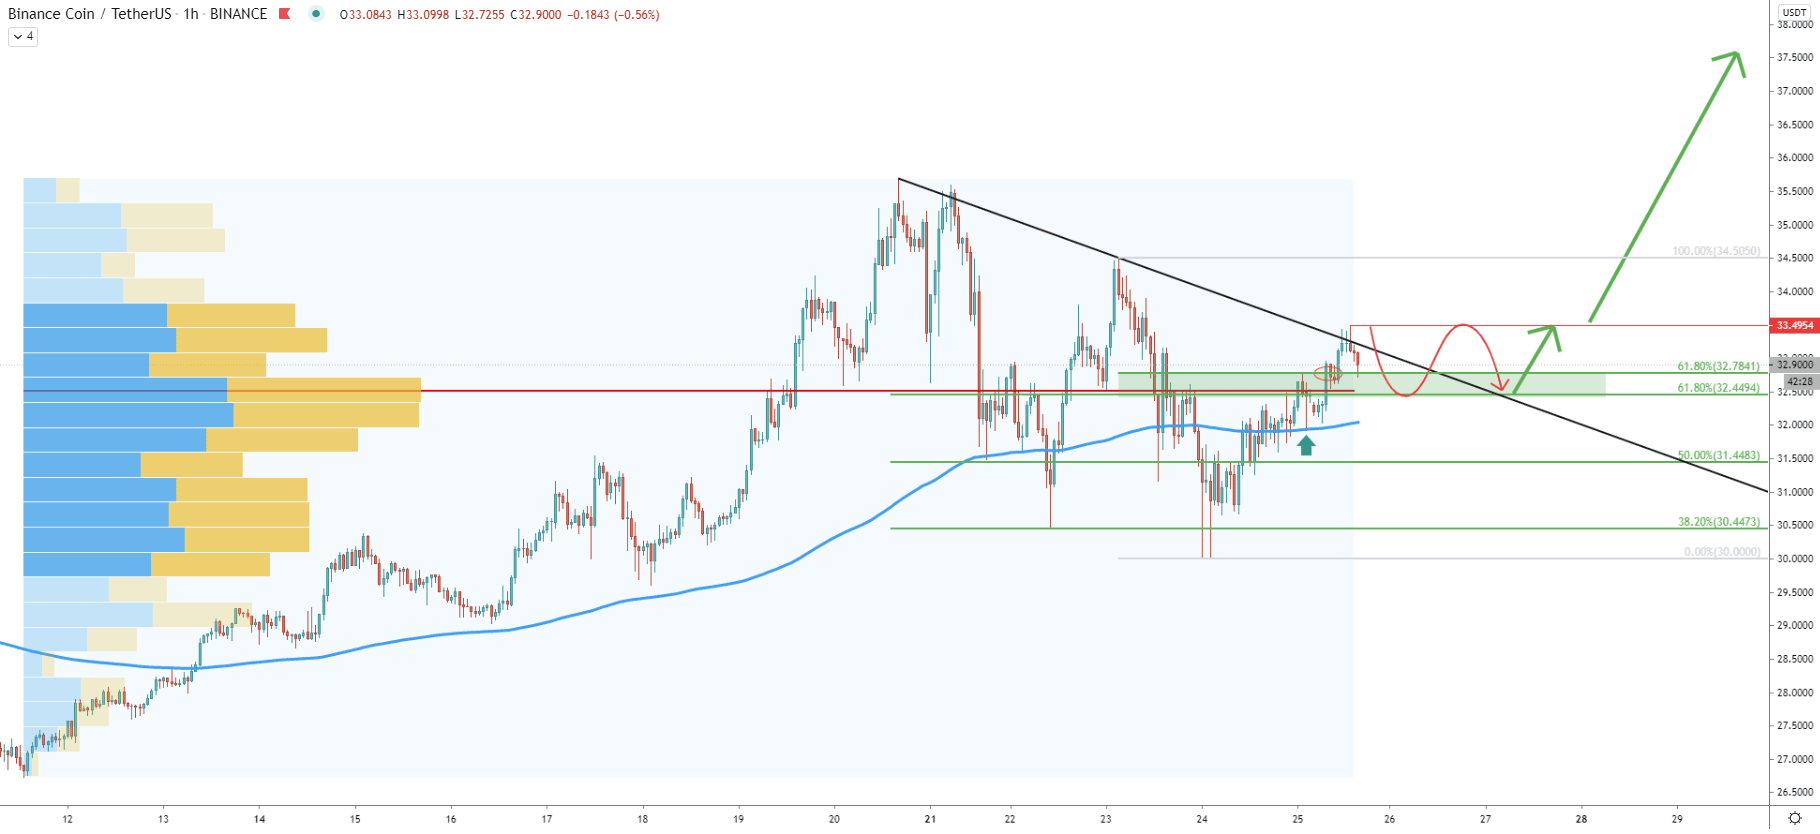
On the hourly chart, the price has rejected the downtrend trendline a 33.50. Perhaps now, this is the key resistance that must be broken for the price to continue rising. Up until then, the consolidation might take place between the 33.50 resistance and 32.50 support. Based on 2x61.8% Fibs, the resistance area is formed between 32.44 and 32.78 and is likely to act as a strong demand zone. Besides, the Volume Profile indicator is pointing out to the same price area and confirmed that this is where the most trading volume has been recorded Since December 12.
Most likely buyers will wait for the confirmation of the uptrend, which could be the break above the downtrend trendline as well as the 33.50 resistance area. Only then, buying volume should increase, and the price could be heading up, towards the 52.00 upside target.
The Binance count trend is clearly very bullish. It seems that this is only a matter of time when it will continue. But there is one important resistance, which must be broken in order to confirm bullish pressure. This is the 33.50 level, where the recent price bounced off the trendline. As soon as the break above will be confirmed, BNB/USDT should be expected to rise towards the 52.00 resistance area, which will result in a 60% growth.
As per the weekly and daily chart, there are 3 different Fibonacci retracement levels all pointing out to one upside target. This is the 52.00, which is likely to act as a strong supply zone if/when reached.
As per the 4-hour chart, a break below the 30.00 psychological support, will immediately invalidate the bullish outlook. In this scenario, the price is highly likely to move towards the bottom of the range, which is near the 27.00 level.
Support: 32.78, 32.44, 31.44, 30.15
Resistance: 33.49, 35.69, 51.96