Published: May 26th, 2022
The smart contract provider Tezos has a strong presence in the crypto industry as it is more advanced and sophisticated than Ethereum. One of the significant factors of the Tezos blockchain is that it can evolve and improve over time without any risk of the hard fork. Furthermore, the native token of the network is XTZ, where this asset holder can vote on proposals on upgrading the protocol.
According to some industry experts, the Tezos platform is secure and upgradable, where its smart contract language comes with higher accuracy than traditional Ethereum or Bitcoin. The XTZ’s market dominance was exposed by multiple higher high creations in the higher timeframe, where the latest bullish swing came with a 333% gain by reaching the $7.00 level. However, the price became corrective and pushed lower, followed by the broader crypto market crash, which came from the stronger US Dollar.
Almost 97% of tokens are in circulation, with a market capitalization of $1.78 billion. Let’s see the future price direction of Tezos (XTZ) from the XTZ/USDT technical analysis:

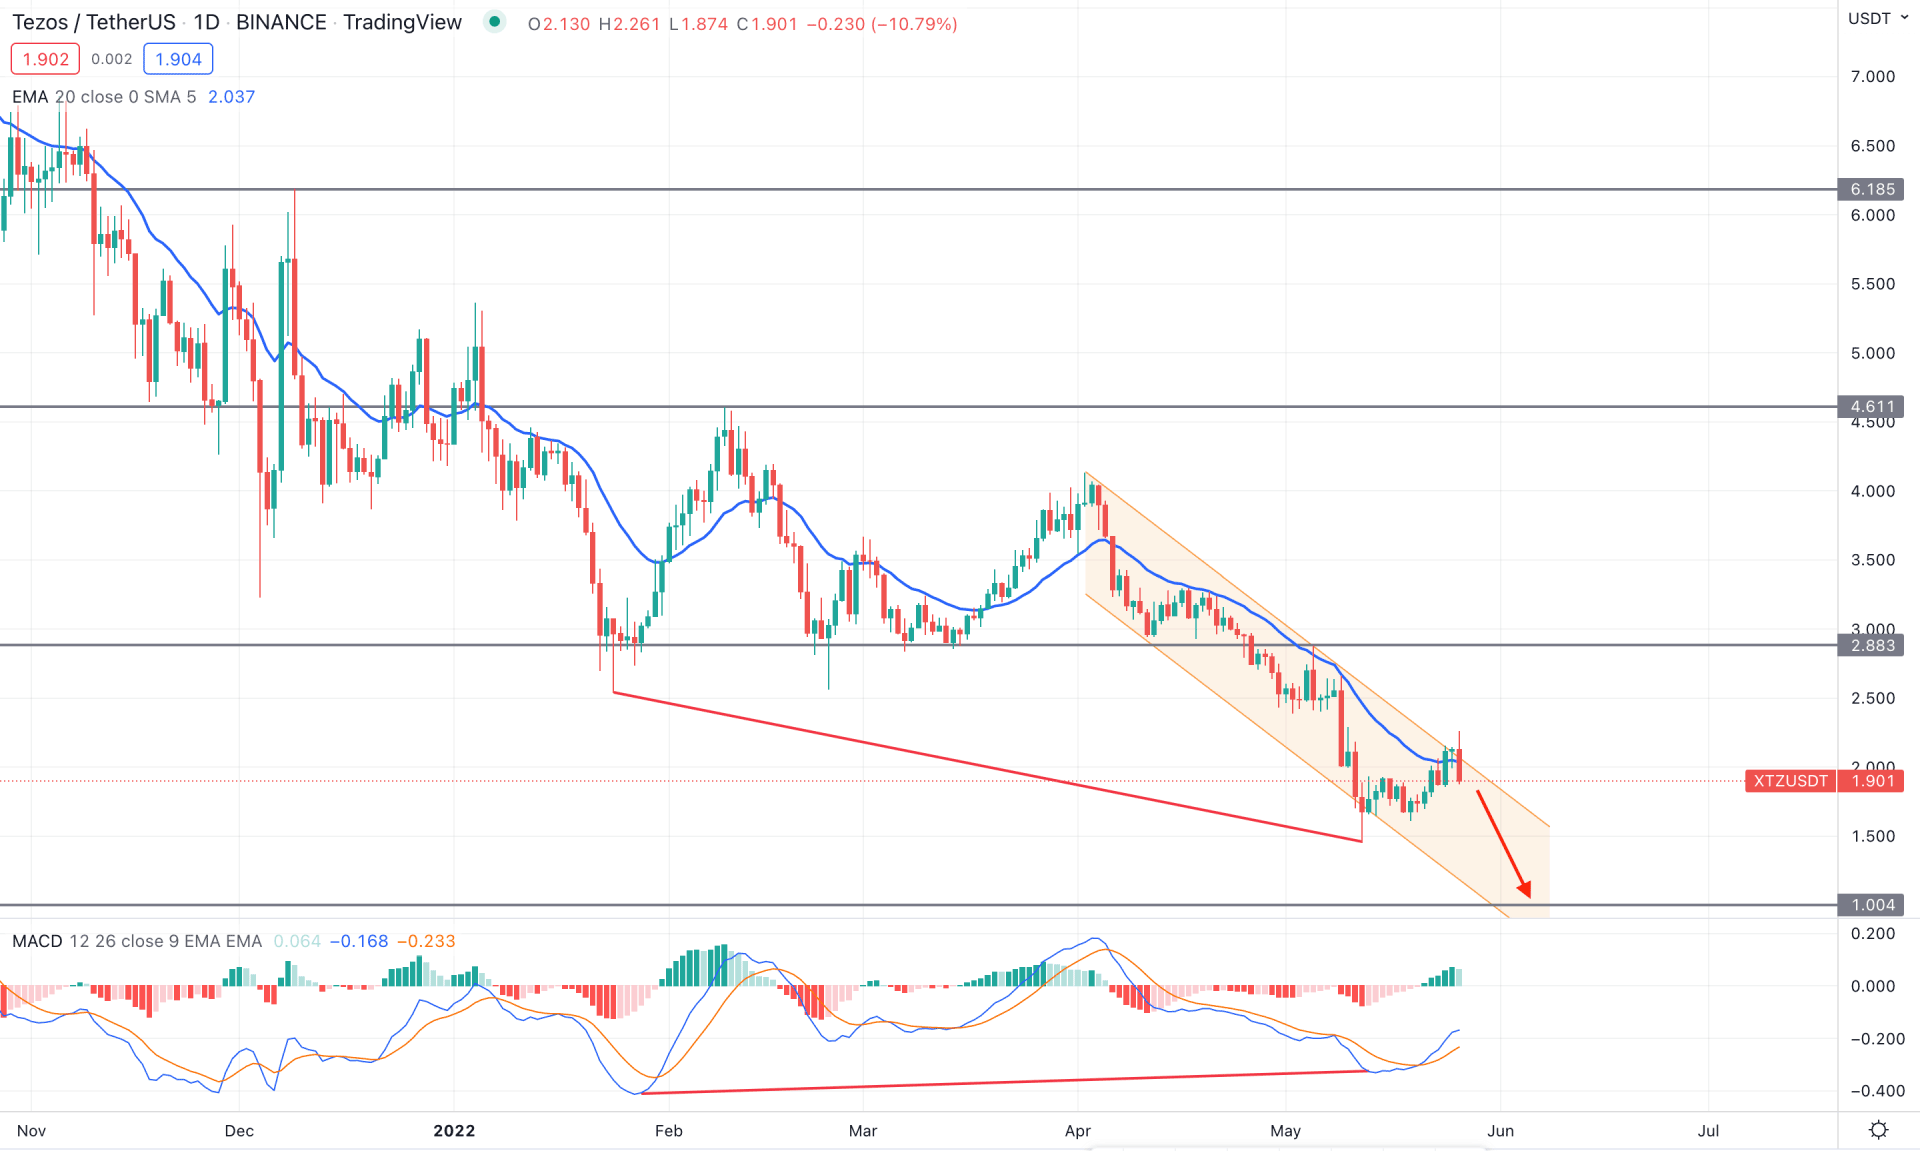
XTZ/USDT price is trading within a bearish pressure, came from the 9.17 swing high, and there is no sign of any swing highs’ violation. Moreover, the selling pressure left multiple supply levels like 6.18 and 4.61 that are still untested. In that case, the crypto bull run would test those supply levels as a part of the liquidity grab. However, as the current price trades within the bearish channel, a strong bullish breakout would change the market trend from bearish to bullish.
The above image shows the daily chart of XTZ/USDT, where the current price faces a dynamic resistance from the 20 EMA. Moreover, the latest daily candle showed a bullish rejection ignoring the sentiment from the MACD divergence. Although the MACD Histogram is bullish, it cannot make new highs where any intraday bearish pressure would shift the Histogram’s momentum.
Based on the daily context, investors should closely monitor how today's daily candle closes where the violation of the intraday swing low would extend the bearish pressure towards the 1.00 support level. On the other hand, any strong bullish breakout from the channel resistance with a swing high would increase the bullish momentum, where the primary target is to test the 2.88 resistance level.

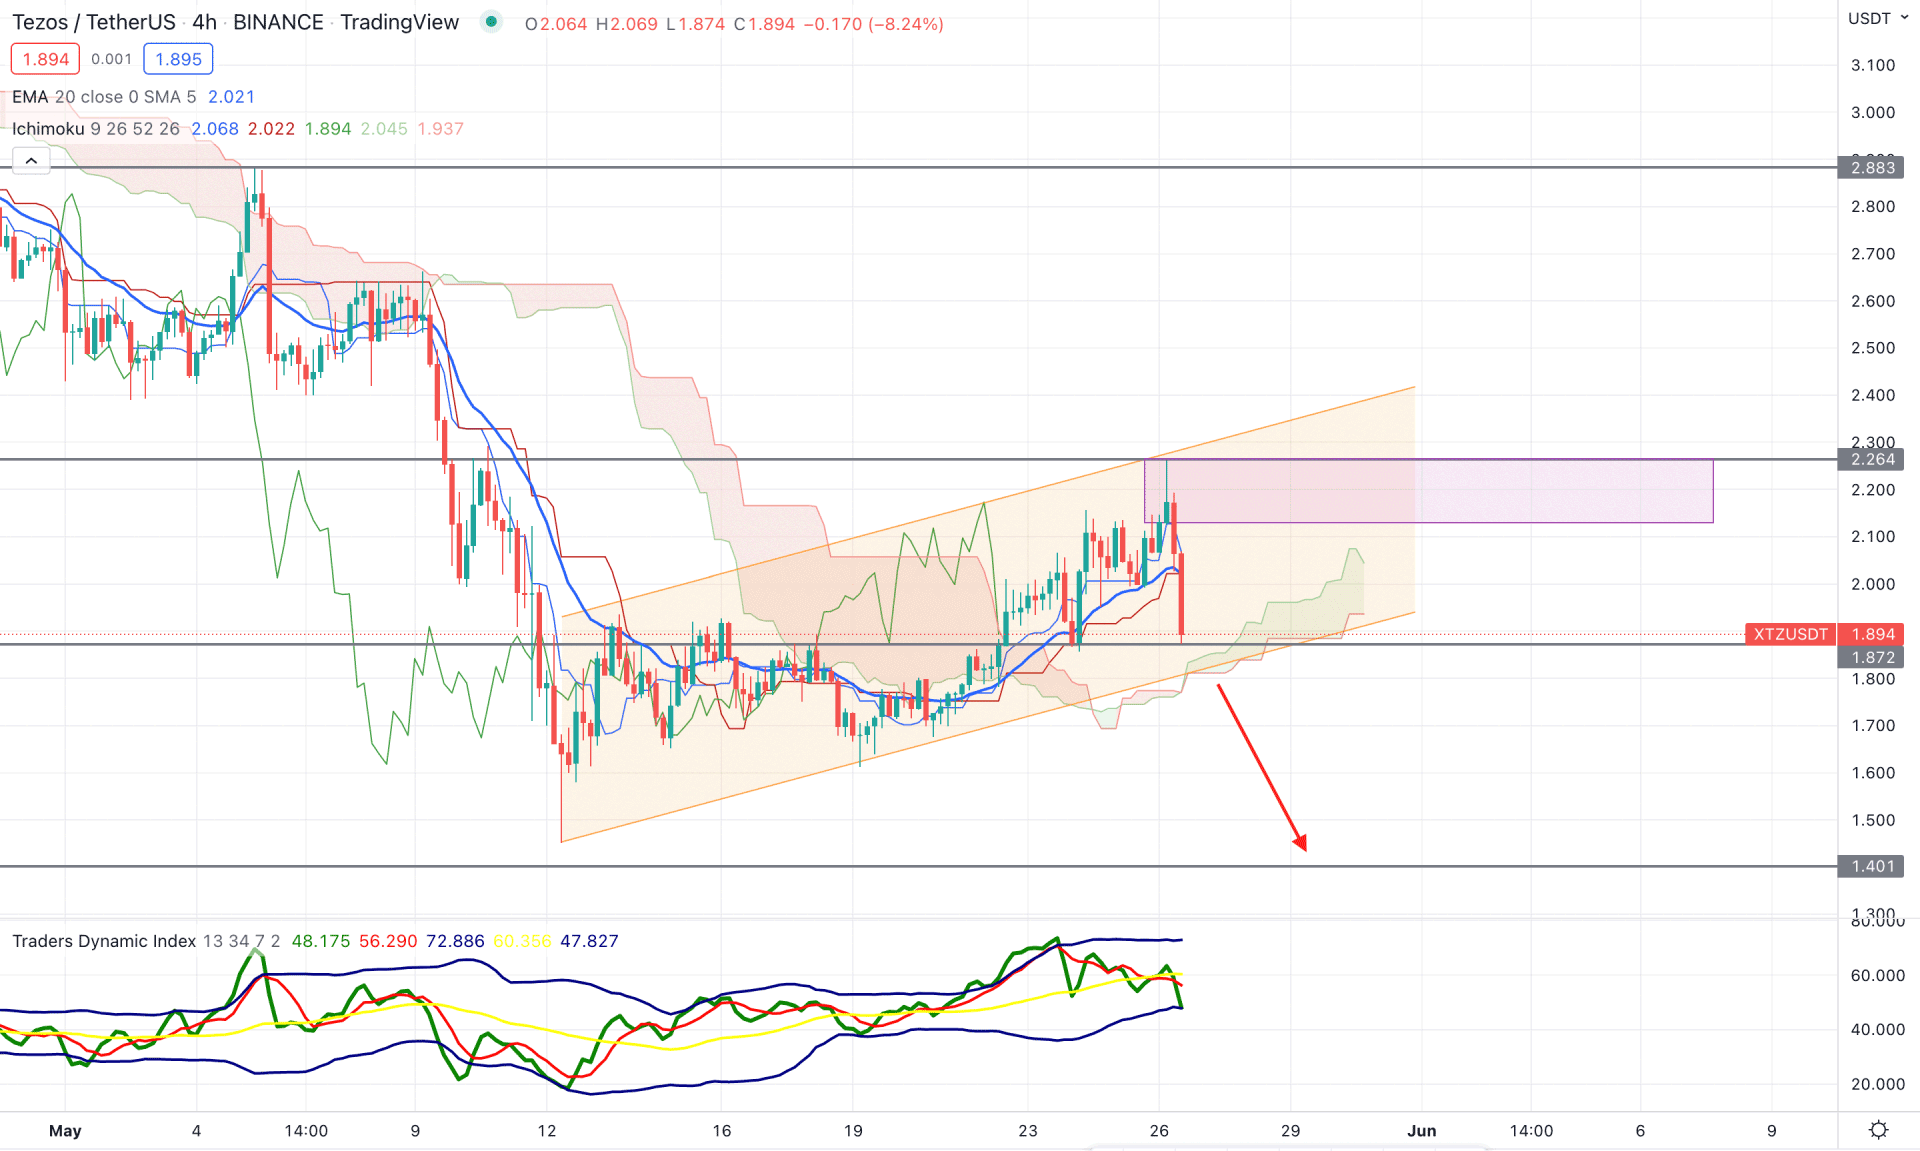
According to the Ichimoku Cloud, XTZ/USDT price is trading with intense selling pressure, although the Senkou Span A is above the Senkou Span B in the future cloud. The buying pressure above the Cloud area halted after rejecting the 2.26 resistance level with a bearish H4 close from where an impulsive selling pressure came. Moreover, the current price trades within a bullish channel, where any bearish breakout would increase the selling opportunity.
The above image shows how the selling momentum increased from the Traders Dynamic Index indicator. The TDI line reached the upper band area but failed to hold the momentum above the 50 neutral level. Moreover, the recent H4 candle close below the dynamic Kijun Sen is a sign that bears are active in this instrument.
Based on the H4 context, investors should find a bearish H4 candle below the channel support to consider the upcoming price momentum as bearish. In that case, the primary target is to test the 1.40 support level from where a correction may appear. On the other hand, the alternative approach is to find a strong bullish rejection from the 1.87 immediate support level and an H4 close above the dynamic Kijun Sen. In that case, the price may increase towards the 2.40 psychological level in the coming hours.

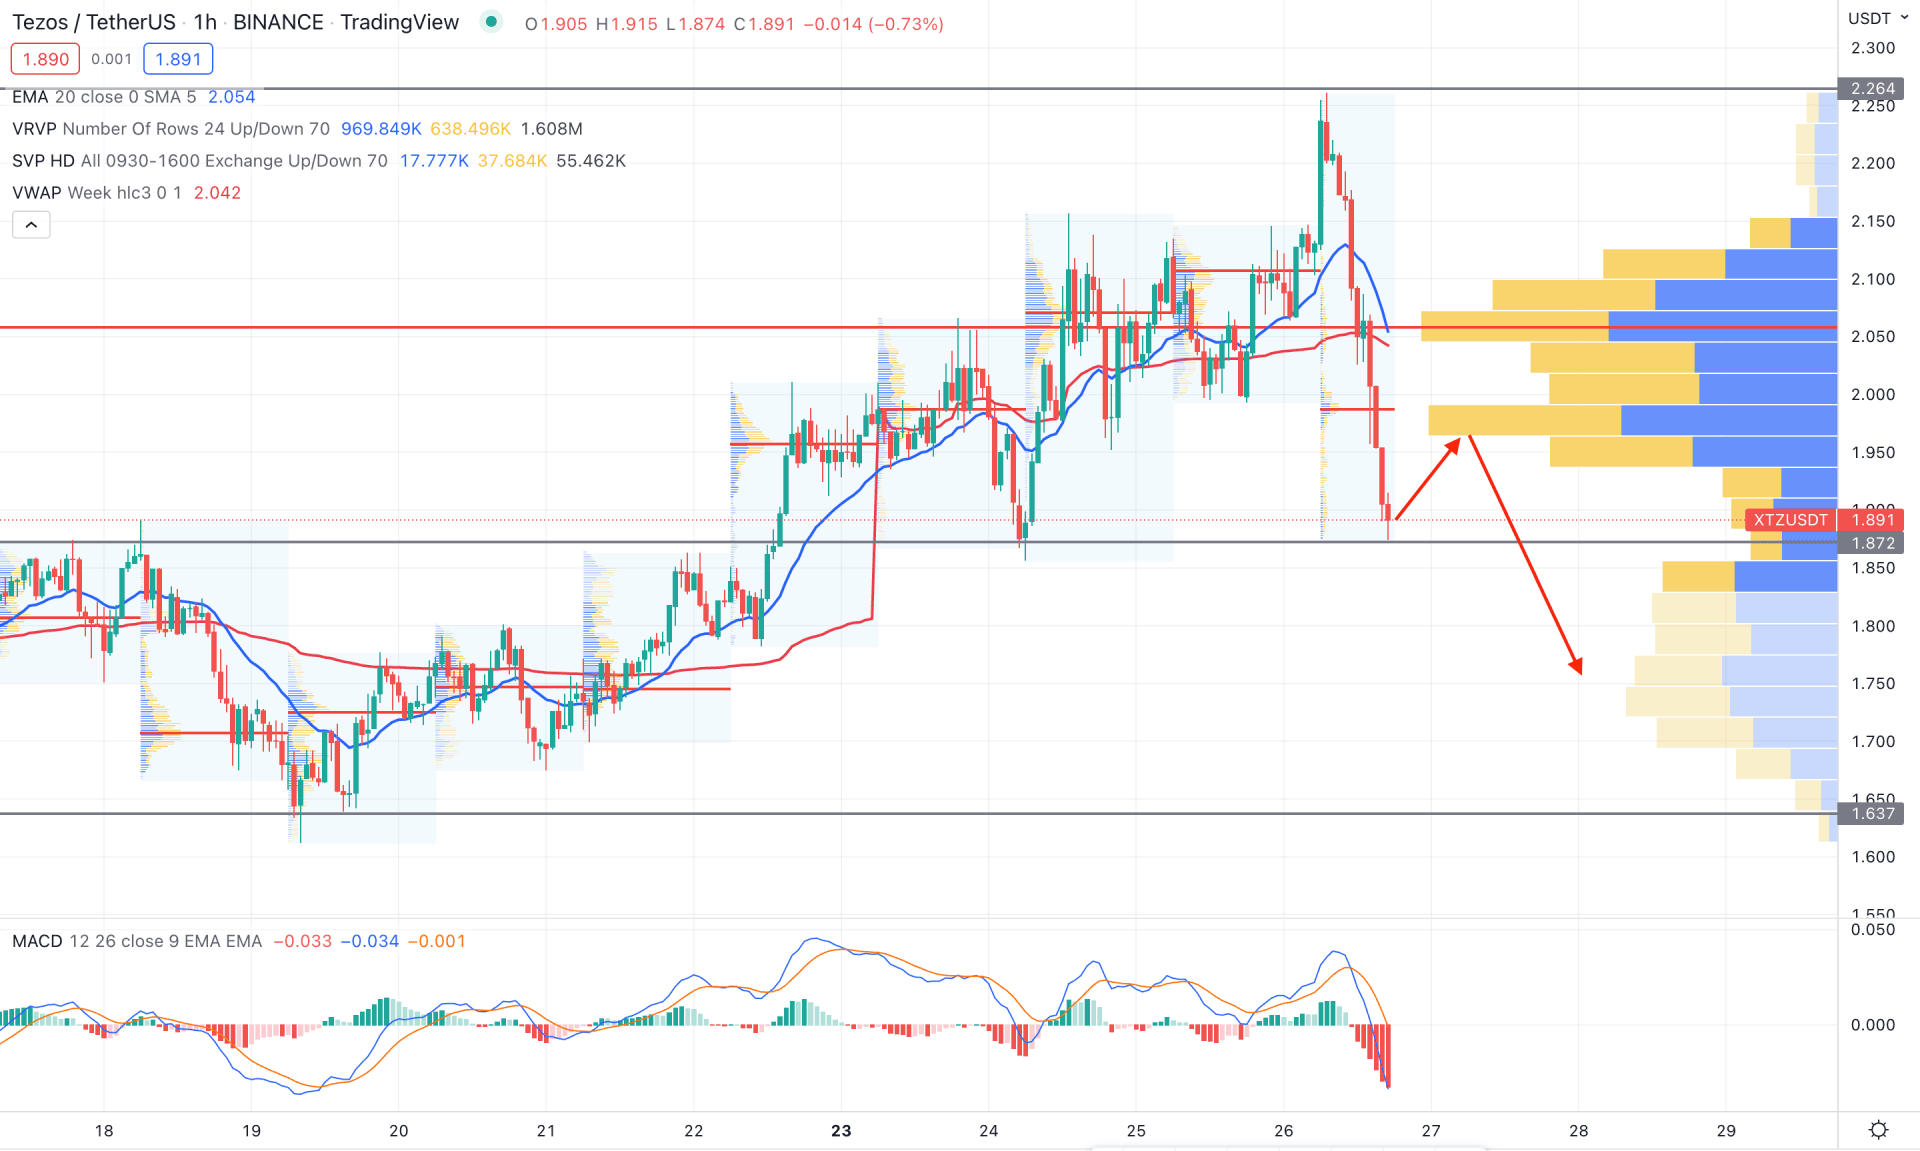
In the intraday chart, XTZ/USDT price trades within an intense selling pressure where the current highest trading volume on the visible range is at the 2.05 level. In that case, the primary trading approach is to look for bearish opportunities as long as it trades below the 2.05 level. Moreover, the latest intraday high volume level is at 1.98, above the current price.
The above image shows how the MACD Histogram made a new low, indicating an oversold price. However, the dynamic weekly VWAP is above the price and aimed lower. In that case, a minor bullish correction is pending in this pair, but any bearish rejection from the 1.900 to 2.00 area would be a potential bearish opportunity.
As per the current multi-timeframe analysis, XTZ/USDT trades within an intense selling pressure where the current bearish channel extension might reach the 1.00 support level. Investors should monitor how the price trades in the intraday chart where the H1 high volume areas would be the best point to short in this pair.