
Published: September 24th, 2020
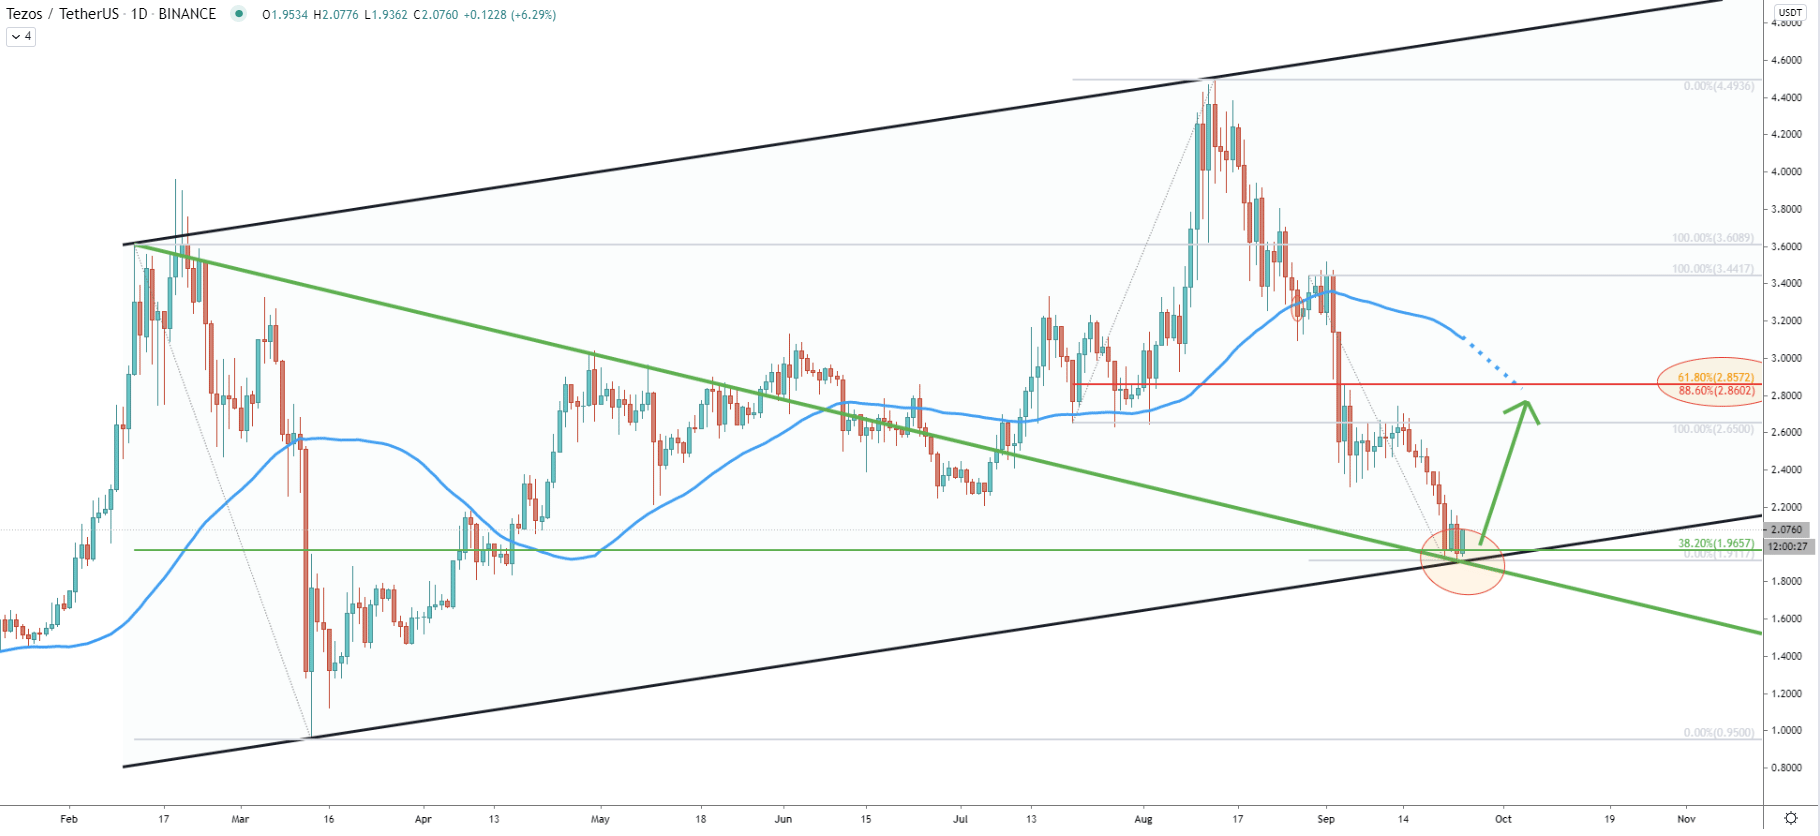
Through this week, XTZ/USDT has been rejecting the bottom of the ascending channel, and so far successfully. At the same time, the price has bounced off the average price downtrend trendline as well as 38.2% Fibs applied to the previous corrective move down. While price went slightly below the 1.96 support, the daily closing price remained above, which is a strong indication that buyers are defending this area.
As long as daily closing prices are above the recently produced low at 1.91, Tezos will start moving to the upside. The key resistance is located at 2.85 and is confirmed by 3 different indicators. First is the 88.6% Fibs applied to the last wave up, when XTZ topped out back in August this year. The second is the 61.8% Fibs applied to the last wave down after price broke below the 50 Simple Moving Average. The third is the extended 50 SMA, which corresponds precisely to the potential upside target.
Back in September this year, Tezos broke below the long-term uptrend trendline, after which price went down sharply. The overall decline was 57% as the price moved from 4.49 high to 1.91 low in just 39 days. In order to find the potential bottom, a 50% Fibonacci retracement level was applied to the trendline breakout point. This is to show that the distance from the top to the uptrend trendline equals the distance from the breakout point to the bottom. In most cases, if the 0% Fibs, which is the final downside target, is rejected, the price could have bottomed out. And this was the case with the XTZ/USDT as the price has bounced off the 0% Fibs at 1.95 with no daily closing price below.
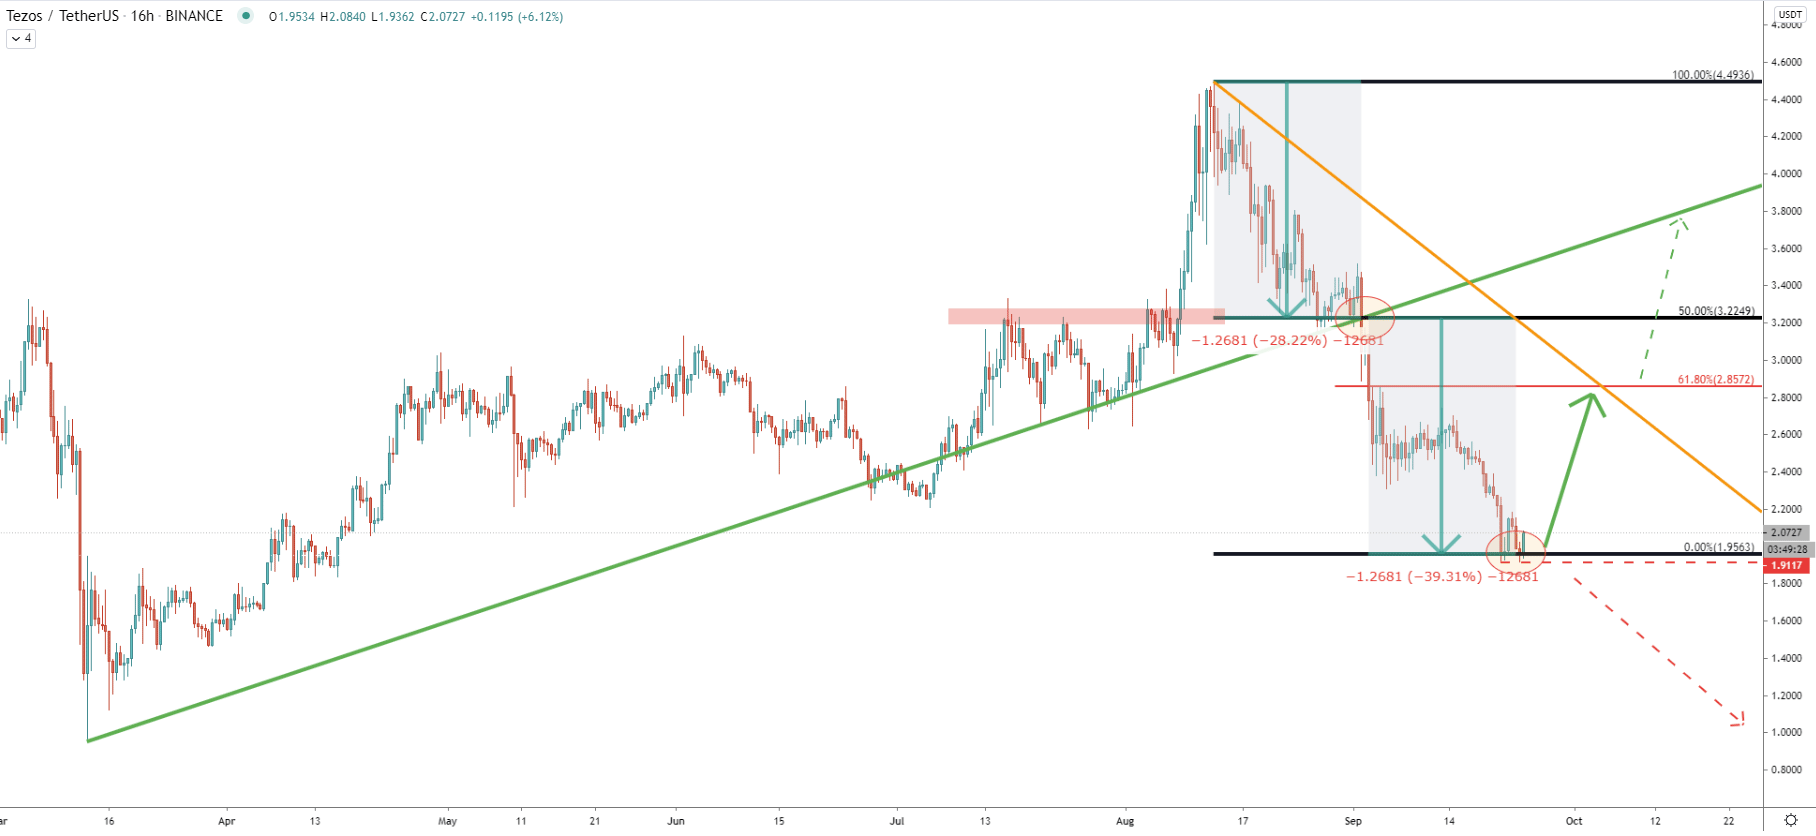
Fibonacci is applied to the previous corrective wave up, where the average-price downtrend trendline was rejected. It shows the price bounce off the 227.2% retracement level at 1.91. Tezos jumped off the support not one, but two consecutive times, producing the double bottom and suggesting the potential trend reversal to the upside.
Although prior to the strong move, XTZ/USDT must break above the nearest resistance located at 2.27. This level is confirmed by the 23.6% Fibonacci retracement level and corresponds to the average and simple downtrend trendlines. When/if a break above 2.27 will occur, Tezos should rise towards 2.85, which on this chart corresponds to the 200 Simple Moving Average.
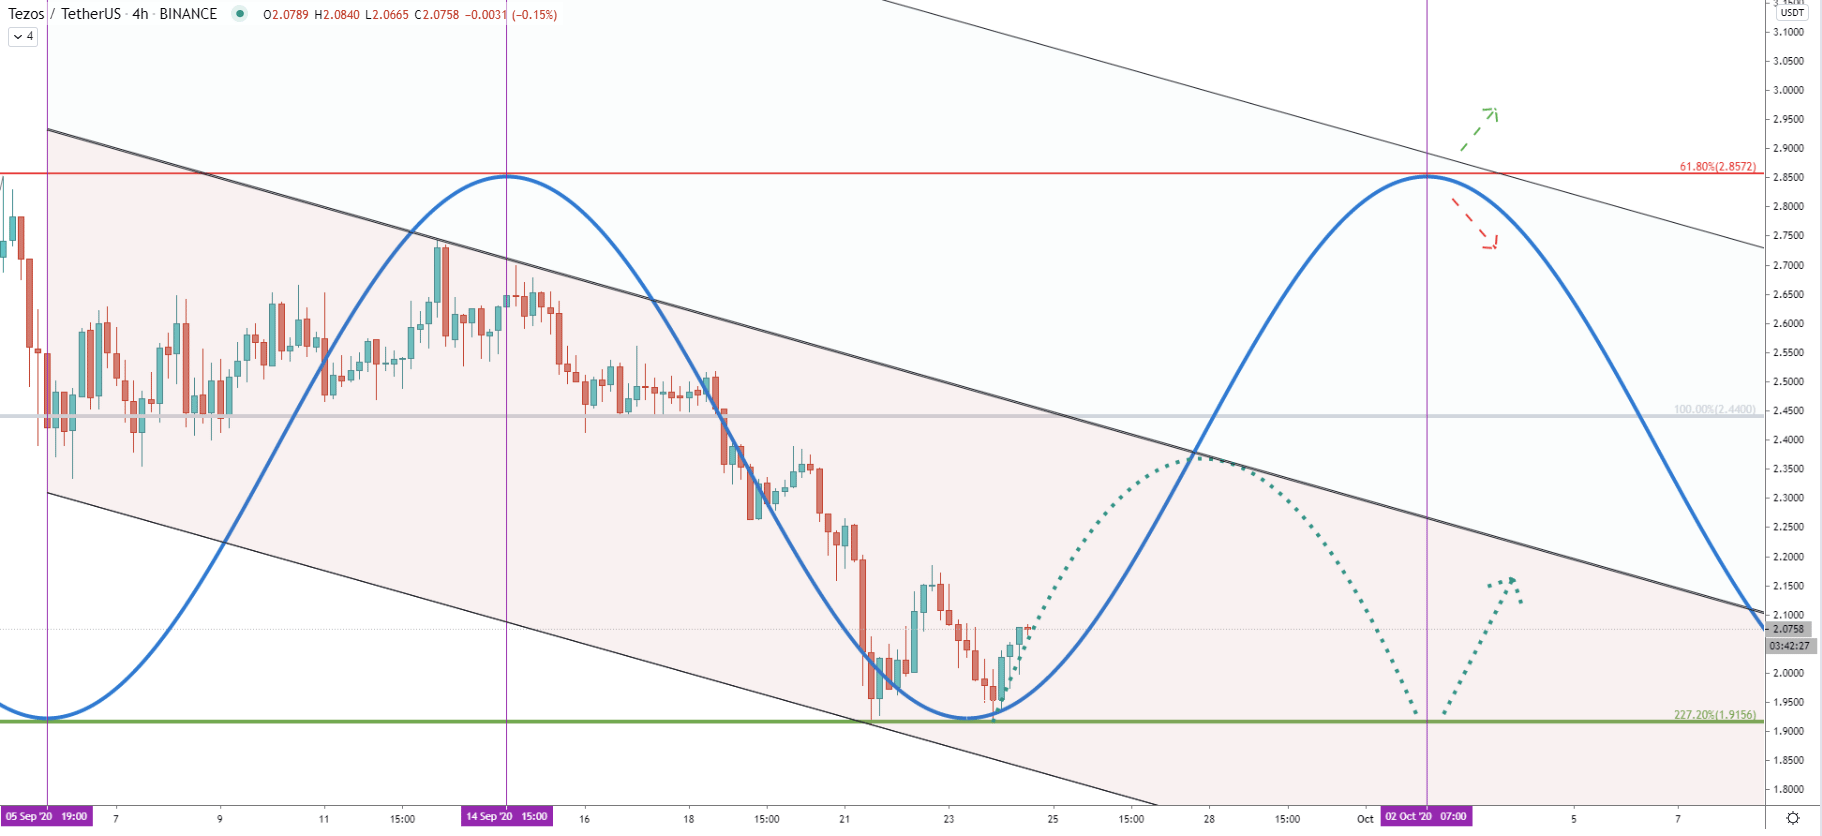
Tezos has reached and rejected the bottom of the descending channel after which produced a double bottom. Based on the cycle analysis, the new bullish cycle could be about to start or has already started. If the price will continue to rise, the upside target at 2.85 should be tested as soon as October 2, which is just 8 days away. It can be seen that the 2.85 resistance level corresponds to the extended descending channel, and goes perfectly in line with the next cycle. But at the same time, the price might continue to range up until October 2 and only then initiate the upside move as long as the current support holds.
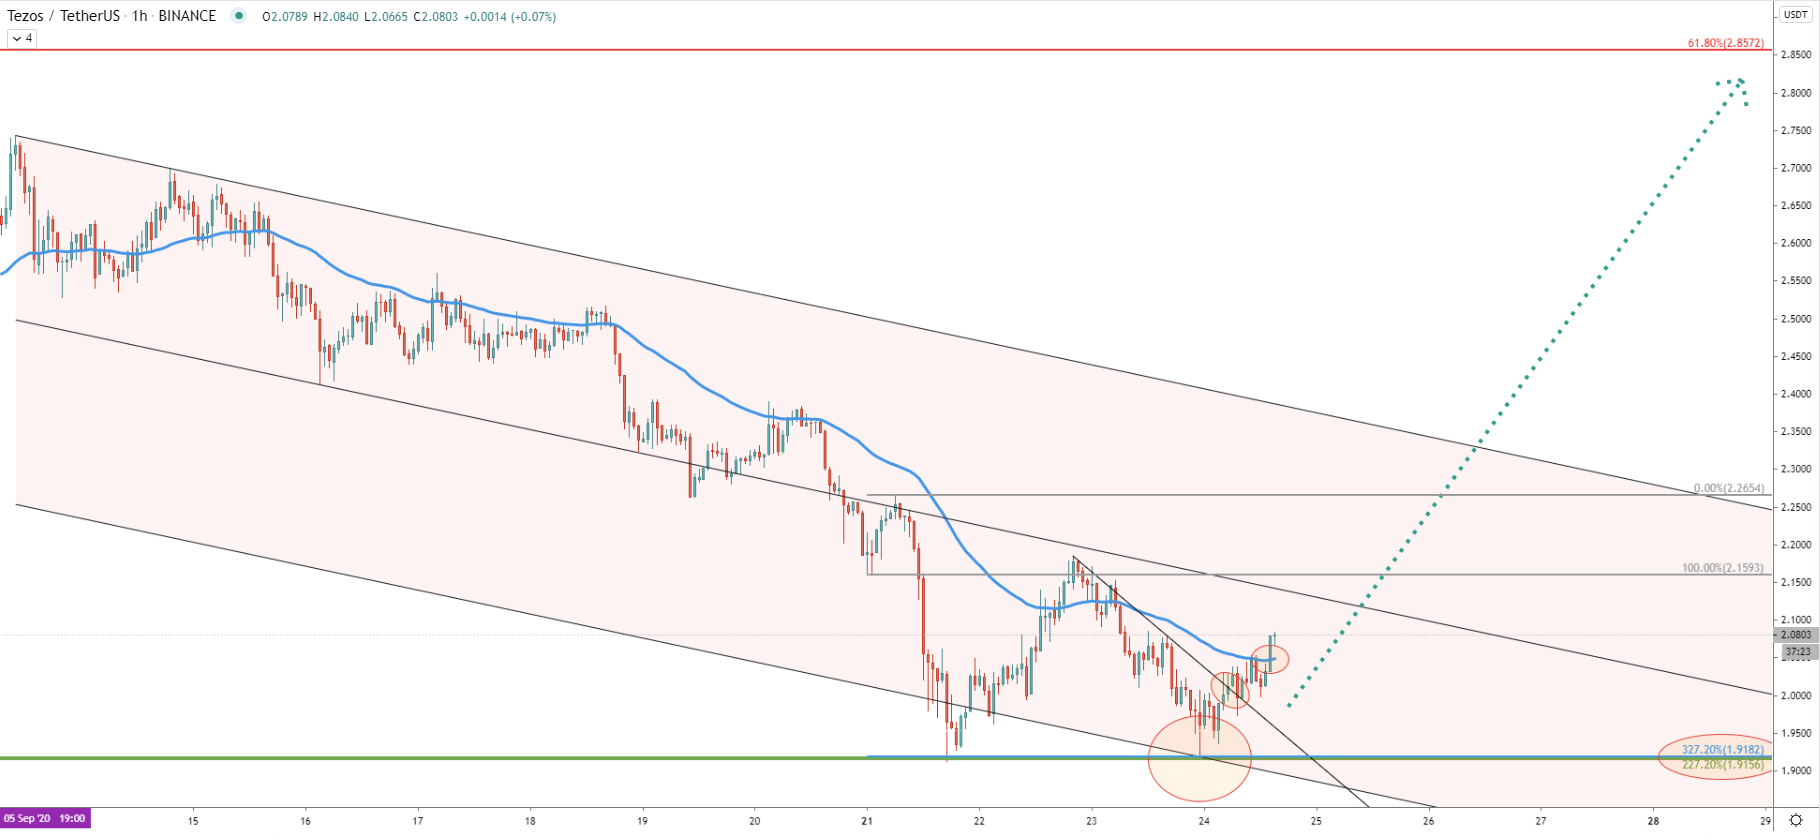
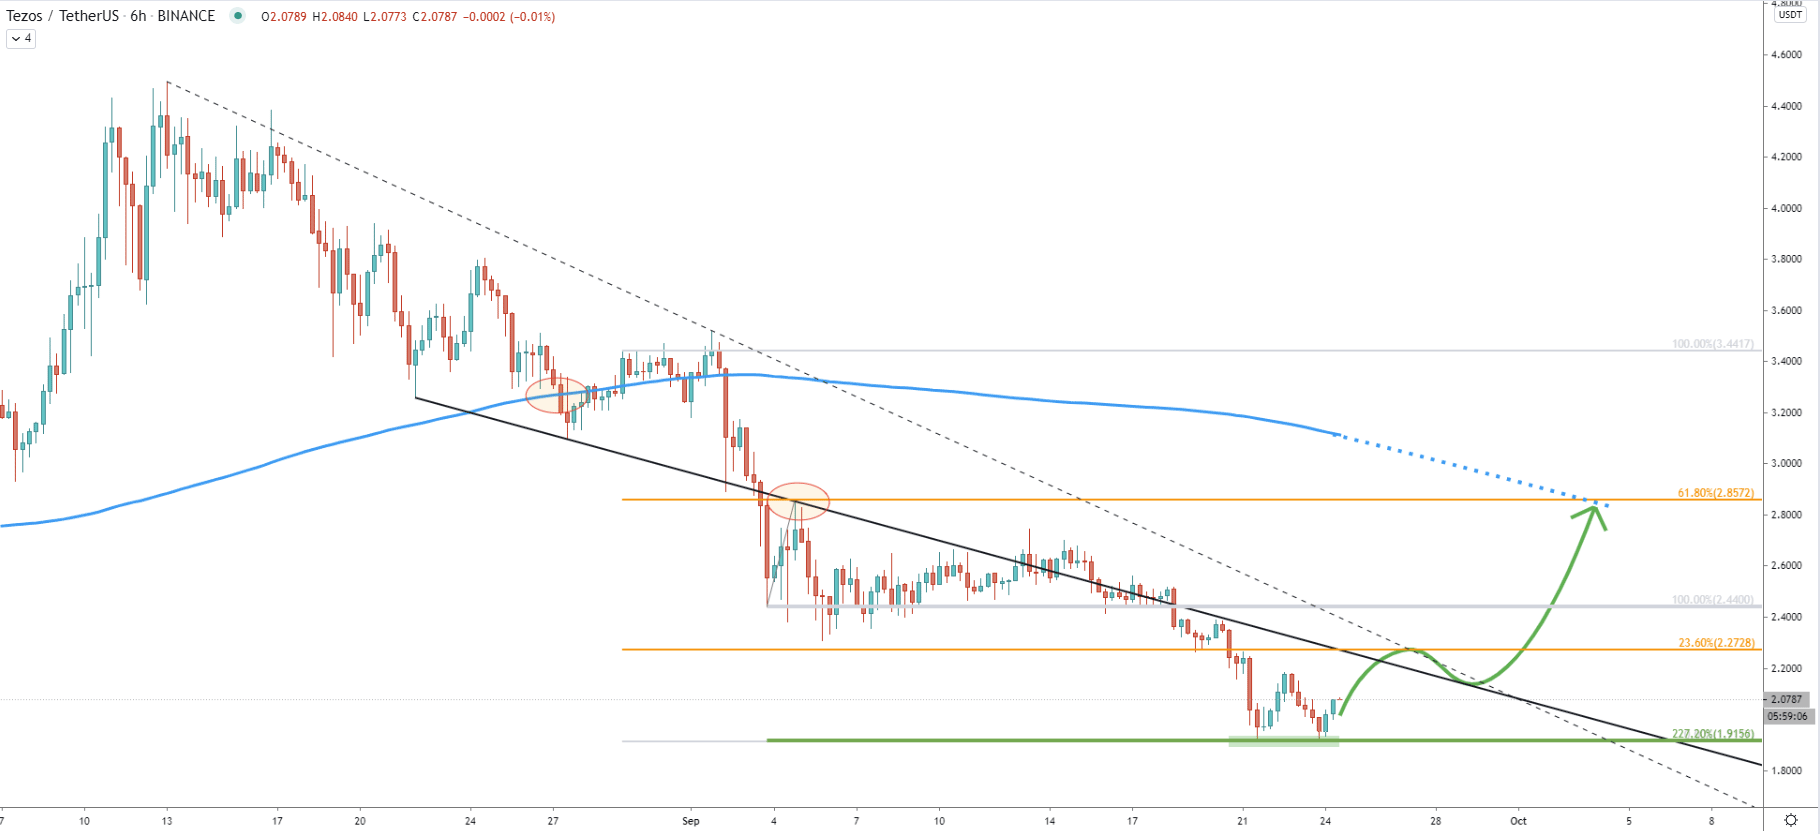
Today XTZ/USDT cleanly rejected the bottom of the extended descending channel when tested 1.91 low. On this chart, this support level now also corresponds to the 327.2% Fibs, applied to the corrective wave up after price broke below the channel.
After the rejection of the 1.91, Tezos went up and broke above the downtrend trendline followed by the 50 EMA breakout. Certainly, this looks like the upside correctional move is now confirmed. Nonetheless, the price can still consolidate and even attempt to produce spikes below the 1.91, before/if upside correction will begin.
XTZ/USDT has formed a strong bottom at 1.91 while rejecting multiple Fibonacci support levels as well as lower trendlines of ascending and descending channels. The current price is extremely important and if buyers will be able to defend 1.91 support, a strong correctional move to the upside or even a long-term trend reversal should be expected.
As per the daily and 6-hour charts, there is one strong resistance level located at 2.85. It is confirmed by two Fibonacci retracement levels as well as two extended moving averages. All-in-all, there is a 40% growth potential that might take place in the nearest future.
As per the 16-hour chart, the key support level is located at 1.91. Daily break and close below this support will invalidate the bullish forecast and Tezos could move much lower, potentially towards the 1.00 psychological level, which previously also acted as the support.
Support: 1.91
Resistance: 2.27, 2.85