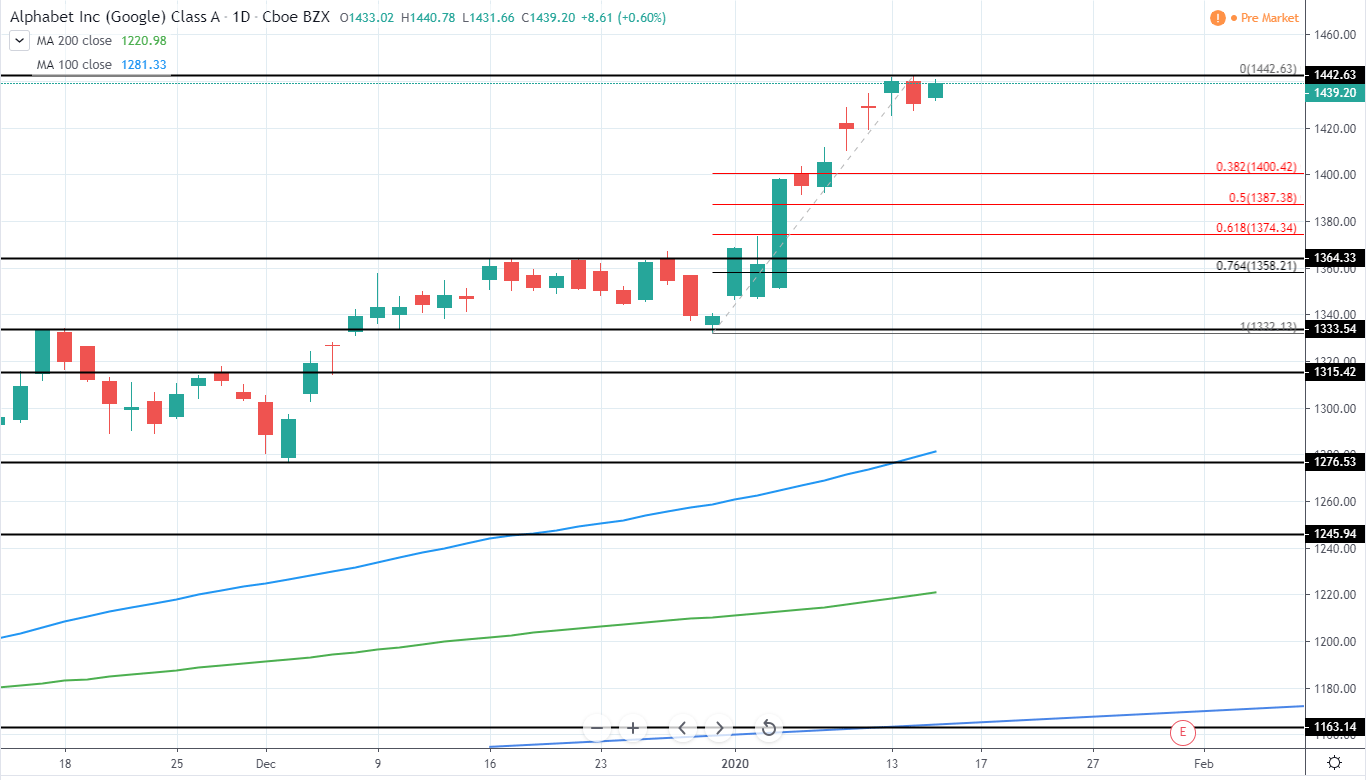
Alphabet, Inc. (GOOGL) currently trades around 1,439 USD with a market cap of 992B USD as it continues to set new all-time highs and extending even further away from the previous high of 1364 USD. Since the price has extended so far we advise not to enter a long position right now and the best option would be to wait for a considerable retracement.
On Tuesday we saw a very bearish engulfing candle close and this could be the first sign of upcoming retracement towards the previous high around 1364 USD as well as 50-61.8% Fib retracement area around 1374-1387 USD. Once the price reaches these levels and starts to show signs of reversal an entry can be entered with a good risk/reward potential as we expect the several month bullish momentum to continue.
GOOGL Daily:
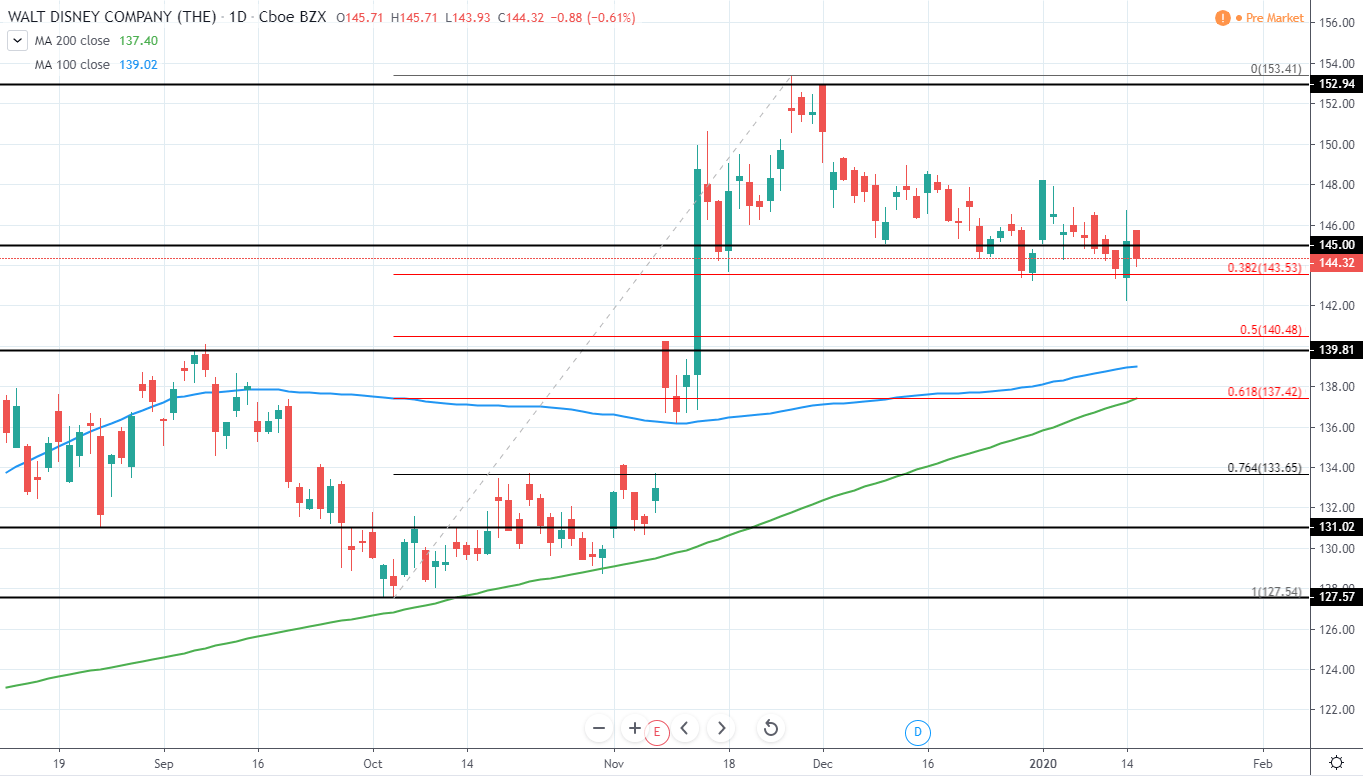
The Walt Disney Company (DIS) currently has a Market Cap of 260B USD and trades around 144.32 USD as it continues to retrace and set lower local lows after peaking around 153 USD at the end of November and setting another higher high for the overall trend.
The price action has continued to respect previous support around 145 USD in addition to 38.2% Fib retracement, however, entry right now would not offer the best risk/reward and further downside is needed.
A potential area, where support could be likely found, can still be seen around 140 USD minor support/resistance level as well as area between 50-61.8% Fib retracement around 137.3-140.5 USD as well as area between both 100 and 200 day moving averages around 138.66 and 136.73 USD respectively.
For now, however, it is best to stay neutral and wait for a further retracement.
DIS Daily:
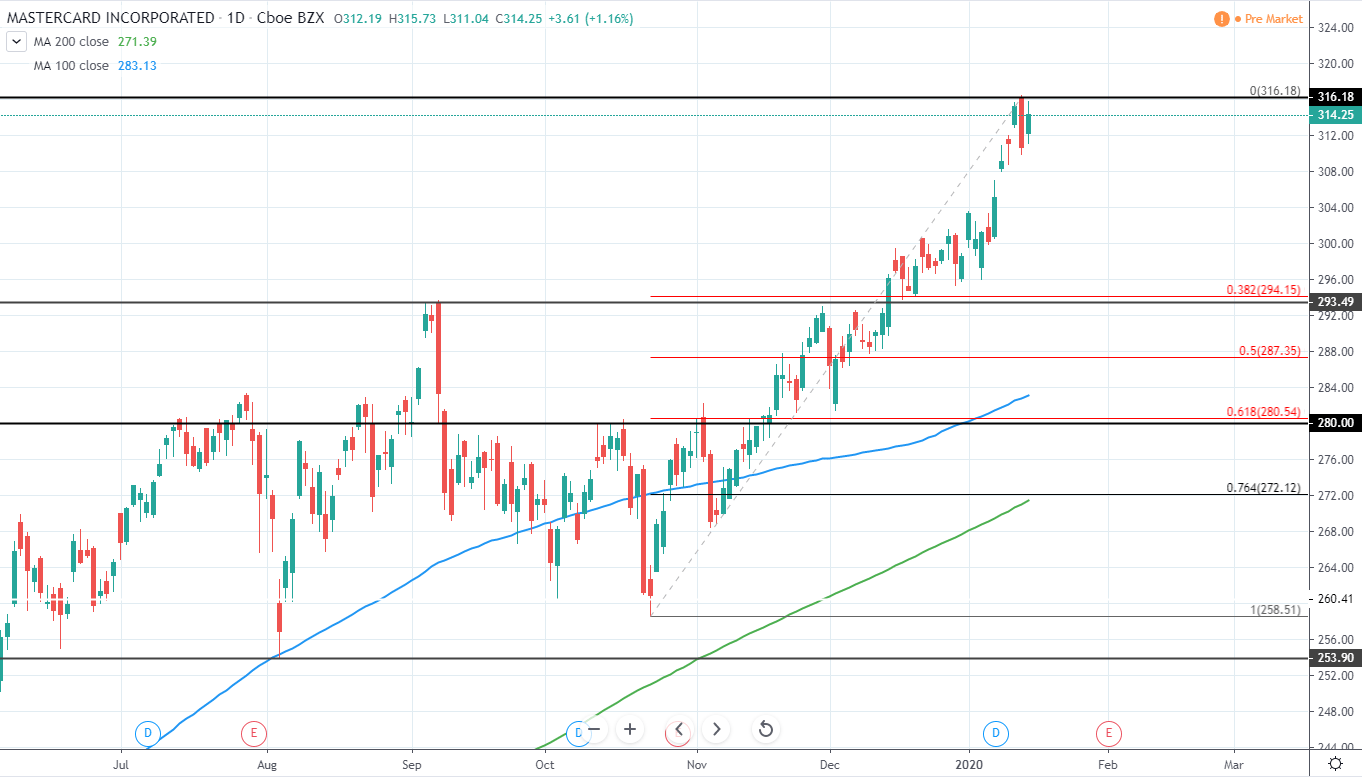
Mastercard, Inc. (MA) currently has a Market Cap 317B USD and trades around 314.25 USD as it continued to set new all-time highs for the past weeks and reached a new high of 316 USD, however, a strong rejection was seen on Tuesday, potentially indicating first signs of upcoming retracement that could be used in order to enter the market once again after such a strong upswing.
The target for the retracement can be seen around the area between 280 and 293 USD previous resistances with additional support offered by 100 day moving average blue line as well as potentially by the 200 day MA as it will likely reach this area in the upcoming weeks. 50-61.8% Fib retracement from the current upswing can be seen around 280-287 USD and adds an additional confluence for the reversal area.
For now, we recommend keeping any existing position as further upside could be seen in the upcoming days, however, in order to enter the market with a good risk/reward setup, a considerable retracement is needed and it is best to stay neutral.
MA Daily:
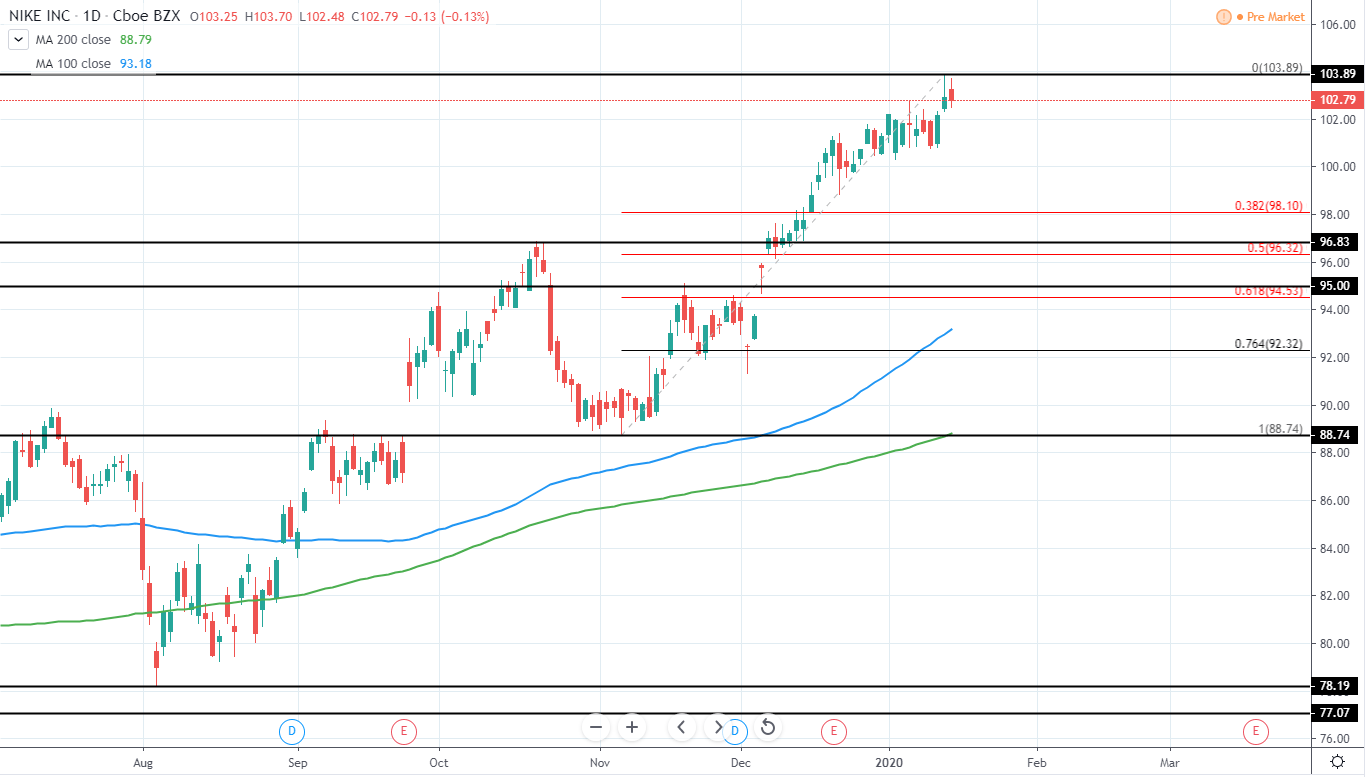
NIKE, Inc. (NKE) currently has a Market Cap 160B USD and trades around 102.79 USD as it has set further higher high around 103.89 USD after several weeks of consolidation was seen around 101-102 USD that indicated a potential reversal.
Since a slight rejection was seen after the new high was reached we could expect the price to finally retrace towards previous high around 96.85 USD with additional support around 95 USD with 50-61.8% Fib retracement from the current upswing also located close by around 84.53-96.32 USD, further strengthening this as a good area where to look for entry. 100 day moving average blue line is also set to reach this area in the upcoming weeks and adds further confluence.
Therefore, for now, we advise staying neutral wait for a strong retracement towards the previously mentioned support area.
NKE Daily: