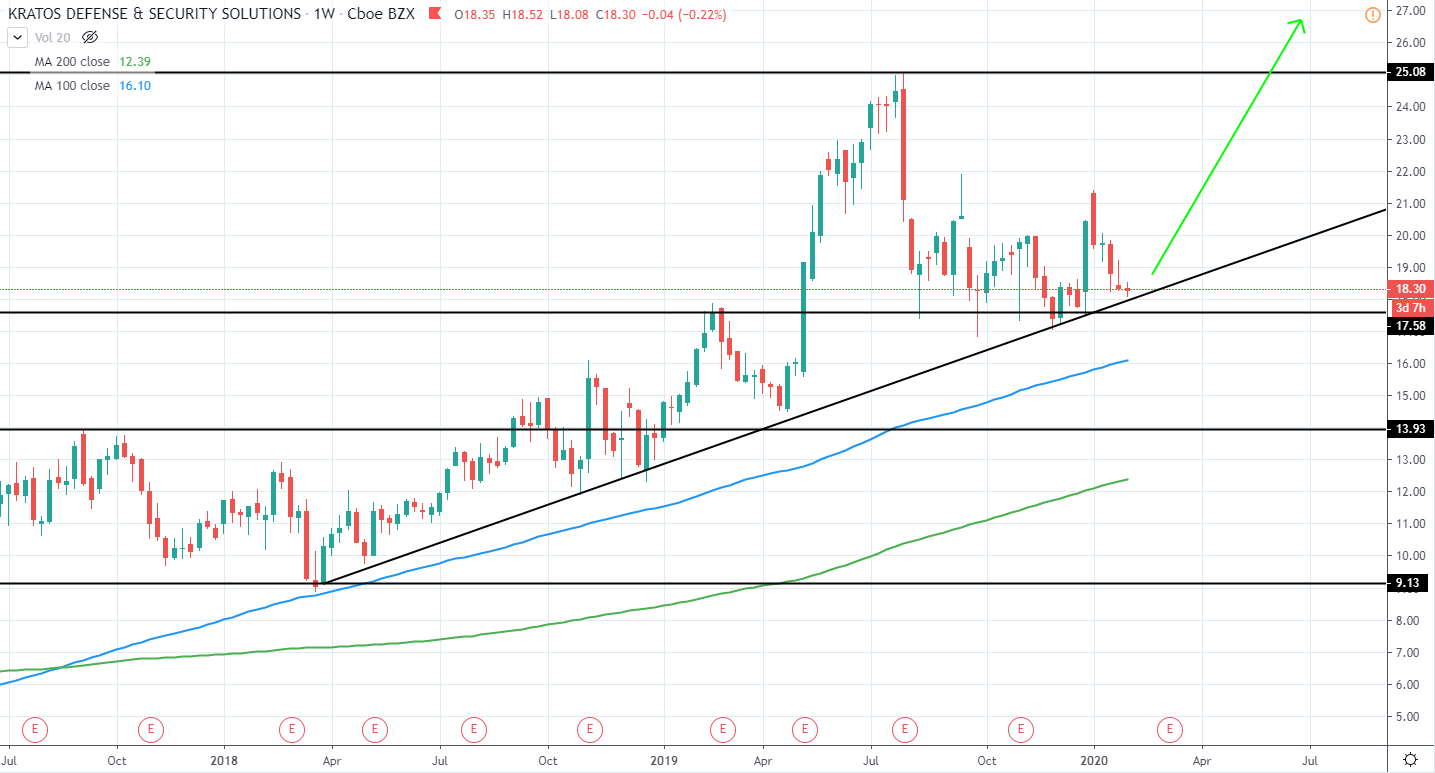
Kratos Defense & Security Solutions Inc. (KTOS) currently has a market cap of 1.959B USD and trades around 18.44 USD as it retests the several year ascending support trendline as well as resistance turned support around 17.6 USD.
The overall trend continues being very bullish and we can expect further all-time high to be set in the upcoming weeks. Therefore, a long position can be taken either right now or once the price shows further sings of rejection for further downside. The next target can be seen as the previous all-time high of 25.08 USD, however, we will likely see the price go much further above, meaning a great potential trade opportunity in terms of risk-reward.
KTOS Weekly:
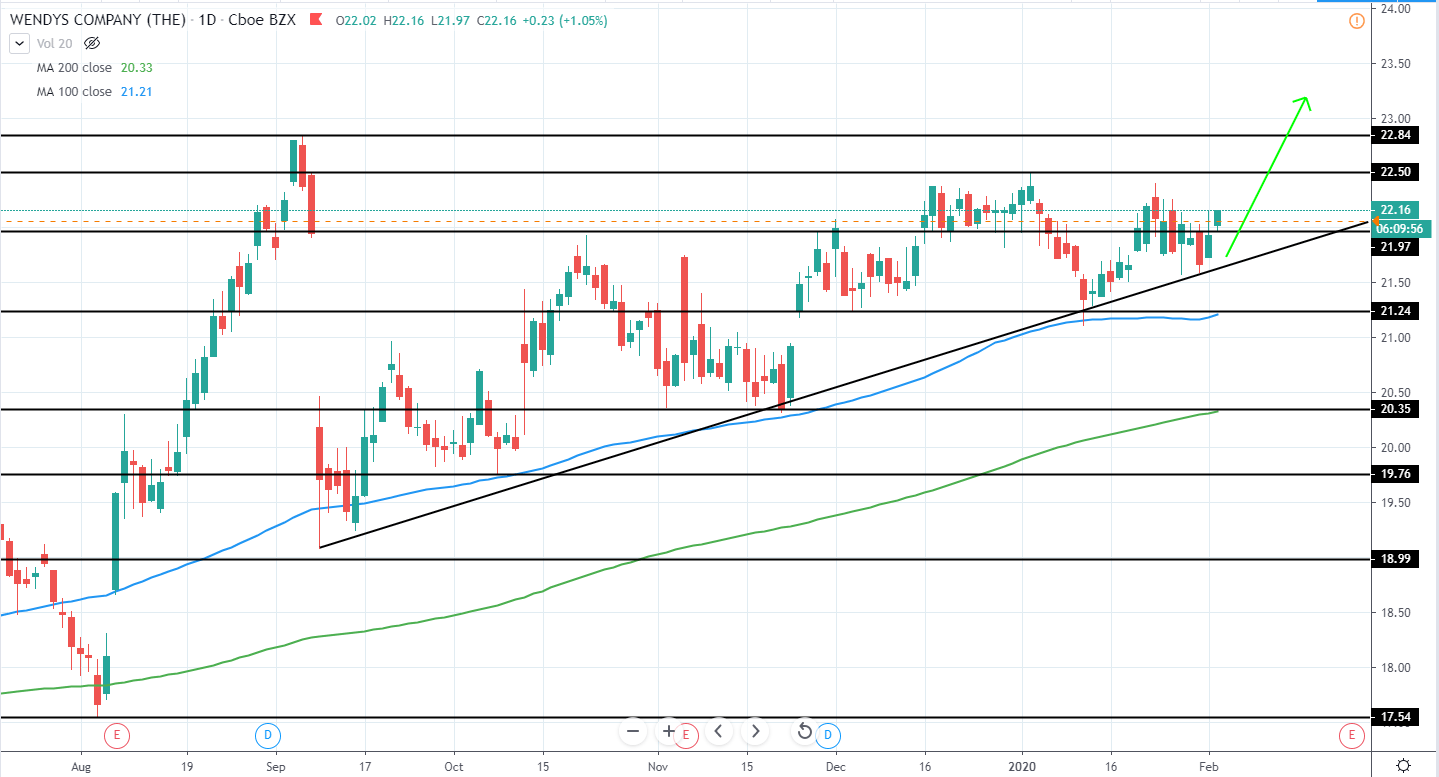
The Wendy's Company (WEN) currently trades around 22.16 USD with a market cap of 5B USD as it found support around the several month ascending trendline once again and set a higher low.
The overall several-year trend continues being very bullish and we will likely see a new all-time high set above 22.84 USD in the upcoming weeks. Therefore, a long position can be made from the current price levels with the first target being the previous all-time high of 22.84 USD, which would only mean a gain of 3.1% from the current price, however, we will likely see the price break above this level and go much further.
Alternatively, move below the support trend line and previous swing low of 21.2 USD would be a very bearish indication for the mid-term trend and will likely lead to a large retracement.
WEN Daily:
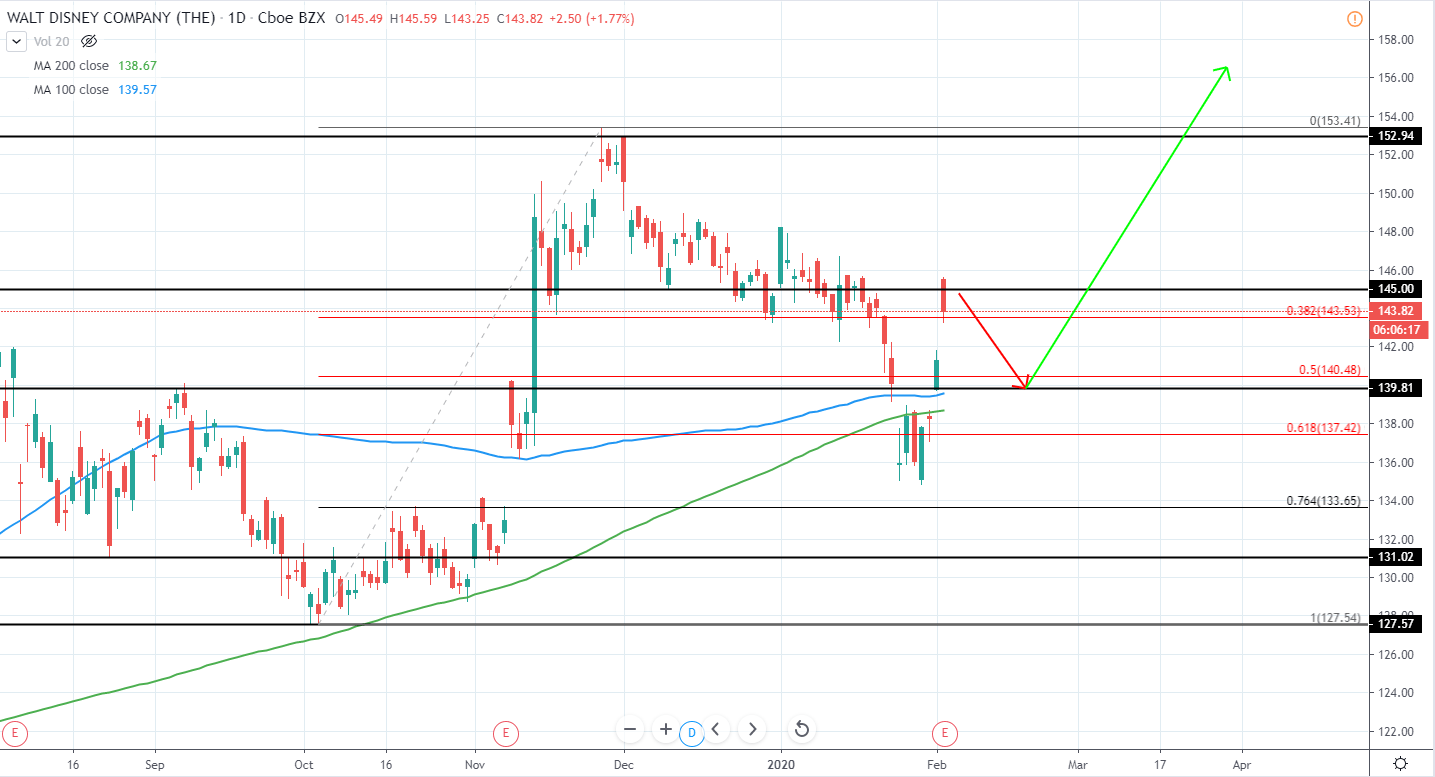
The Walt Disney Company (DIS) currently has a market cap of 259.6B USD and trades around 143.82 USD as it bounced from 135-136 USD area last week and has moved much higher since.
The overall several-year trend continues being bullish and we can expect further all-time high to be set above 153 USD in the upcoming weeks. Therefore, once the price retraces slightly and sets a higher local low, a long position can be taken with the expectation that price will move above 153 USD all-time high in the upcoming weeks.
For now, however, the price has moved too high to enter a long position without a short-term retracement and would not provide a good risk/reward entry.
DIS Daily:
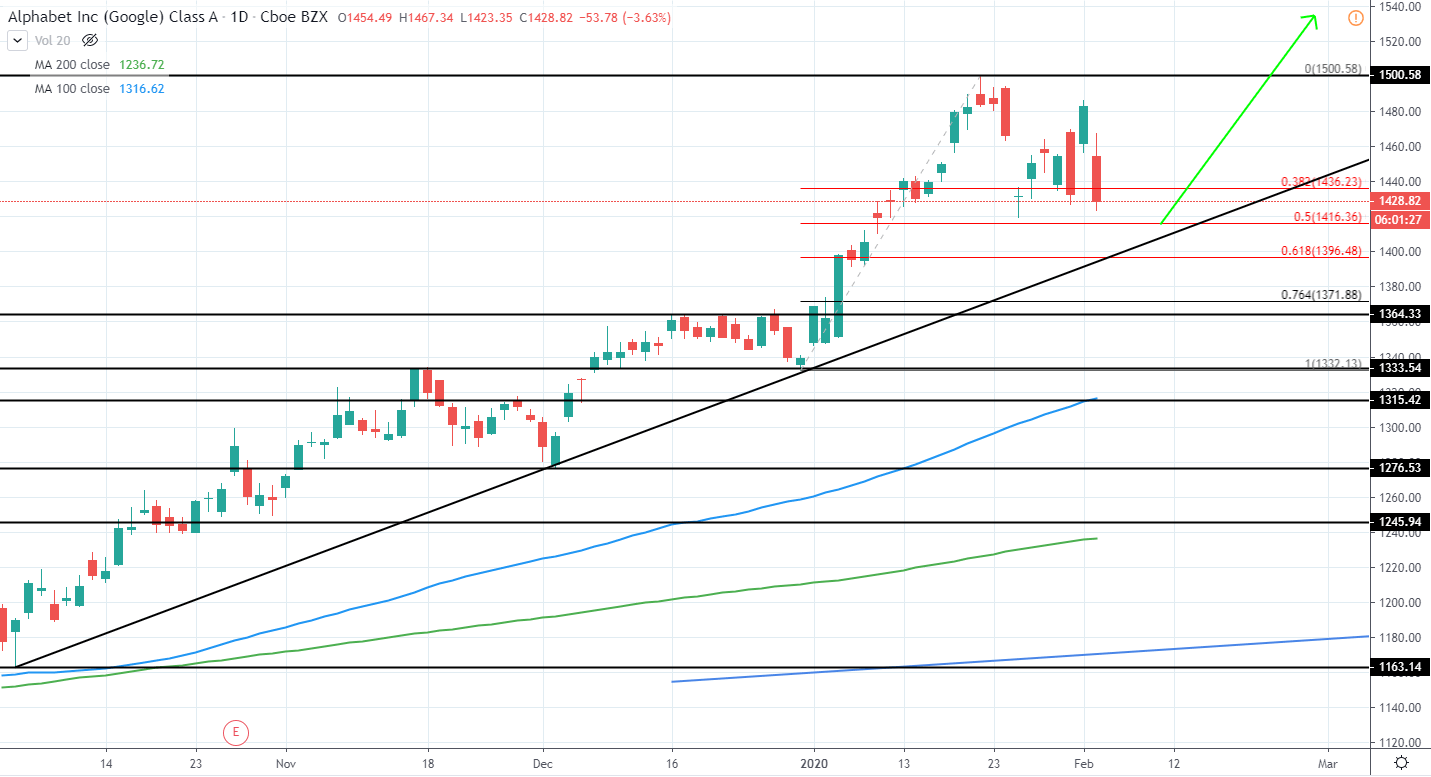
Alphabet Inc. (GOOGL) currently has a market cap of 986.7B USD and trades around 1,429 USD as it continues moving lower after a slight upside was seen last week.
The overall trend continues being very bullish and we can expect further higher high to be made in the upcoming weeks once the current retracement is complete. A potential area where support could be found can be seen around 50% Fib retracement from the previous upswing around 1416 USD as well as at the several month ascending support trend line.
For now, however, best is to stay neutral and wait for further price action development in the form of rejection of further downside.
GOOGL Daily: