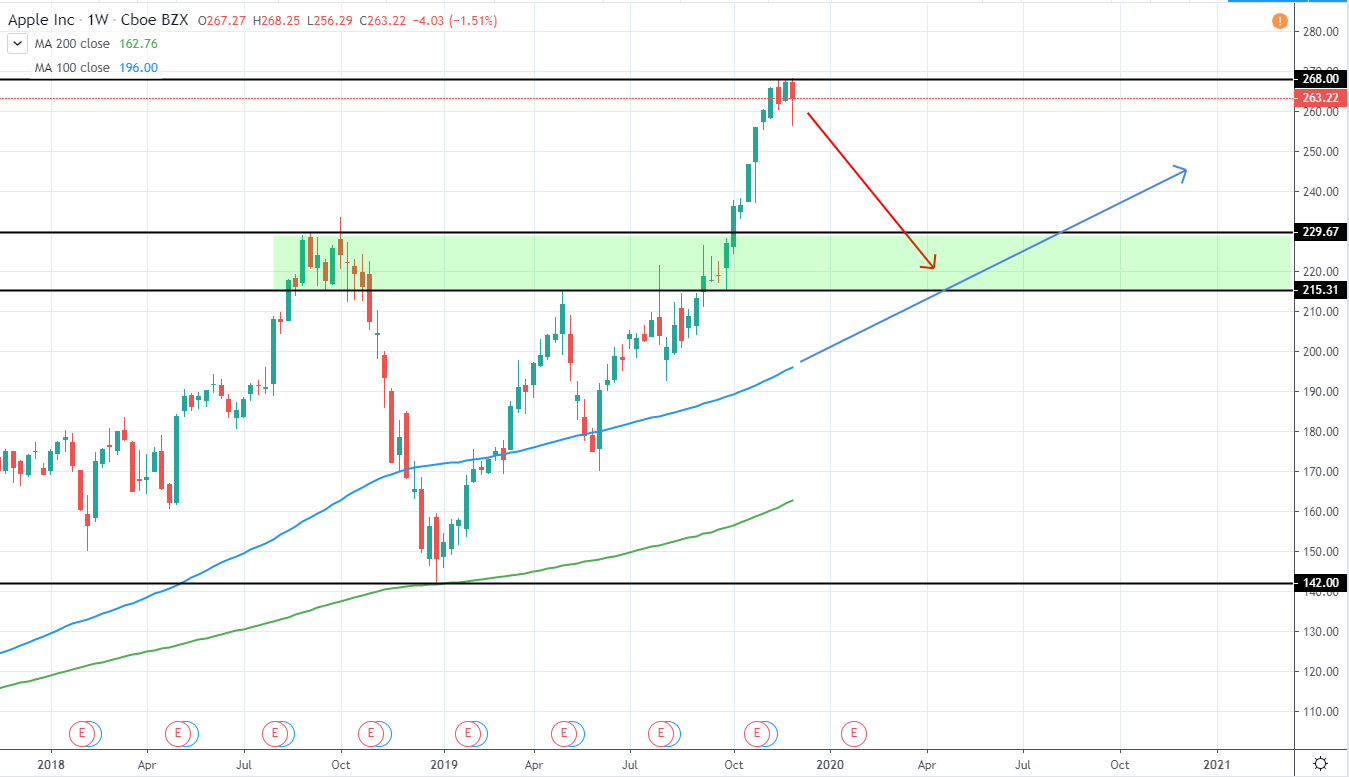
Apple, Inc. (AAPL) currently has a Market Cap 1.19T USD and trades around 263.27USD – near to the all-time high set last week as it continues to trade in a very strong uptrend since a retracement of around 39% was seen in the second half of 2018.
Currently, however, the price has extended significantly without a retracement and therefore we would not recommend buying the stock now. Alternatively, the price seems to be bullish enough not to enter a short position right now, hence the best option would be to wait for a significant retracement once again.
A potential entry zone can be seen around 215-230 USD and would provide a retracement of around 13-18% from the current price. Additionally, when extending the current trend for 100 week moving average blue line we can see that a potential entry could be made around Q2 of 2020 if it serves as a support and reverses the price action again.
AAPL Weekly:
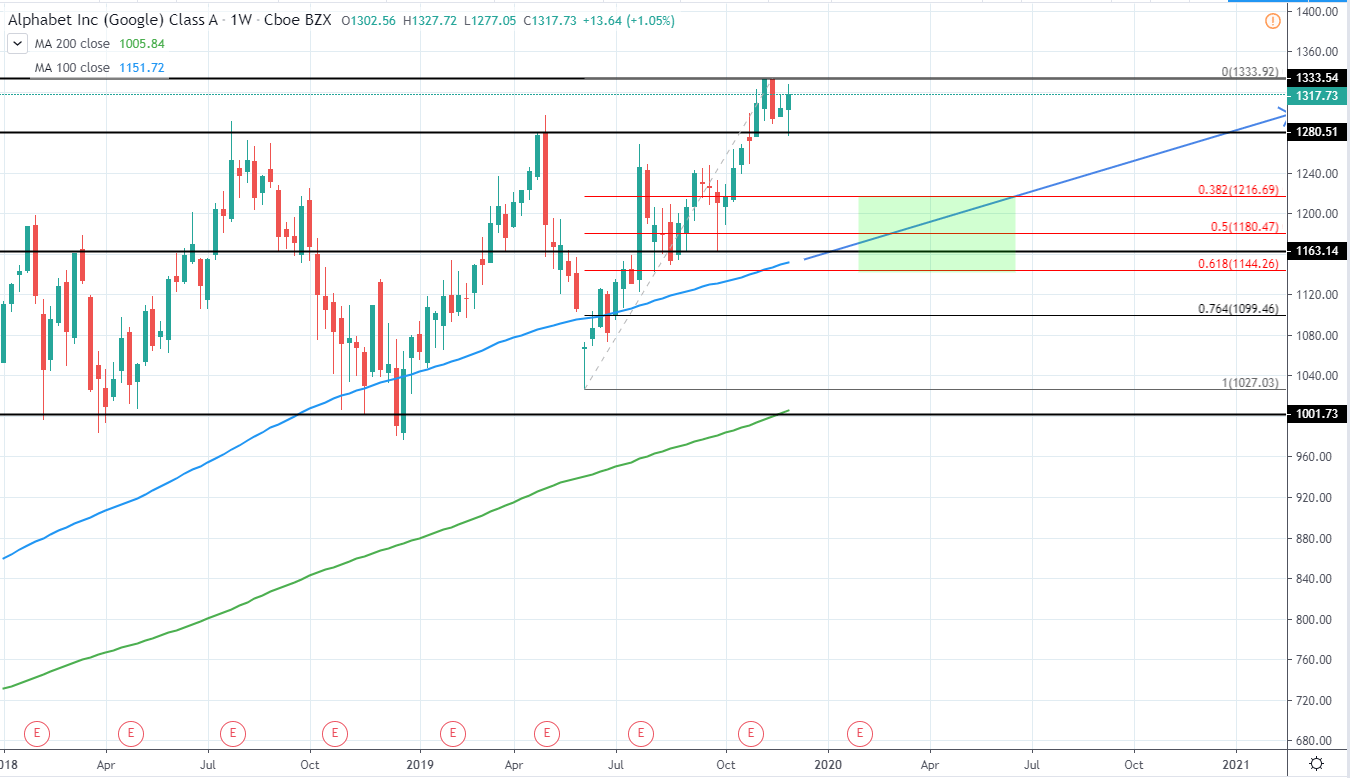
Alphabet, Inc. (GOOGL) currently trades around 1.317 USD with a market cap of 909.26B USD as it continues to trade in a very strong uptrend for more than a decade and currently is close to the all-time high that was set around 1333 USD last month.
Entry right now, however, would not provide a good risk/reward opportunity and therefore, the best option is to wait for a retracement towards previous support. One such is seen around 1160-1165 USD and is also located between 50 and 61.8% Fib retracement from the previous upswing. Additionally, when extending 100 week moving average we can see that the entry could be possible around March/April if the price does indeed reverse.
Alternatively, it is possible that the current bullish momentum continues, however, as mentioned before, it would be highly risky to enter a trade right now as the price has moved higher for most of the year without a significant retracement.
GOOGL Weekly:
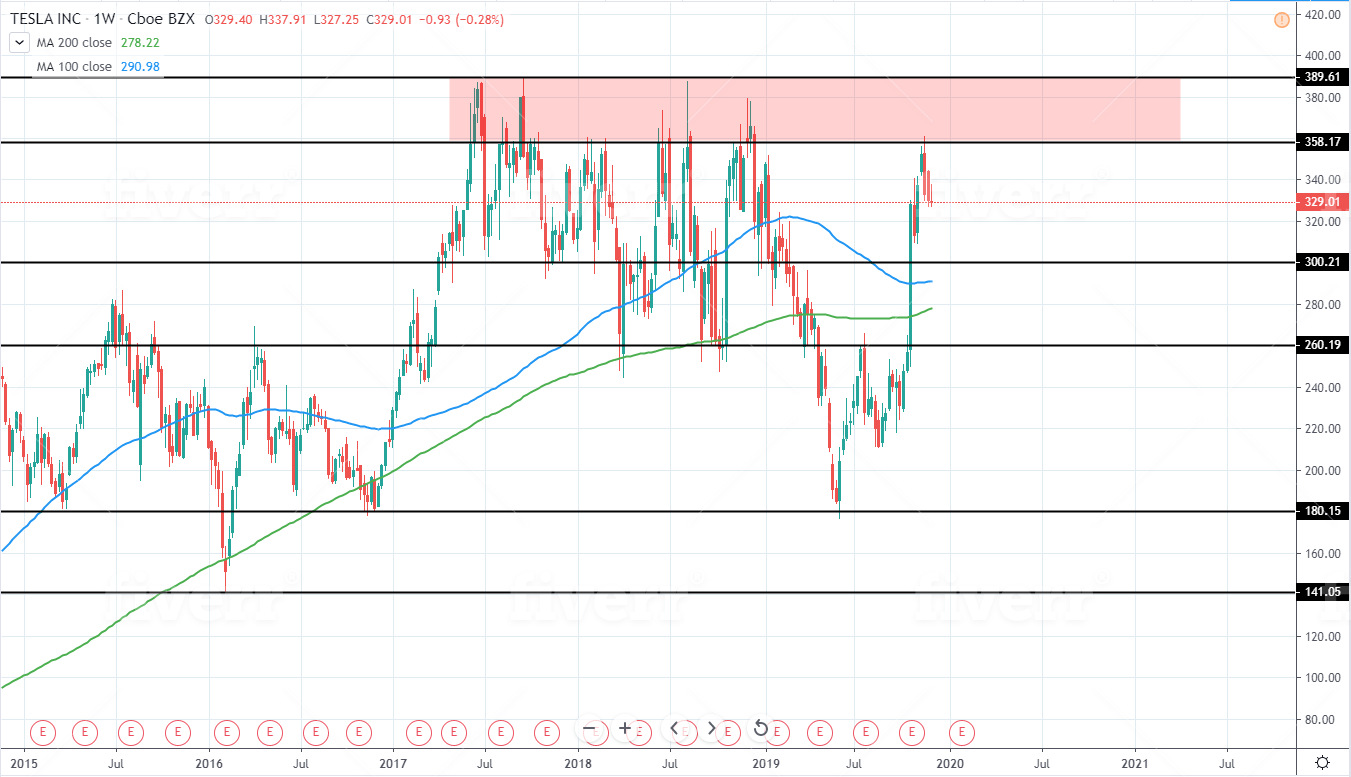
Tesla, Inc. (TSLA) currently has a market cap of 59.35B USD and trades around 329.28 USD as it looks to retest previous highs around 360-390 USD, which is a very strong resistance level as it has rejected further bullish move several times in the past 3 years.
Right now, a rejection for further upside can be seen in the past weeks and therefore, a short position could be made in the expectation that the price will look to retest previous low of 180 USD that was made in the middle of 2019. This would mean a potential downside of around 45% in the upcoming months, however additional major support can be seen around 250-260 USD, which if reached, would still offer a decent 21-24% of downside.
Therefore, we are very bearish for TSLA in the upcoming months and expect a significant downside to be seen in the upcoming months.
TSLA Weekly:
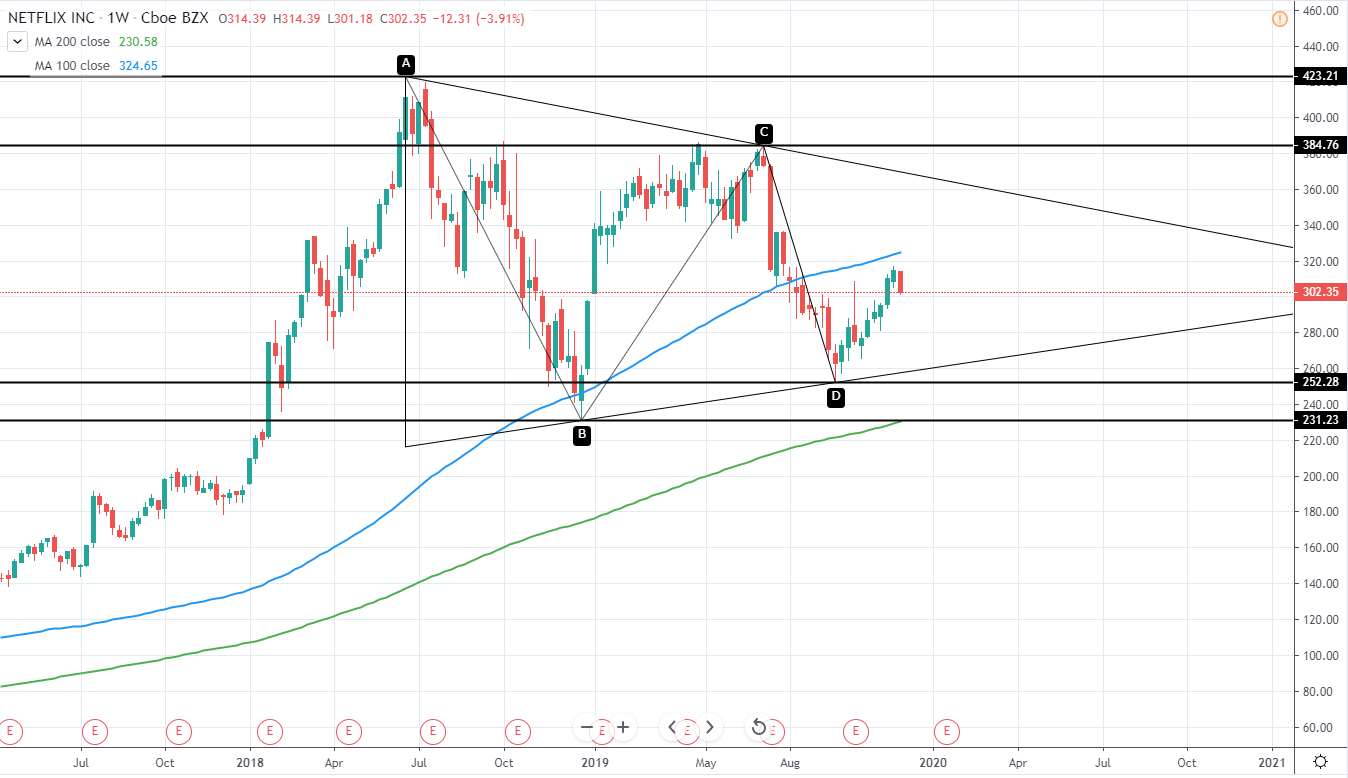
Netflix, Inc. (NFLX) currently has a market cap of 131.84B USD and trades around 301 USD as it continues to trade with a significantly lower high and higher low, indicating a triangle consolidation is in place and likely will continue until the middle of 2021 unless a breakout to either side happens.
Currently, the price is right in the middle of this range and therefore, no position could be made right now that would offer a good risk/reward potential. Therefore, the best option, for now, is to wait for either further upside towards the descending trend line resistance as long as the price does not move above 384.76 USD current high, which would mean a continuation to the upside for the major trend if broken. Alternatively, a retracement towards the ascending support trend line can be used in order to buy the stock as long as the price does not retrace below 252.3 USD current swing low as, if broken, it would indicate a further bearishness to be seen in the following months and potentially years.
NFLX Weekly: