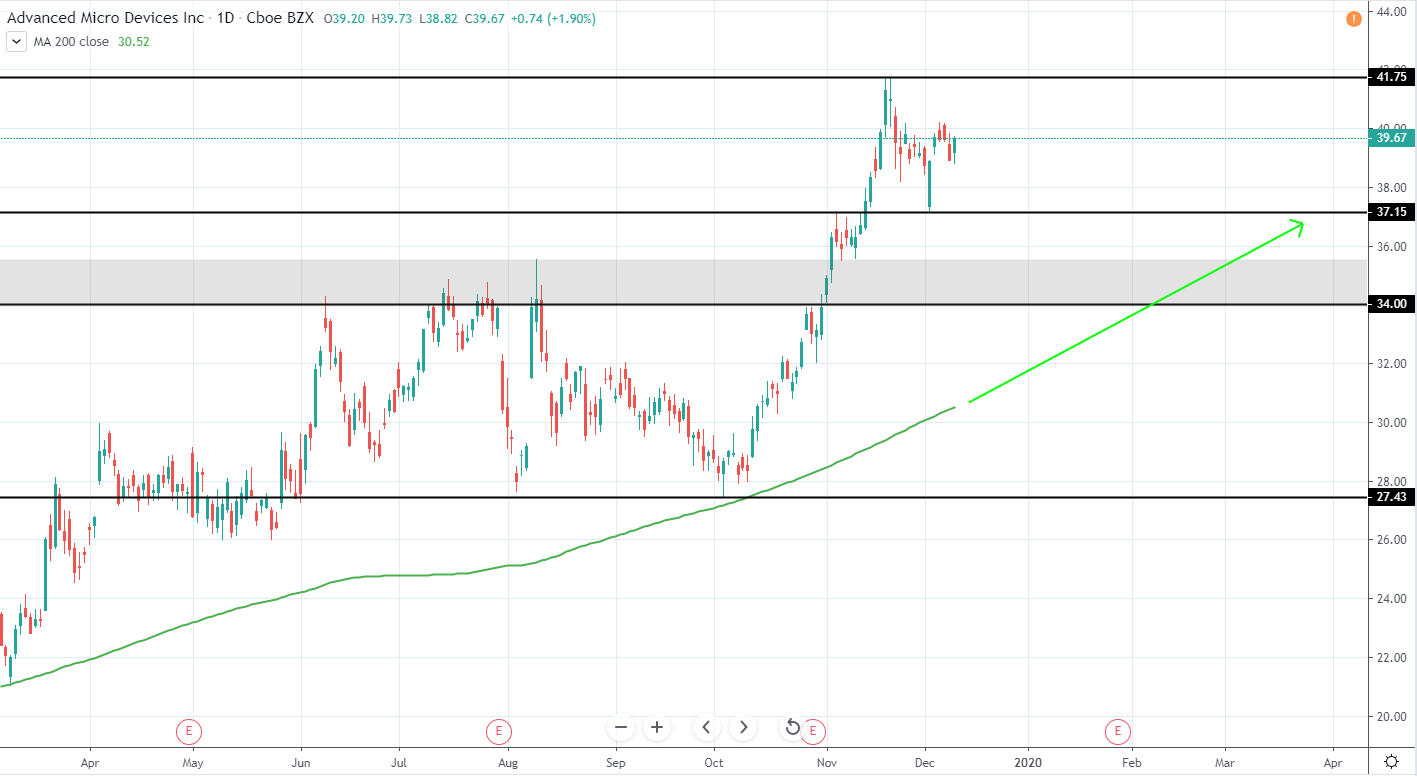
Advanced Micro Devices (AMD) currently has a market Cap 46.245B USD and trades around 39.63 USD as it peaked around 41.75 USD last month and set a new all-time high. The overall trend has been very bullish since the end of 2018 when a significant retracement was seen and we should definitely look for further entry opportunities.
For the past weeks, signs of retracement can be seen as the price dipped to 37.15 minor support that previously acted as a resistance. The price is still too extended in order to consider a long position as the previous upswing from 27.43 to 41.75 USD resulted in a gain of 52.35% in less than 2 months and, therefore, further retracement is needed.
An area, where an entry could be made with good risk/reward, can be seen around 34-35.5 USD, which previously acted as a very strong resistance. Additionally, when extending 200 day moving average green line we can see that it will intersect this area in February of 2020, meaning that we will likely see a slow retracement until then, however, if the price does reach 34-35.5 USD support area and shows signs of bullishness an entry can be made sooner.
Until then, we remain neutral as a short position in such a strong uptrend is not advisable.
AMD Daily:
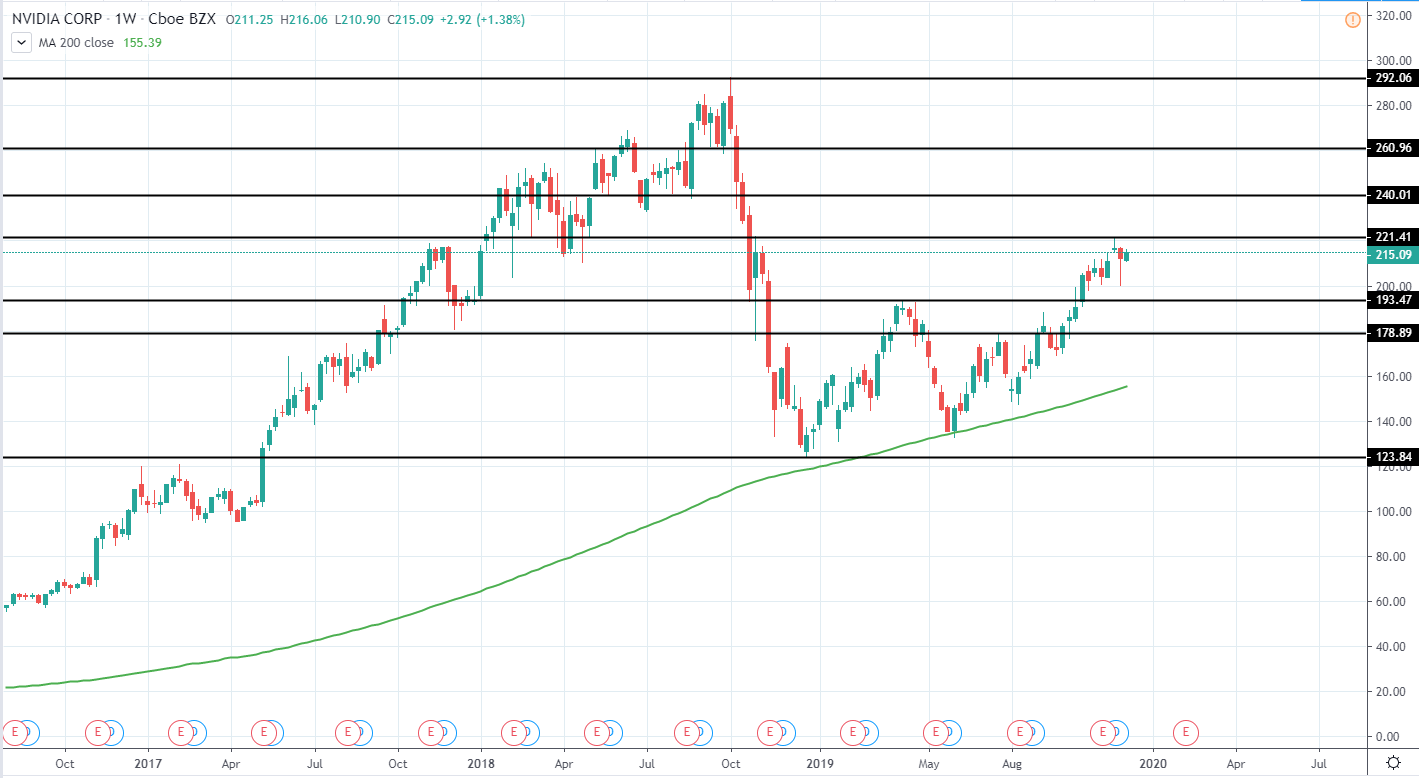
NVIDIA Corporation (NVDA) currently trades around 215.07 USD with a market cap of 132.631B USD as it continues trading higher in a steady uptrend for the past months.
The overall trend is quite bullish since 2015 when a very strong uptrend was seen until the price peaked around 292 USD and retraced 57.5% to the low of 123.84 USD as it found support above 200 week moving average green line. Since then, it was retested once again at the end of May and provided strong support once again that could have been used as a very good entry opportunity.
Currently, however, the price has extended to the upside with only a very minor retracement seen last week. Bullish entry could be made if a further retracement around 179-193.5 USD previous resistance area with relatively good risk/reward potential.
For now, however, it would be best to stay neutral and wait for a retracement.
NVDA Weekly:
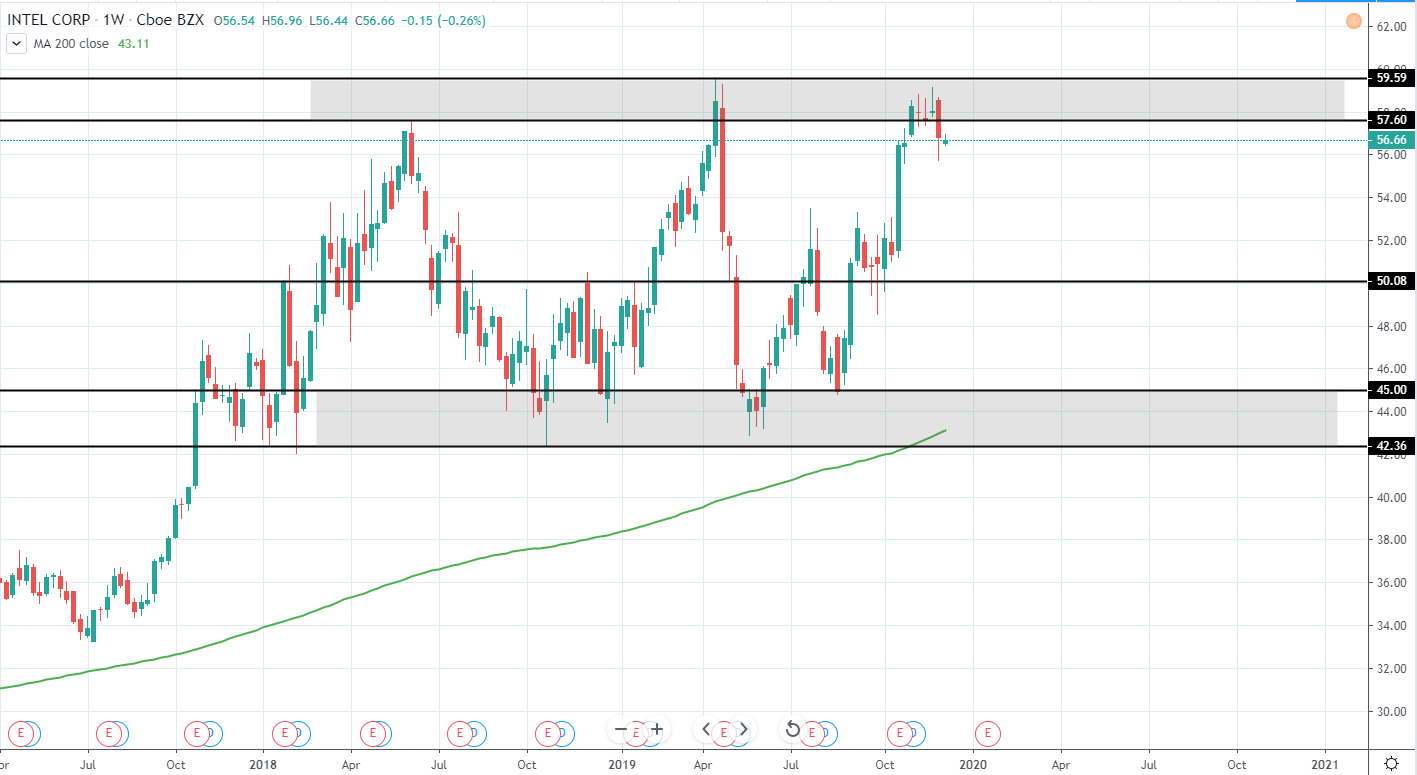
Intel Corporation (INTC) currently has a market cap of 246.524B USD and trades around 56.67 USD as it continues to trade in a range of 42-60 USD for the past years and currently testing 57-60 USD major resistance area.
Last week, a decent rejection was seen as the week closed very bearish and indicates a further downside to be seen in the upcoming months. Therefore, a short position can be made from the current price with a good risk/reward potential.
Target to the downside can be seen as the range bottom around 42.5-45 USD and if reached from the current price would mean a potential downside of around 20-25%. Additional middle of the range support/resistance level can be seen around 50 USD, however, it would still offer a decent 11.6% of downside.
Therefore, we are very bearish for the price of INTC and a short position can definitely be made from the current price levels as we will likely see further downside in the upcoming months.
INTC Weekly: