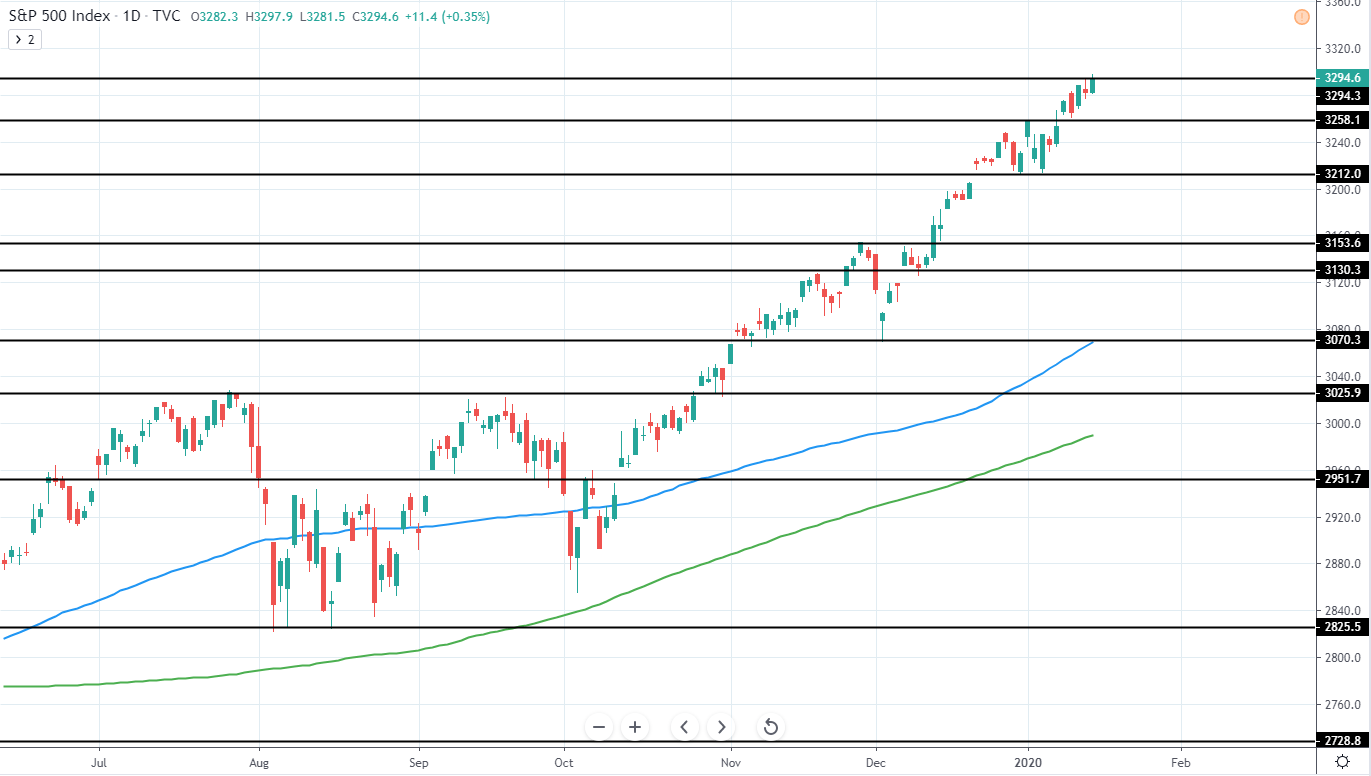
S&P 500 (^GSPC) currently trades around 3,294 USD as it has set another all-time high earlier today, peaking around 3297.9 USD after a support was found earlier in January around 3212 USD.
The overall several month trend still continues being very bullish and shows no signs of slowing down. From the previous major retracement in October, when the price tested 2855 USD support, a gain of around 15.5% has been made and indicate that the current bullish momentum has possibly exhausted itself and a strong retracement could be expected in the upcoming weeks which would allow for another entry in to the market.
The potential target of support for the retracement can be currently seen around 3025-3070 USD, where 100 day moving average blue line is currently located and 200 day MA green line is closing in as well as previous major support/resistance levels are seen.
Until this retracement is seen, a short term long position could be taken once an intra-day retracement is seen, however, best would be to stay neutral and wait for further price action development.
S&P 500 (^GSPC) Daily:
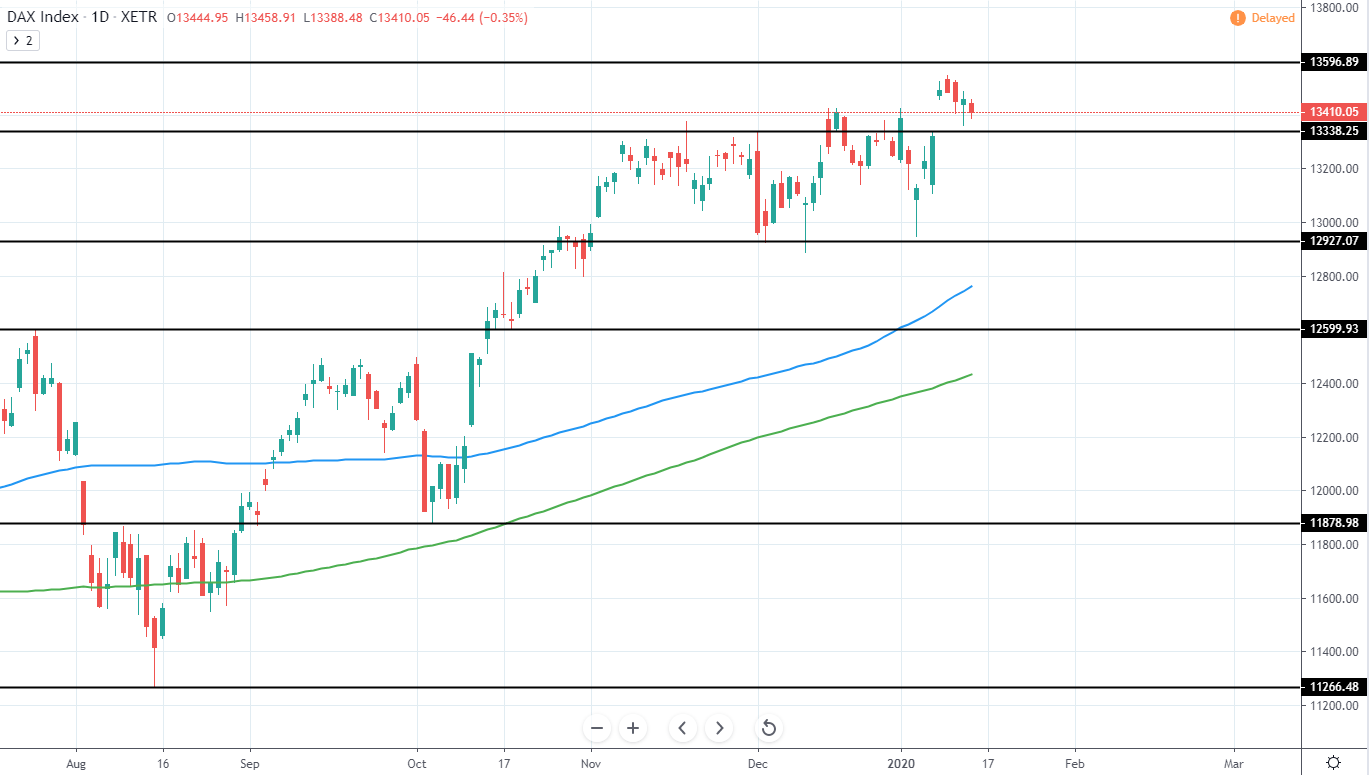
DAX (^GDAXI) trades around 13,410 EUR as it tried to reach the previous all-time high of 13,596.7 EUR, however, reversed just under it last week with further downside seen earlier this week.
The overall trend is still very bullish and we can expect the all-time high to be broken in the upcoming weeks, once another retracement and a higher low above 12,927 EUR is made, after which, a long position can be entered once again.
Additional support will likely be offered by the 100 day moving average blue line that currently is trading around 12,761 EUR and rapidly moves higher, therefore, likely reaching around 13k EUR area in the upcoming weeks.
Alternatively, break below 12,927 EUR support would be a very bearish sign for the upcoming months as it would lead towards a major retracement as seen previously during the middle of 2019.
For now, it is best to stay neutral and wait for further price action development.
DAX (^GDAXI) Daily:
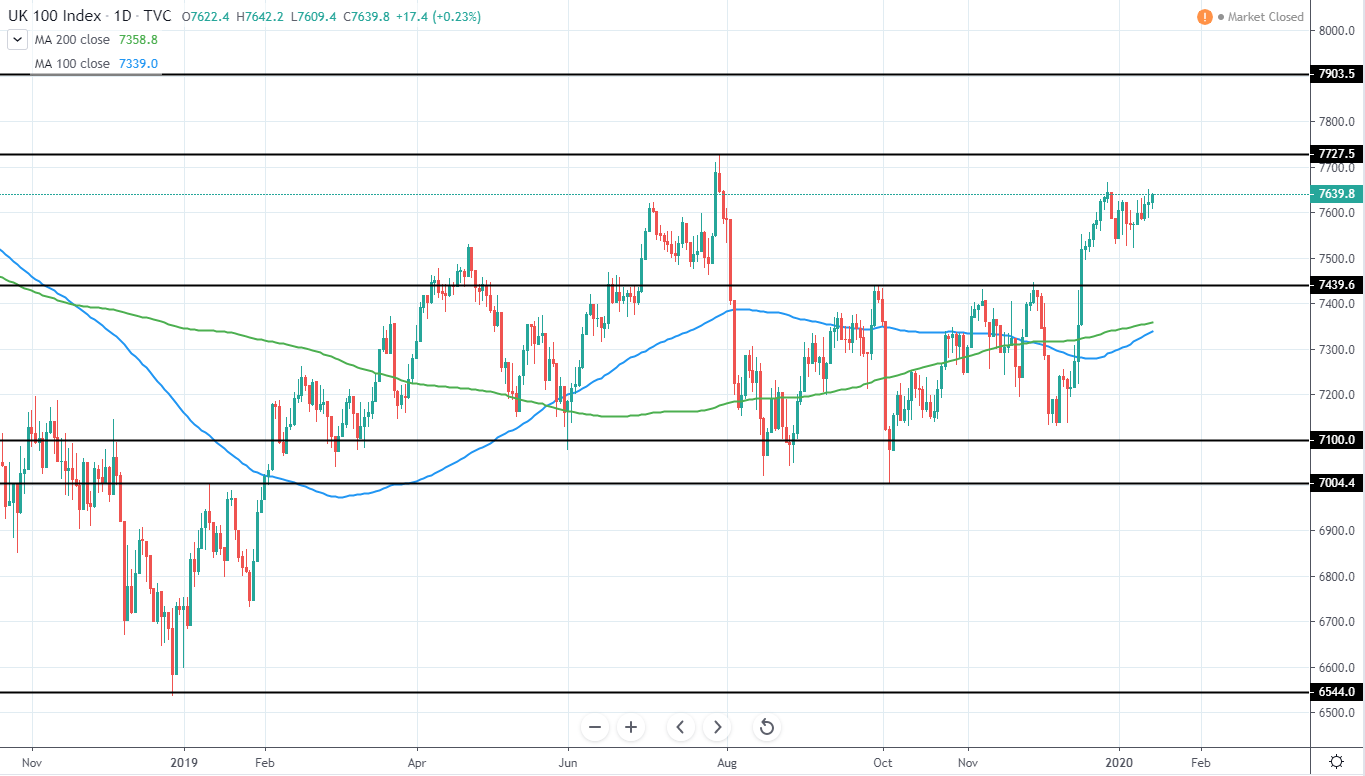
FTSE 100 (^FTSE) currently trades around 7,642 GBP as it still looks to move above 2019 high of 7727 GBP and the all-time high of 7903 GBP, however, has shown signs of exhaustion for the bullish momentum during the past weeks.
The overall trend has been neutral as both lower highs and higher lows have been made during the past year, however, the previous upswing, that broke above 7439 GBP previous resistance that reversed the price several times indicates a very strong bullish momentum forming after another higher low was made.
Therefore, once a retracement that sets another higher low is made, an entry can be made in the expectation that the price will look to test the all-time high around 7903 GBP in the upcoming months. Potential support area where the price could set another higher low and reverse back to the upside can be seen around 7440 GBP previous major resistance as well as area around both 100 and 200 day moving averages that are seen as a blue and green line on the chart around 7339 and 7258 GBP respectively.
Until this retracement is seen, it is best to stay neutral and wait for further price action development, however, a short-term short position could be made if further rejection for upside is seen around the current levels with the target being the previously mentioned previous resistance around 7440 GBP, which would mean a downside of around 2.7%.
FTSE 100 (^FTSE) Daily: