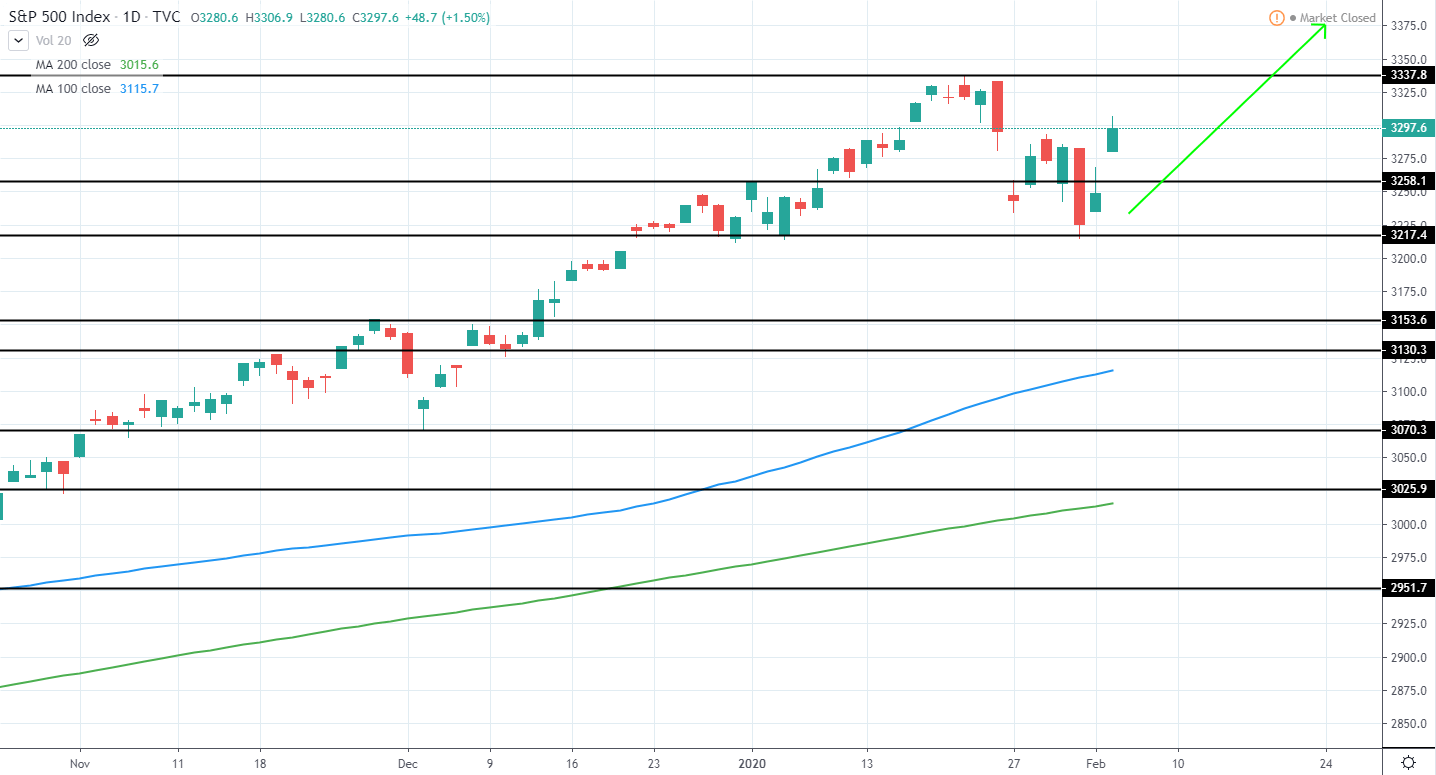
S&P 500 (SPX) currently trades around 3,297 USD as it strongly rejected further downside after reaching previous support around 3220 on 31st Of January and made a bullish gap open during the last trading session.
The overall trend is still bullish as no significant lower low has been set, therefore we can look for a long position entry once again. However, currently, the price has moved too far away from the previous low and entry right now does not offer the best risk/reward potential.
For now, the best option is to stay neutral and wait for a slight retracement back towards the previous low of around 3220 USD that sets a higher low, afterward, a long position can be entered with the expectation that a new all-time high will be made in the following weeks.
SPX Daily:
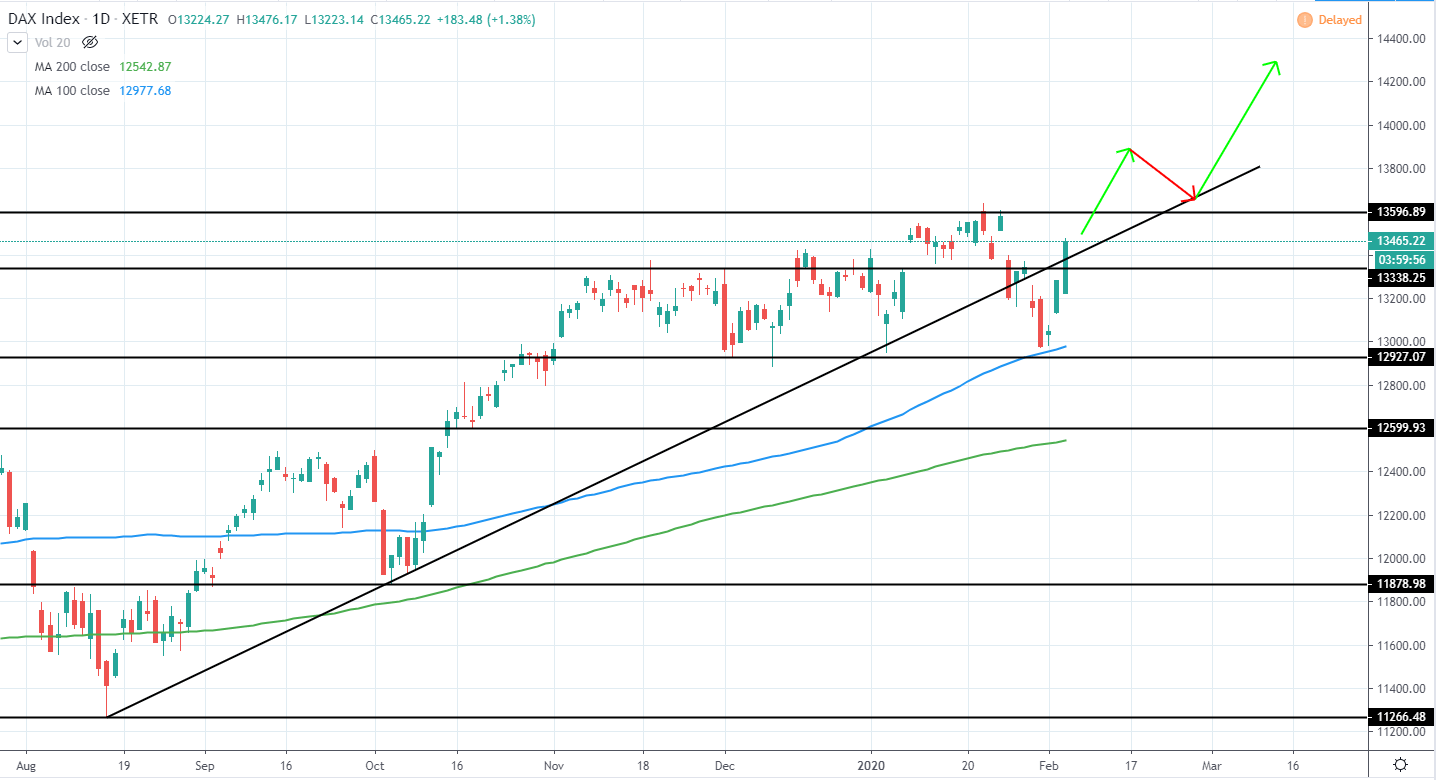
DAX INDEX (DAX) trades around 13,466 EUR after breaking below several month support trendline, which is a potential indication of an upcoming trend reversal, however, since the previous highest low of 12925 EUR was not broken, the trend is still technically bullish.
Additionally, the price did reject further downside after briefly trading close to the previous low and 100 day moving average blue line. This was followed by strong bullish momentum during the past 2 days and has led price back above 13340 EUR resistance as well as the support trendline.
Therefore, we expect another higher high to be made in the upcoming days, however, since the price has moved considerably from the previous low, it does not offer a good risk/reward entry opportunity right now. The best option would be to wait for a higher high to be set above 13597 EUR previous high and enter a long position once a retracement that sets another higher low is made.
DAX Daily:
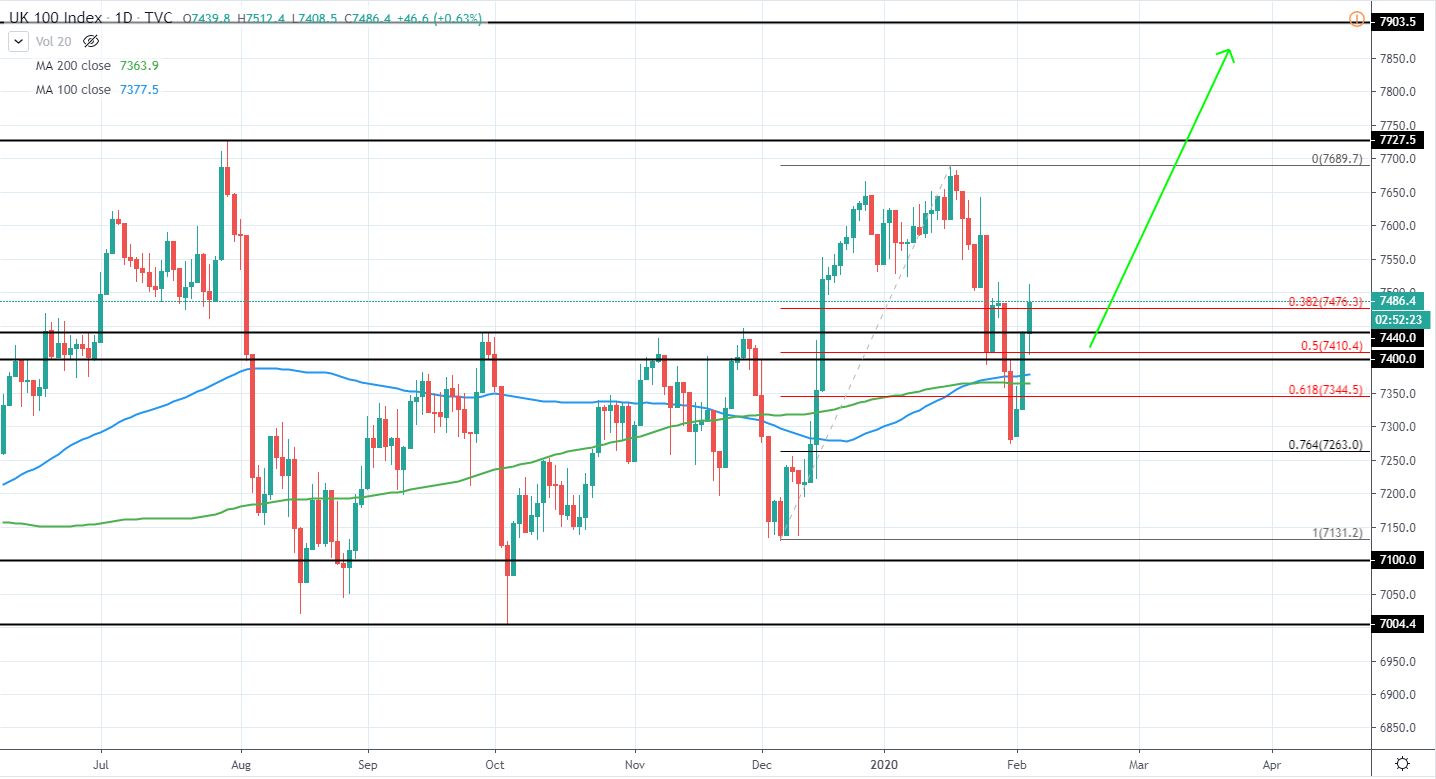
FTSE 100 (UKX) currently trades around 7,486 GBP as it rejected further downside after reaching 7280 GBP last week and moved higher this week.
The overall several-year trend is still unclear as the price action has been setting lower highs and higher lows for the past months. Therefore, a clear higher high above 7689 GBP is needed to confirm bullish momentum taking over and until then the best option would be to stay neutral and wait for further price action development.
A more aggressive approach would be to wait for a slight retracement that sets another higher local low and entering a long position once the price rejects further downside with the expectation that the next resistance of 7.9k GBP will be reached in the upcoming weeks, however, the price could make another lower low below the current high of 7689 GBP and reverse back to the downside as it continues to trade in an increasingly tighter range.
UKX Daily: