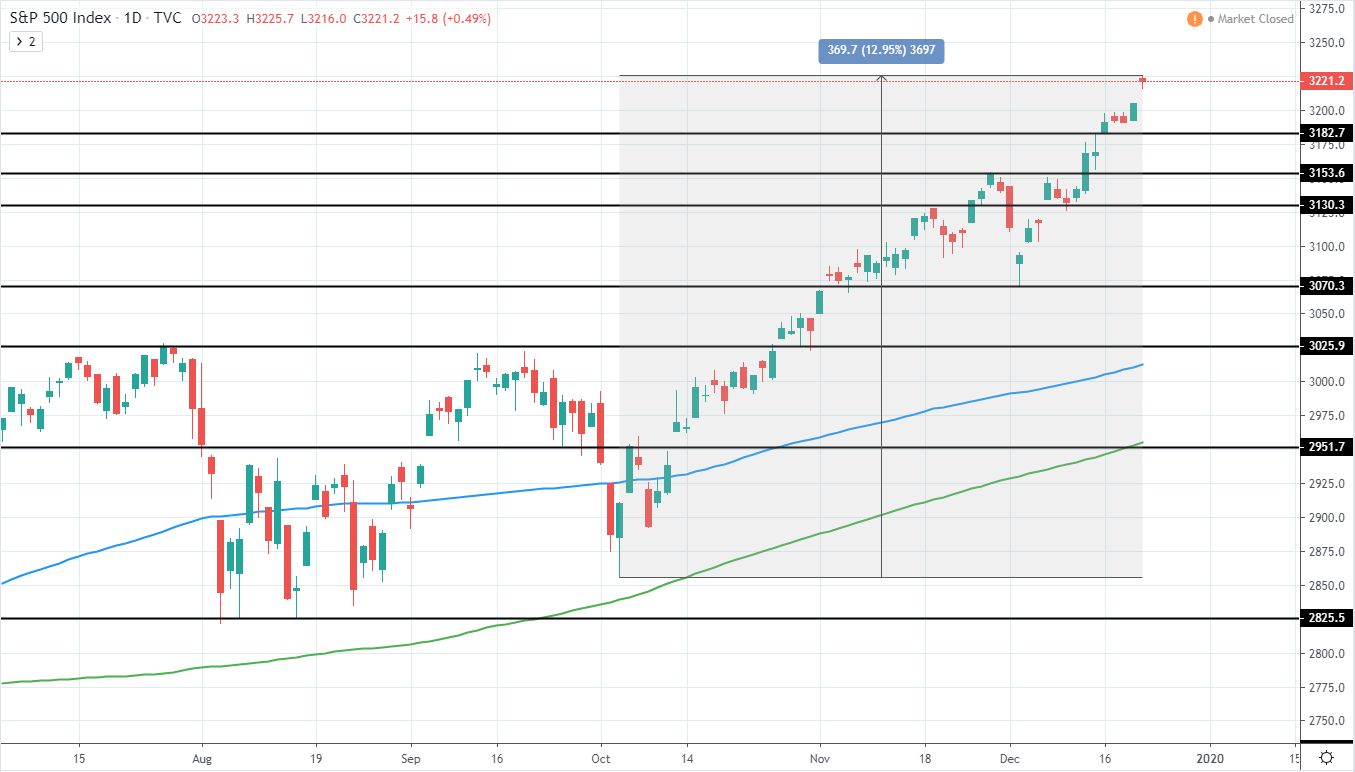
S&P 500 (^GSPC) currently trades around 3,221 USD as it continued to set new all-time highs last week and has gained 12.95% since the last major low of 2855.9 USD, indicating that the current upswing is quite extended overall.
Therefore, a considerable retracement is needed before a good risk/reward potential long entry can be made again. Strong support area can be seen around 3,025 USD previous major resistance as well as 100 day moving average blue line close by around 3013 USD.
Alternatively, a deeper retracement target can be seen around 2,950 USD as well as 200 day MA green line around 2,955 USD and would provide an excellent risk/reward opportunity to enter the next major swing to the upside.
S&P 500 (^GSPC) Daily:
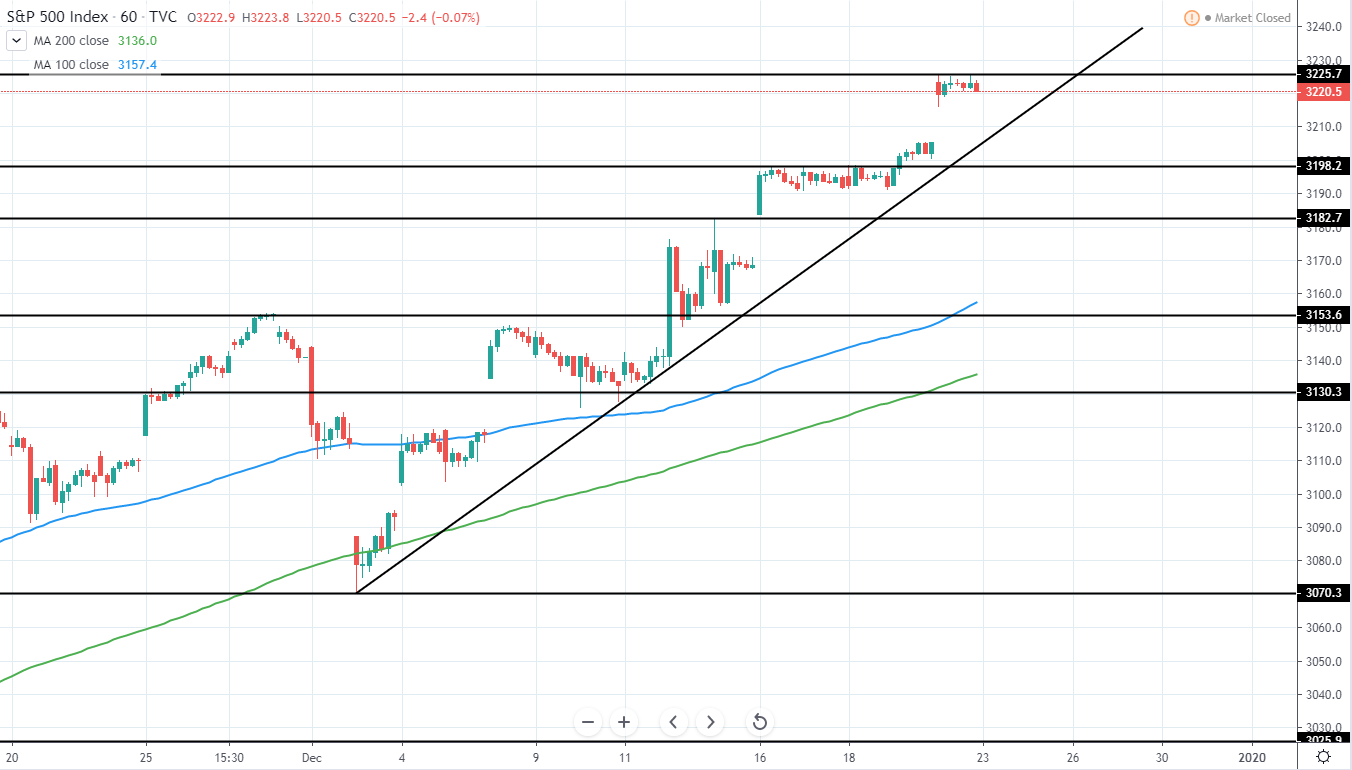
On the hourly chart, we can see the price continuing to trade along several week ascending trend line, which if broken, could potentially be used as an indication for further downside to come in the upcoming days as the price finally makes a medium-term retracement.
Alternatively, if tested as support once again, a long position could be entered if signs of rejection for further downside are seen.
S&P 500 (^GSPC) Hourly:
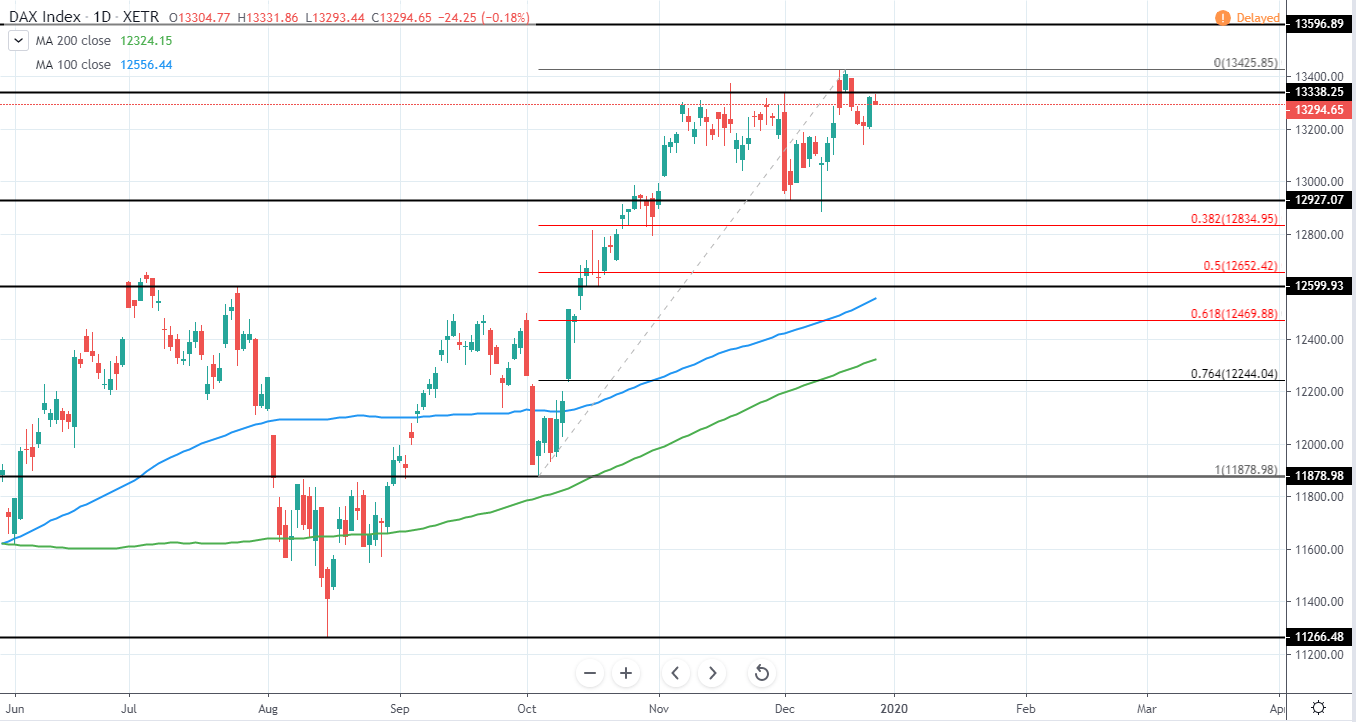
DAX (^GDAXI) trades around 13,296 EUR as it set a new all-time high around 13,425 on the 13th of December and since then has returned below the 13,338 EUR resistance that rejected price several times during November.
Since the trend has extended considerably from the previous low of 11,878 with a gain of more than 13% in the past months, a clear retracement is needed in order for entry to have good risk/reward once again.
Area, where entry could be considered again, can be seen around 100 and 200 day moving averages that are seen as a blue and green line around 12,556 and 12,324 EUR respectively. Additional horizontal support can be seen around 12.5-12.6k EUR previous resistance as well as 50-61.8% Fib retracement around 12,469-12,652 EUR.
Until this area is reached, however, it would be best to stay neutral or possibly look for a short-term short position towards the support targets.
DAX (^GDAXI) Daily:
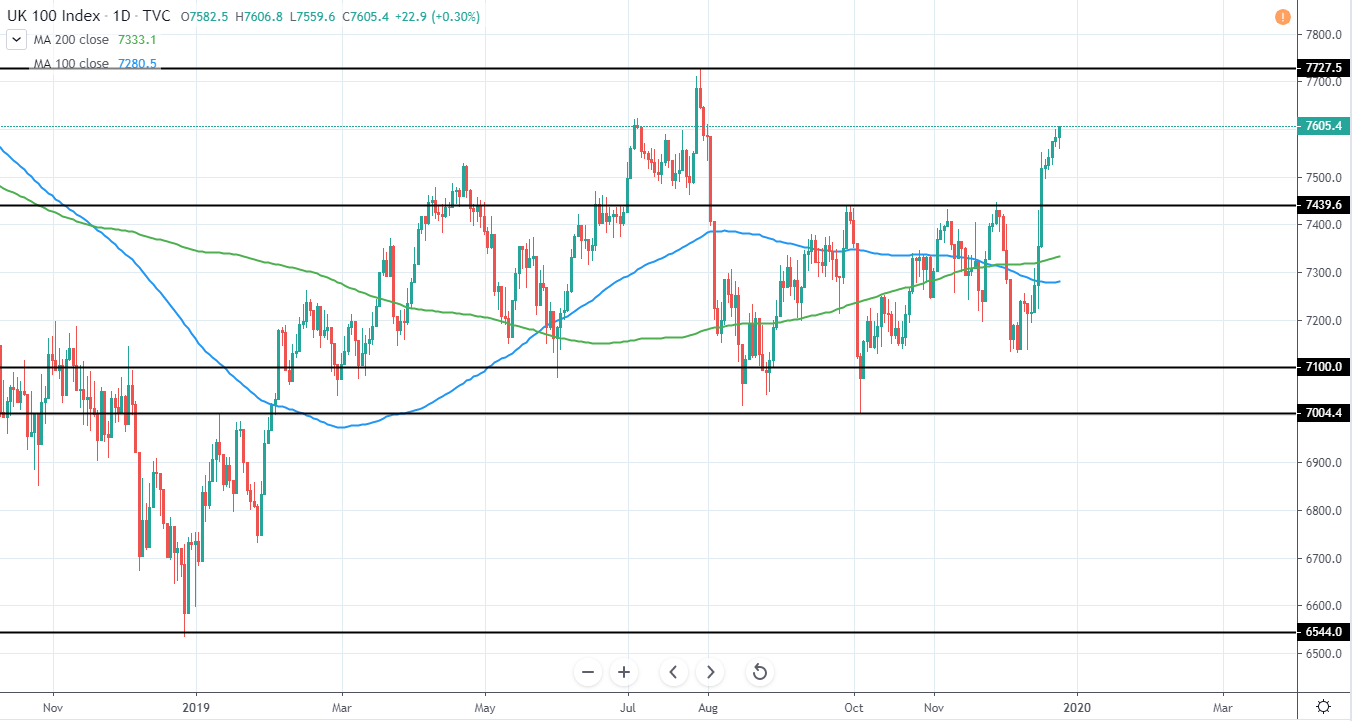
FTSE 100 (^FTSE) currently trades around 7,605 GBP as it has clearly broken above 7,440 GBP resistance that reversed the price action several times in the past months and currently looks to move towards 7727 GBP current yearly high.
Since the trend has extended itself so far, a long position cannot be made right now and a most likely scenario would be to wait for the price to reach the resistance and subsequently retrace towards 7440 GBP previous resistance now turned support.
Additionally, a counter-trend short position could be made if signs of clear rejection are seen around the all-time high resistance of 7,727 GBP with the target being the previously mentioned resistance turned support.
Therefore, for now, it is best to stay neutral and wait for further price development.
FTSE 100 (^FTSE) Daily: