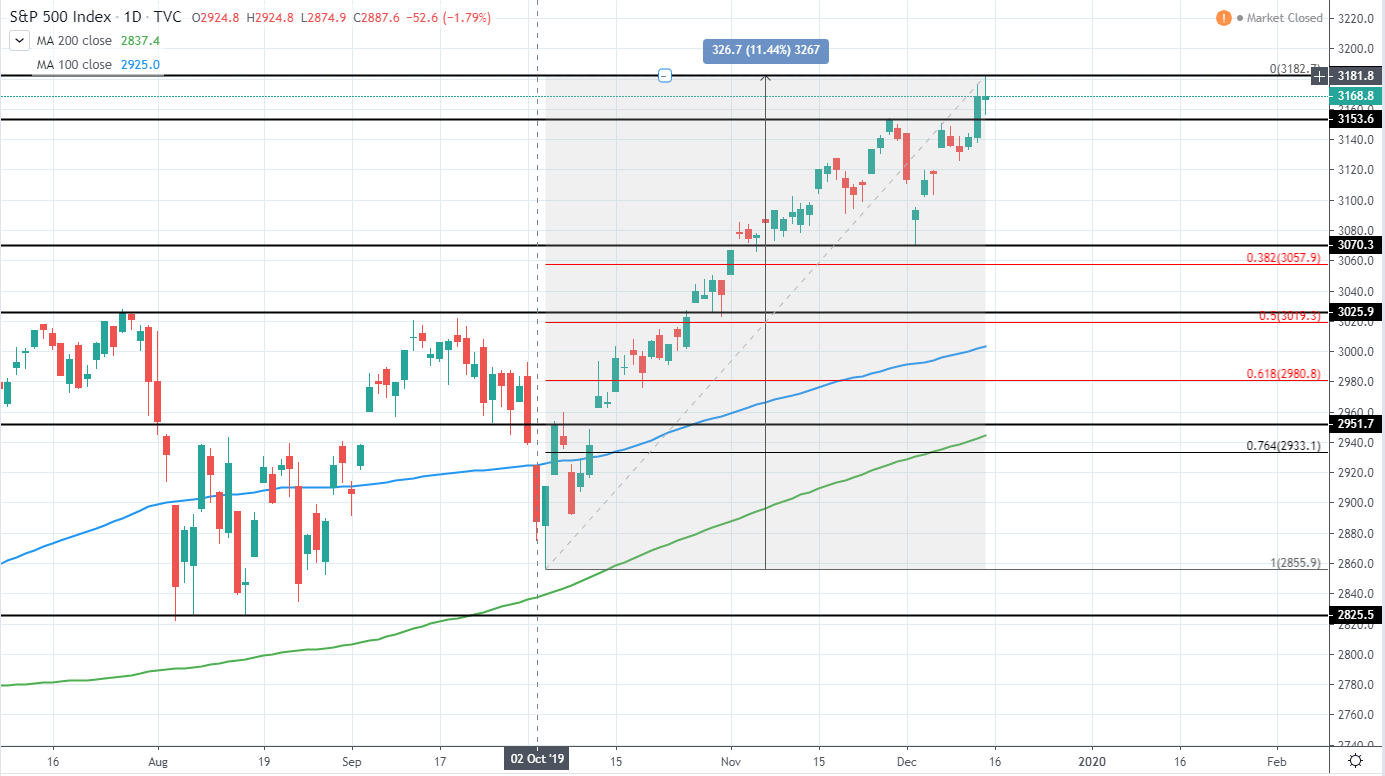
S&P 500 (^GSPC) currently trades around 3,168 USD as it set a new all-time high last week around 3182 USD and showed a slight rejection to the downside, closing relatively bearish, however, still in the green.
In the past months, from the low of 2825 USD, set in 3rd of October, to the current all-time high of 3182, the price has increased by 11.44% and indicates that the current bullish momentum is quite extended as no serious retracement can be seen if recent drop of 2.66% at the beginning of December is excluded. Therefore, we would like to see a considerable retracement in the upcoming weeks, with a good area, where to start looking for long entries, located around 3000 USD, where, additionally, 100 day moving average blue line is currently located.
Additionally, this is between 50 and 61.8% Fib retracement levels from the previous upswing and further indicates a very good risk/reward trade setup once reached.
S&P 500 (^GSPC) Daily:
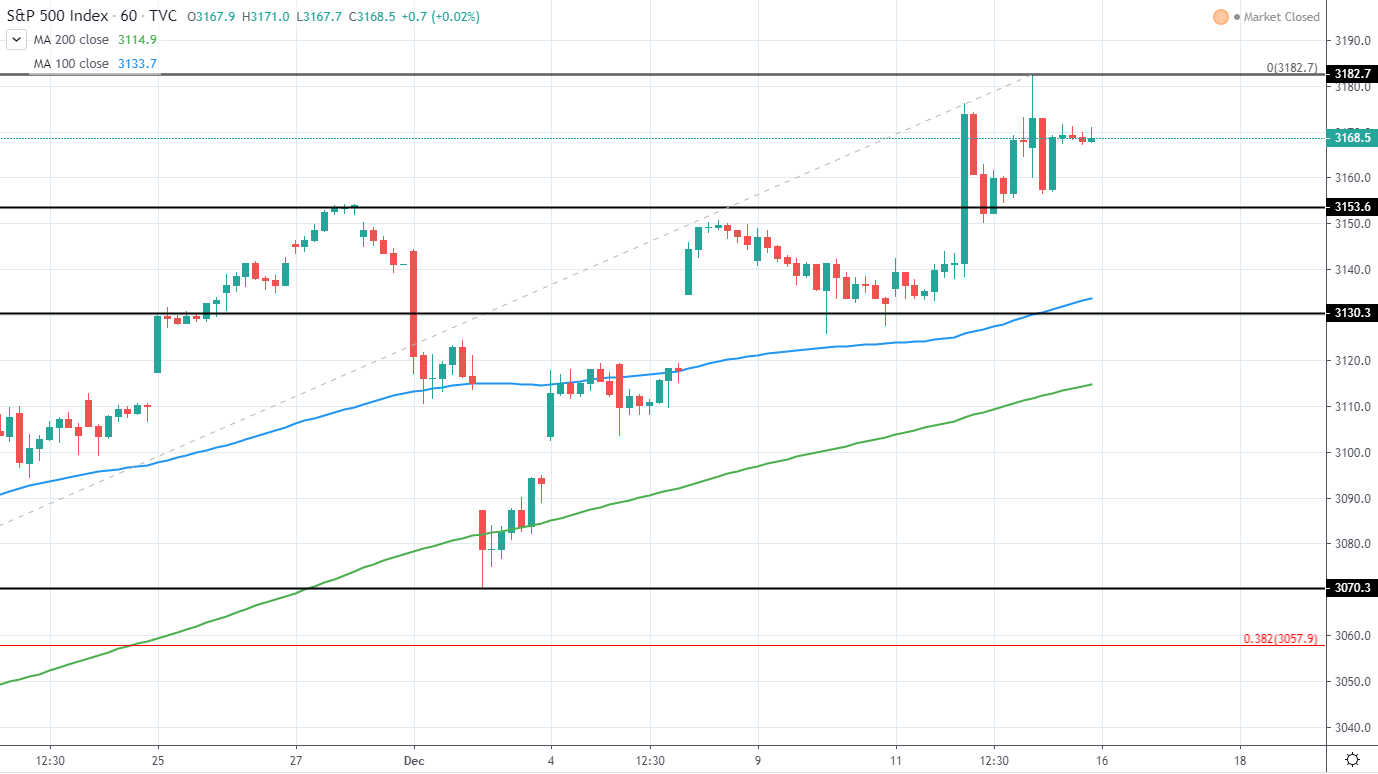
On the hourly chart, the current lack of further bullish momentum can be seen as the price rejected from 3182 USD and went back to retest 3153 USD support, which has previously acted as a strong resistance. Further support level can be seen around 3130 USD in addition to a 100 hour moving average blue line, which if broken would be a very bearish indication and likely lead towards a much larger retracement and possibly used to look for a short position entry.
S&P 500 (^GSPC) Hourly:
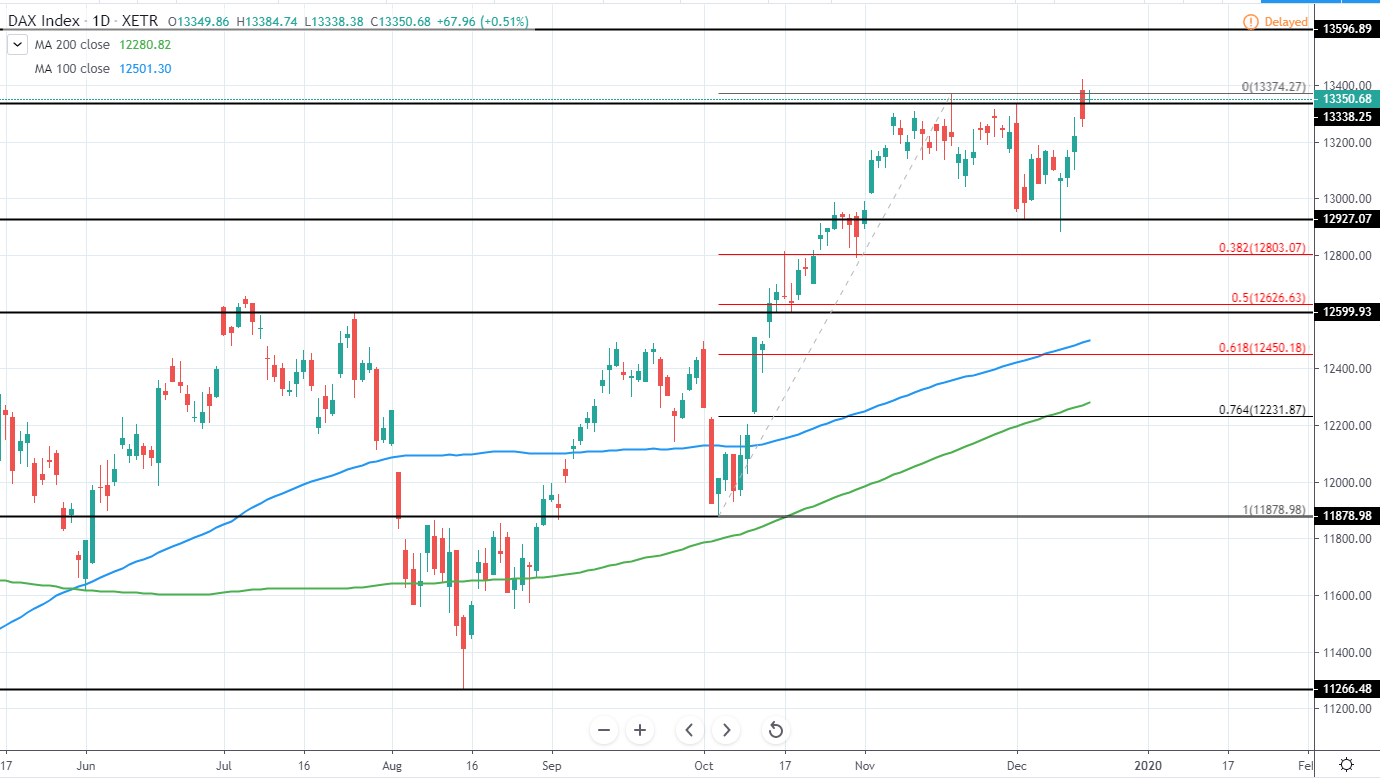
DAX performance-index (^GDAXI) trades around 13,361 EUR as it set a new yearly high around 13,423 EUR and quickly rejected to the downside and closed very bearish.
Therefore, we expect further downside to come this week and 12,927 EUR previous support to be tested once again, which, if breached, would be a very bearish sign for the upcoming months as it would likely lead towards a considerable retracement. The target for this can be seen around 12,450-12,625, which is the area between 50 and 61.8% Fib retracement in addition to 100 day MA blue line, currently seen around 12,501 EUR.
Alternatively, if support is found above 12,927 EUR, we could see another attempt to move higher, however, considering, how extended the current bullish momentum is, it would be best to remain neutral and wait for either a short opportunity or a significant retracement to enter long.
DAX (^GDAXI) Daily:
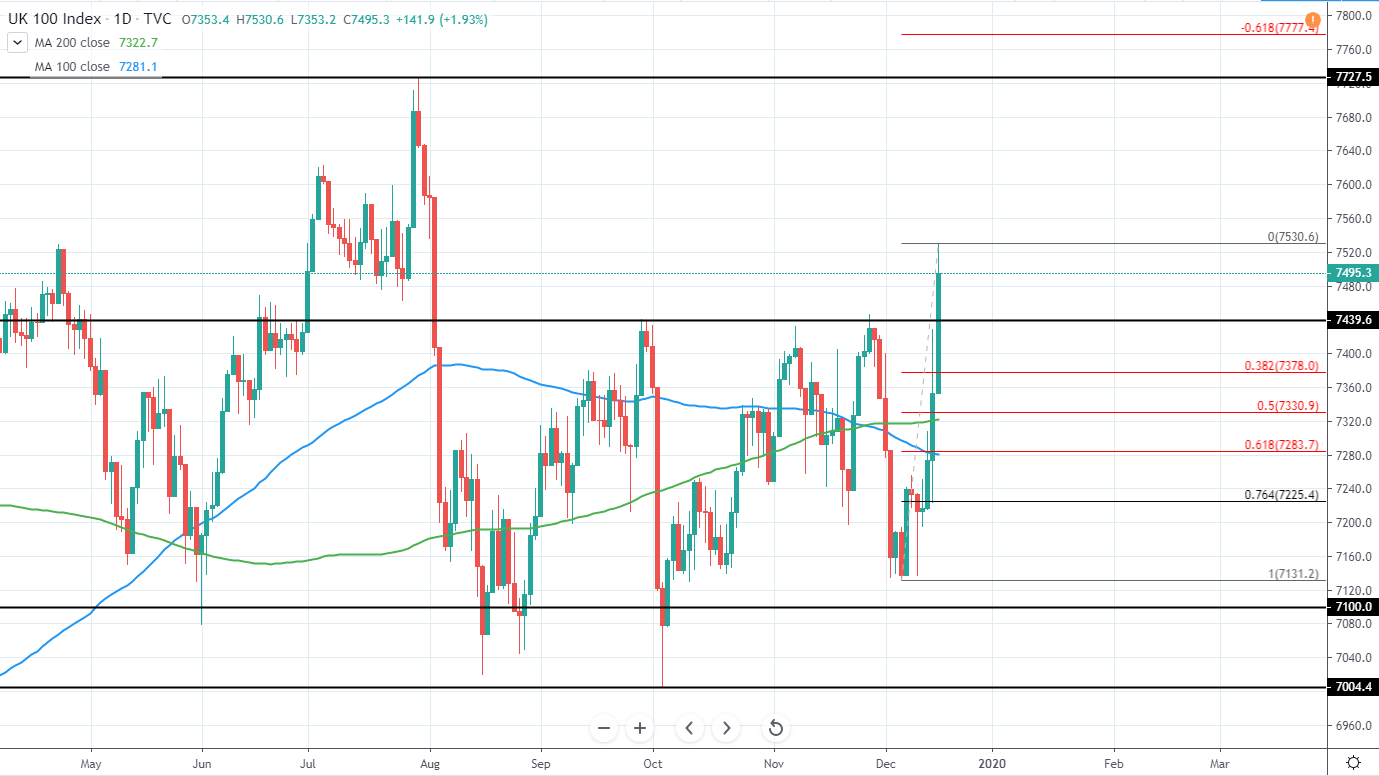
FTSE 100 (^FTSE) currently trades around 7,494 GBP as it broke above the previous several week resistance of 7440 GBP, which reversed the price action 3 times since September. Additionally, the price did make a new higher high around 7131 GBP and indicates a potential bullish momentum forming.
The next major target can be seen around 7727 GBP and would mean a further upside of around 3%. However, the price has extended quite a lot in the past days as it gained 5.63% from the low of 7131 to the high of 7530 GBP and, therefore, best would be to wait for a decent retracement before entering a long position.
Entry could be made around 7283-7330 GBP, which is the zone between 50-61.8% Fib retracement from the previous upswing and in addition, 200 day MA green line is currently located around 7322 GBP as additional support.
Therefore, short-term we are bearish and expect a retracement, however, mid-term the market looks bullish and can be entered once the price drop slightly.
FTSE 100 (^FTSE) Daily: