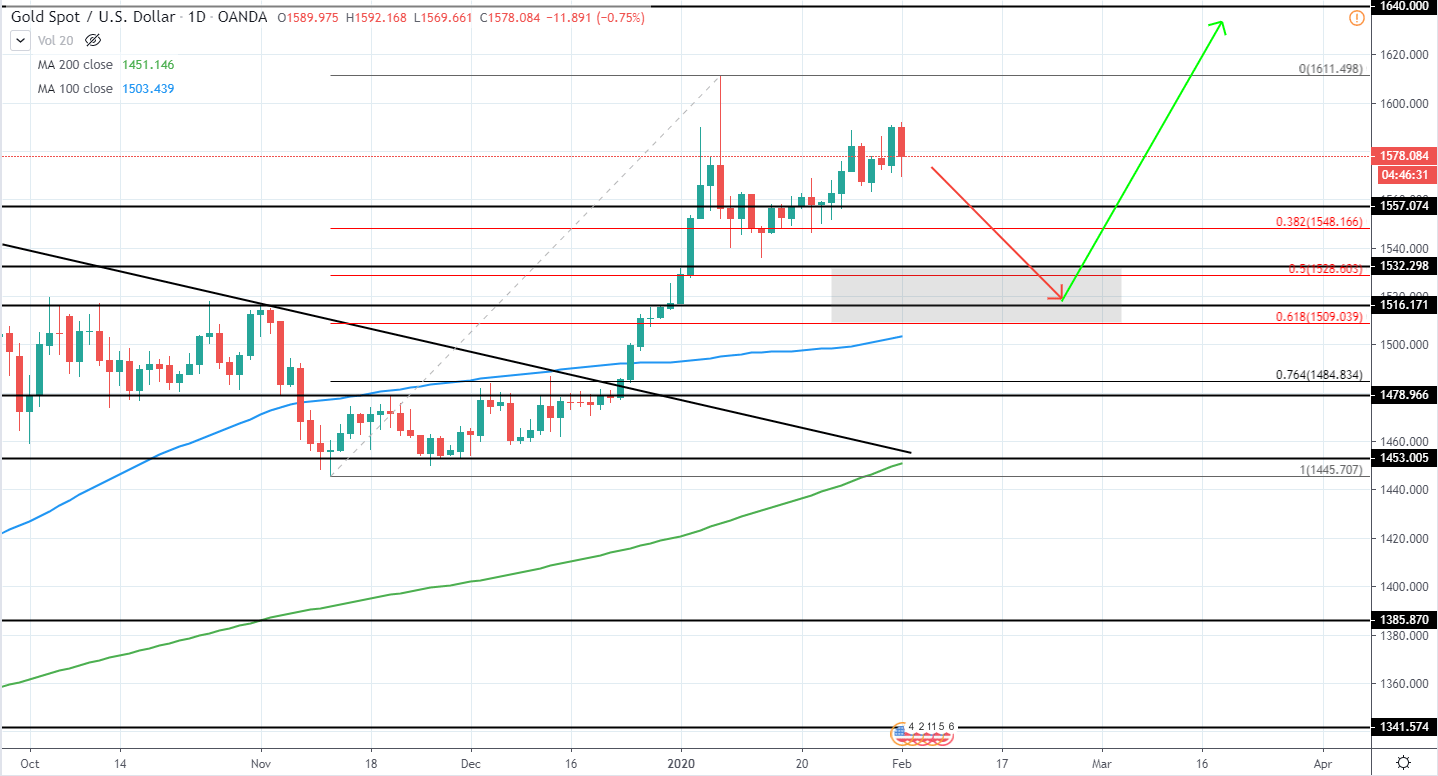
Gold has continued to move to the upside after setting a major high around 1611 USD on the 8th of January, however, the momentum is not strong and we can expect the price to retrace in the upcoming weeks.
Retracement will likely be made towards previous horizontal resistance levels that will likely act as a support around 1516 and 1532 USD as well as area between 50-61.8% Fib retracement, from which a long position could be entered with a very good risk/reward potential. Afterward, the next major upside target of resistance can be seen as far as 1640 USD, meaning a potential upside of around 8% from the support area.
For now, however, best is to stay neutral and wait for further price action development
GOLD Daily:
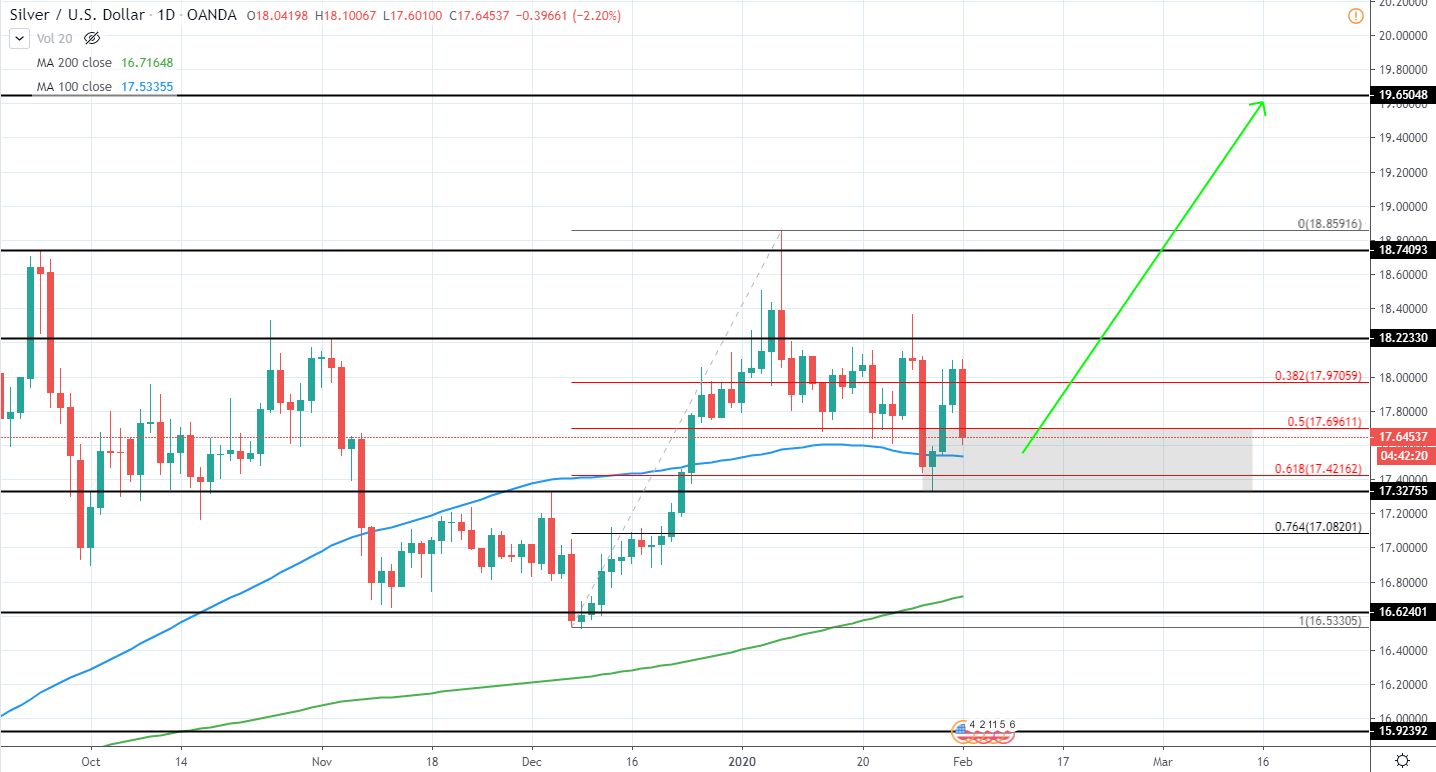
Silver has continued consolidating after moving lower last week towards the previously mentioned support around 17.32 USD as well as 61.8% Fib retracement from the previous upswing in addition to 100 day moving average blue line.
Therefore, we can start to look for an entry once again as the price has retraced enough and looks to set a higher low. The next target can be seen around 19.65 USD and would mean a potential gain of around 11.5% from the current price.
Currently, however, best would be to wait for further price action development as a clear sign of reversal back to the upside in the form of a higher local low is yet to be seen.
SILVER Daily:
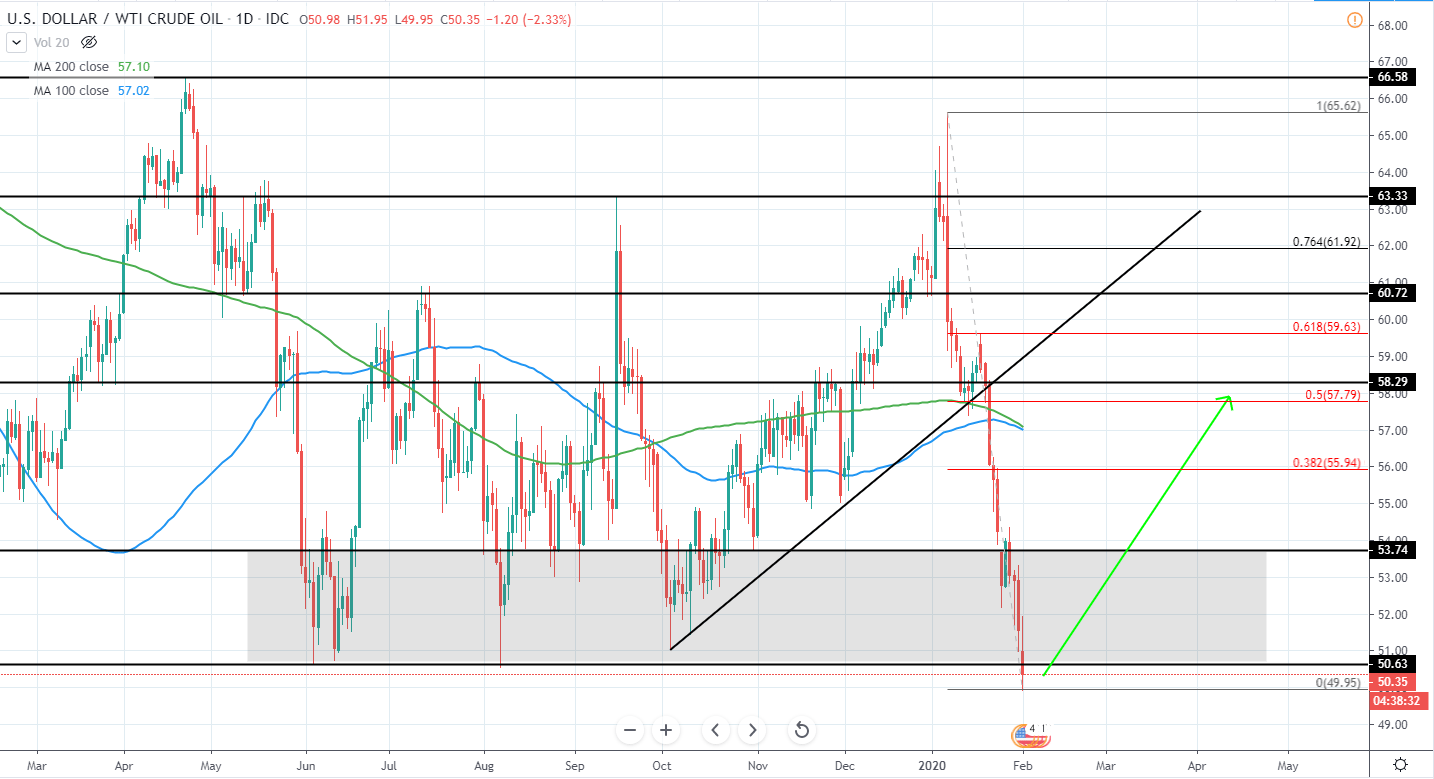
WTI continued to move lower in a very bearish momentum as has slightly broken below previous major support around 50.63 USD. Overall the several week bearish momentum has extended significantly and a retracement back towards previous support/resistance levels will likely be seen in the upcoming weeks.
For now, however, it is unclear whether a new low has been set as no significant rejection has been seen and we could see further downside in the upcoming days. If signs of rejection are seen, a long position could potentially be taken in the expectation that the price will look to retrace towards 50% Fib retracement level around 57.79 USD as well as previous resistance around 58-59 USD.
Therefore, the best option is to stay neutral and wait for further price action development.
WTI Daily:
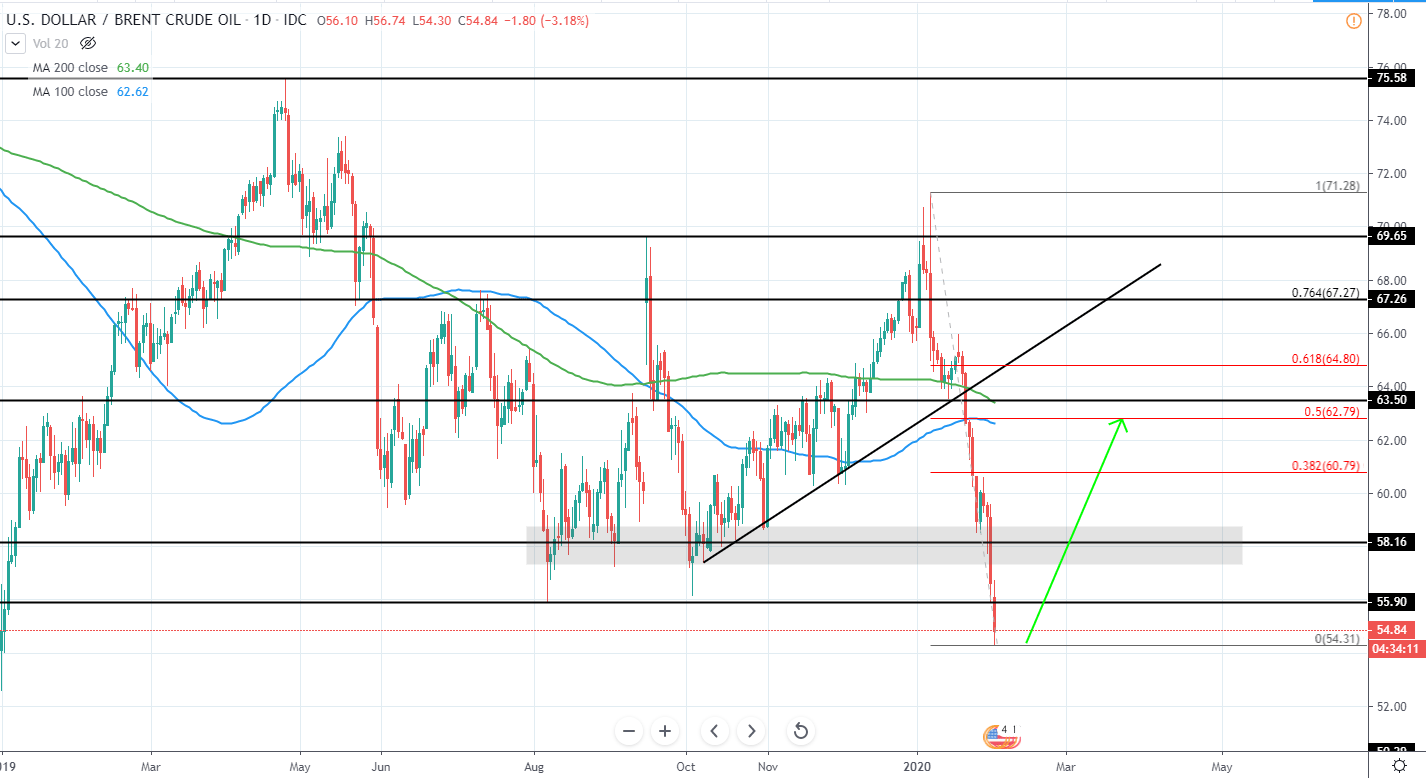
BRENT has also broken a previous major support area around 56-58 USD as it continued to move lower after breaking below several month ascending trend line as well as resistance/support area around 63.5 USD in January. Additionally, a clear lower low has been set below the previous support of 55.9 USD and indicates a bearish momentum looking to reverse the overall trend to the downside.
The price could still move lower and, therefore, best is to wait for further price action for now. Once signs of reversal are seen, a long position can be taken in the expectation that the 63.5 USD resistance as well as 50% Fib retracement will be tested, meaning a potential upside of around 14-15.5% from the current price.
BRENT Daily:
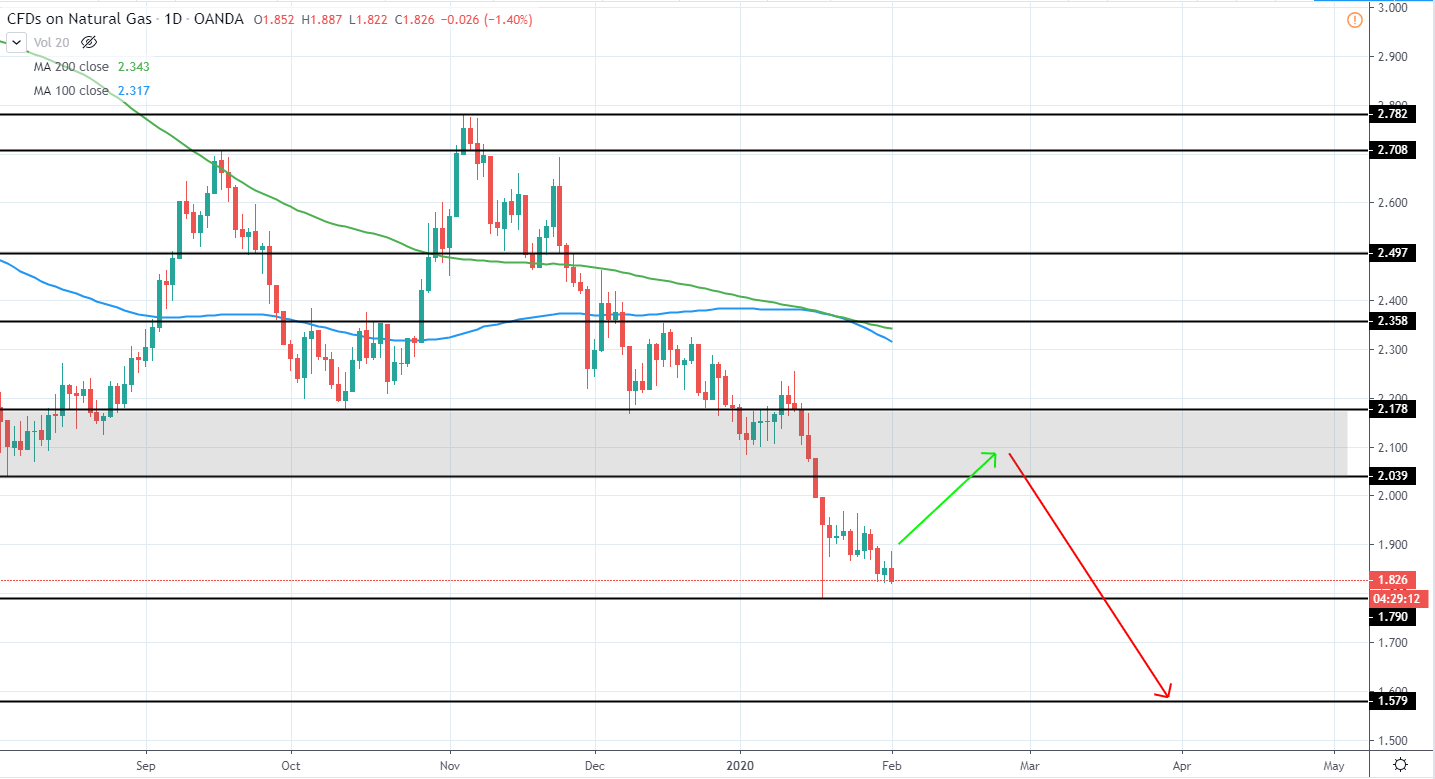
NAT GAS has continued slightly moving lower as it looks to retest the previous low of 1.79 USD that set a clear lower low and indicates that the overall bearish trend will continue this year.
Overall, the price has extended quite a lot to the downside during the past weeks and a retracement is needed before we can consider shorting the market again. A potential area of resistance can be seen around the previous support of 2.05-2.2 USD and would serve as a good range from which to consider taking a short position once again.
For now, however, it is best to stay neutral and wait for further price action development.
NAT GAS Daily: