
Published: June 8th, 2022
The music streaming company has seen its stock face a 53% loss in the last five months. The current price trades below the 110.00 psychological level, representing a 64% price drop from the 305.60 yearly high. Moreover, the selling pressure was boosted in April with a 33% discount as the US interest rate hike affected the stock market.
In the latest quarterly earnings report, the company reported $0.22 in earnings per share with a revenue of $2.85 billion. Although the revenue and earnings were strong, investors kept selling this stock due to finding some troubling signs. The gross margin came at 25.2%, down from 25.5% in the previous quarter, although the company promised to raise it as high as 40%.
Besides, the advertising revenue was softened during the Q1, increasing an additional concern. As per the company, the reason behind the negative sentiment is the current Ukraine-Russia war that slowed down the ad growth.
Let’s have a look at the complete future price direction from the Spotify Stock (SPOT) technical analysis.
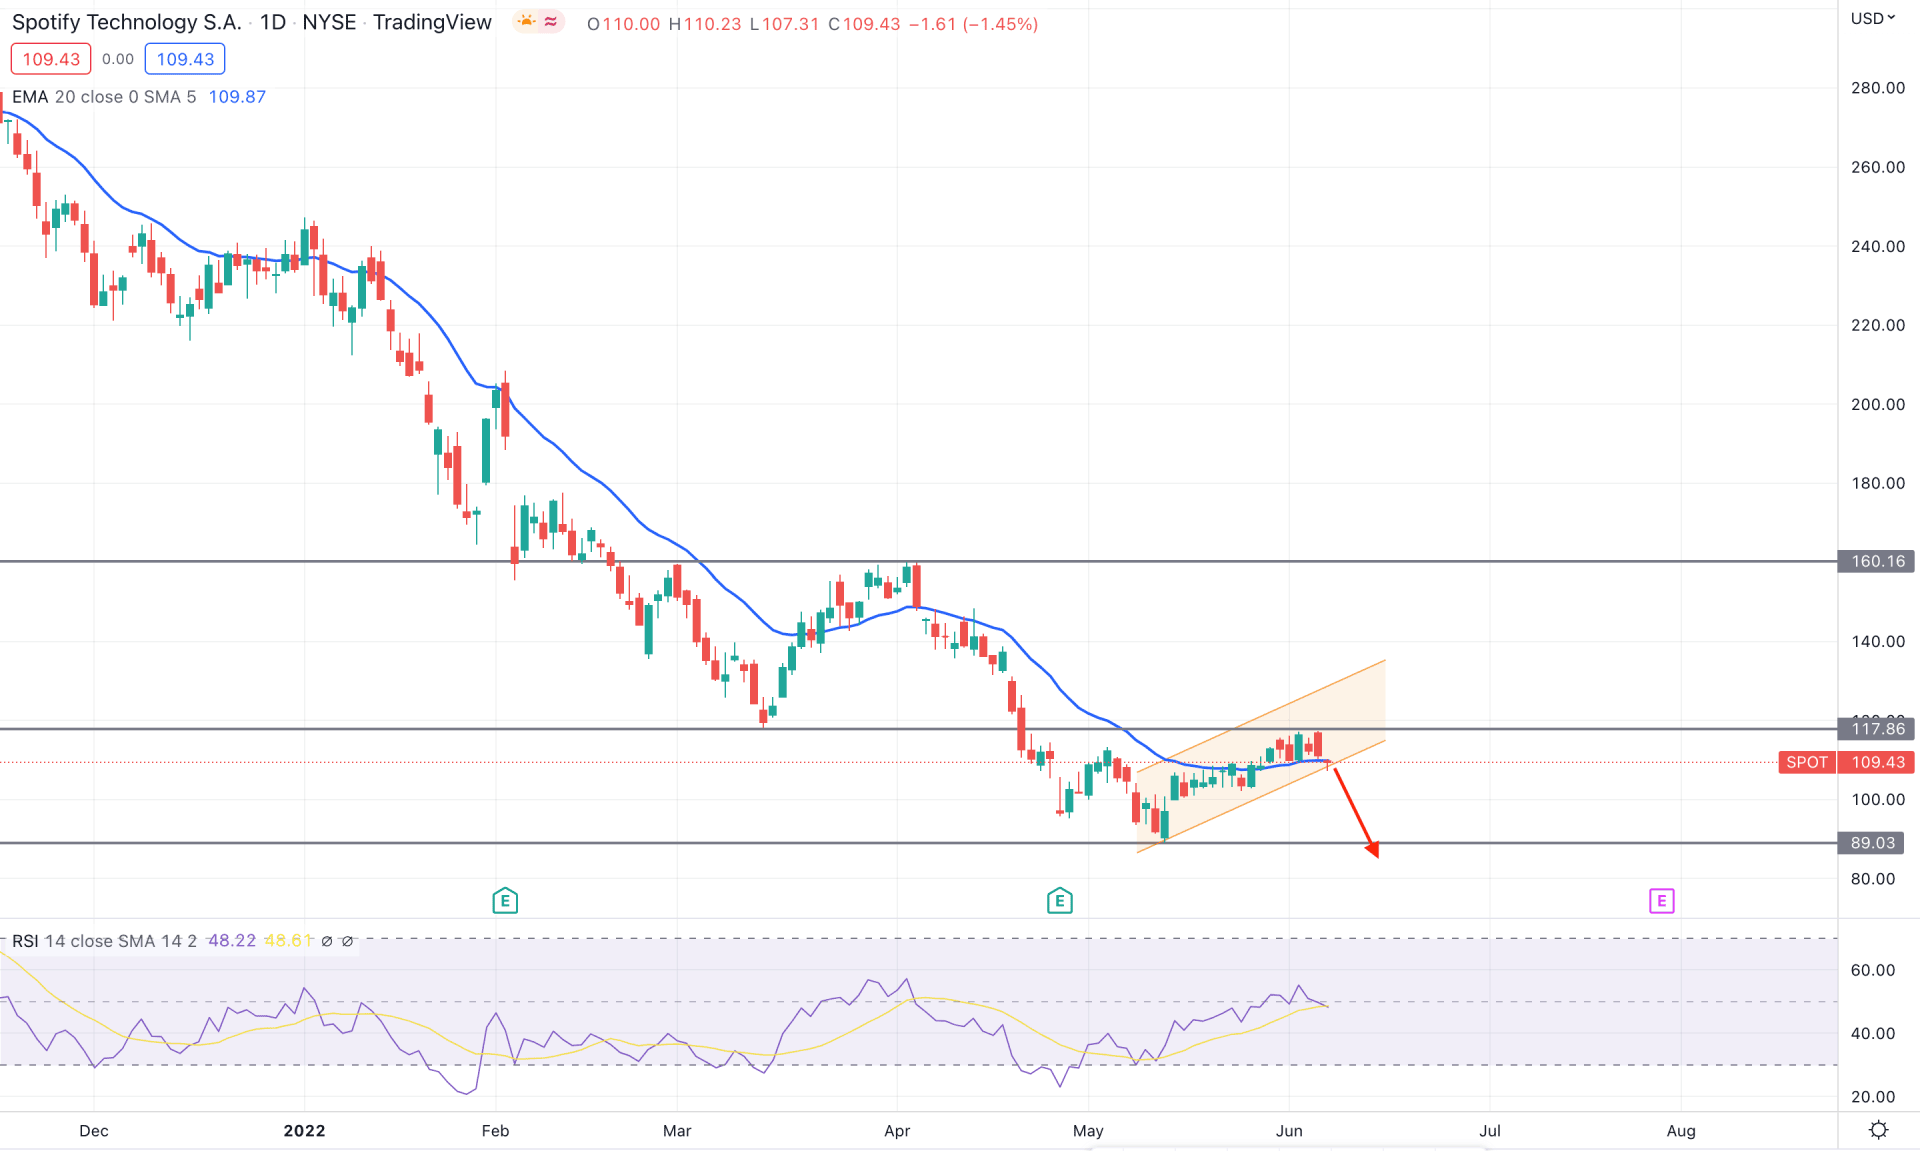
In the daily chart, Spotify Stock (SPOT) trades within a strong bearish trend where the price made consecutive lower lows since the beginning of 2022. However, the bullish pressure initiated from the May 2022 low took the price above the dynamic 20 EMA, but it became volatile after reaching the 117.86 resistance level. As the current price remained volatile at the resistance level, selling pressure with a bearish daily candle below the dynamic 20 EMA would be a selling opportunity.
The above image shows how the price trades at the dynamic 20 EMA area, where the RSI remained corrective at the neutral 50 level. Moreover, the current price trades within an ascending channel where the 117.86 level is the primary barrier for bulls.
Based on the daily structure, bears have a higher possibility of taking the price down after a bearish daily close below the channel support. In that case, the primary aim is to test the 89.03 support level before showing a bullish correction. Another approach is to find a stable price above the 117.86 static level that may extend the bullish momentum towards the 140.00 channel resistance area.
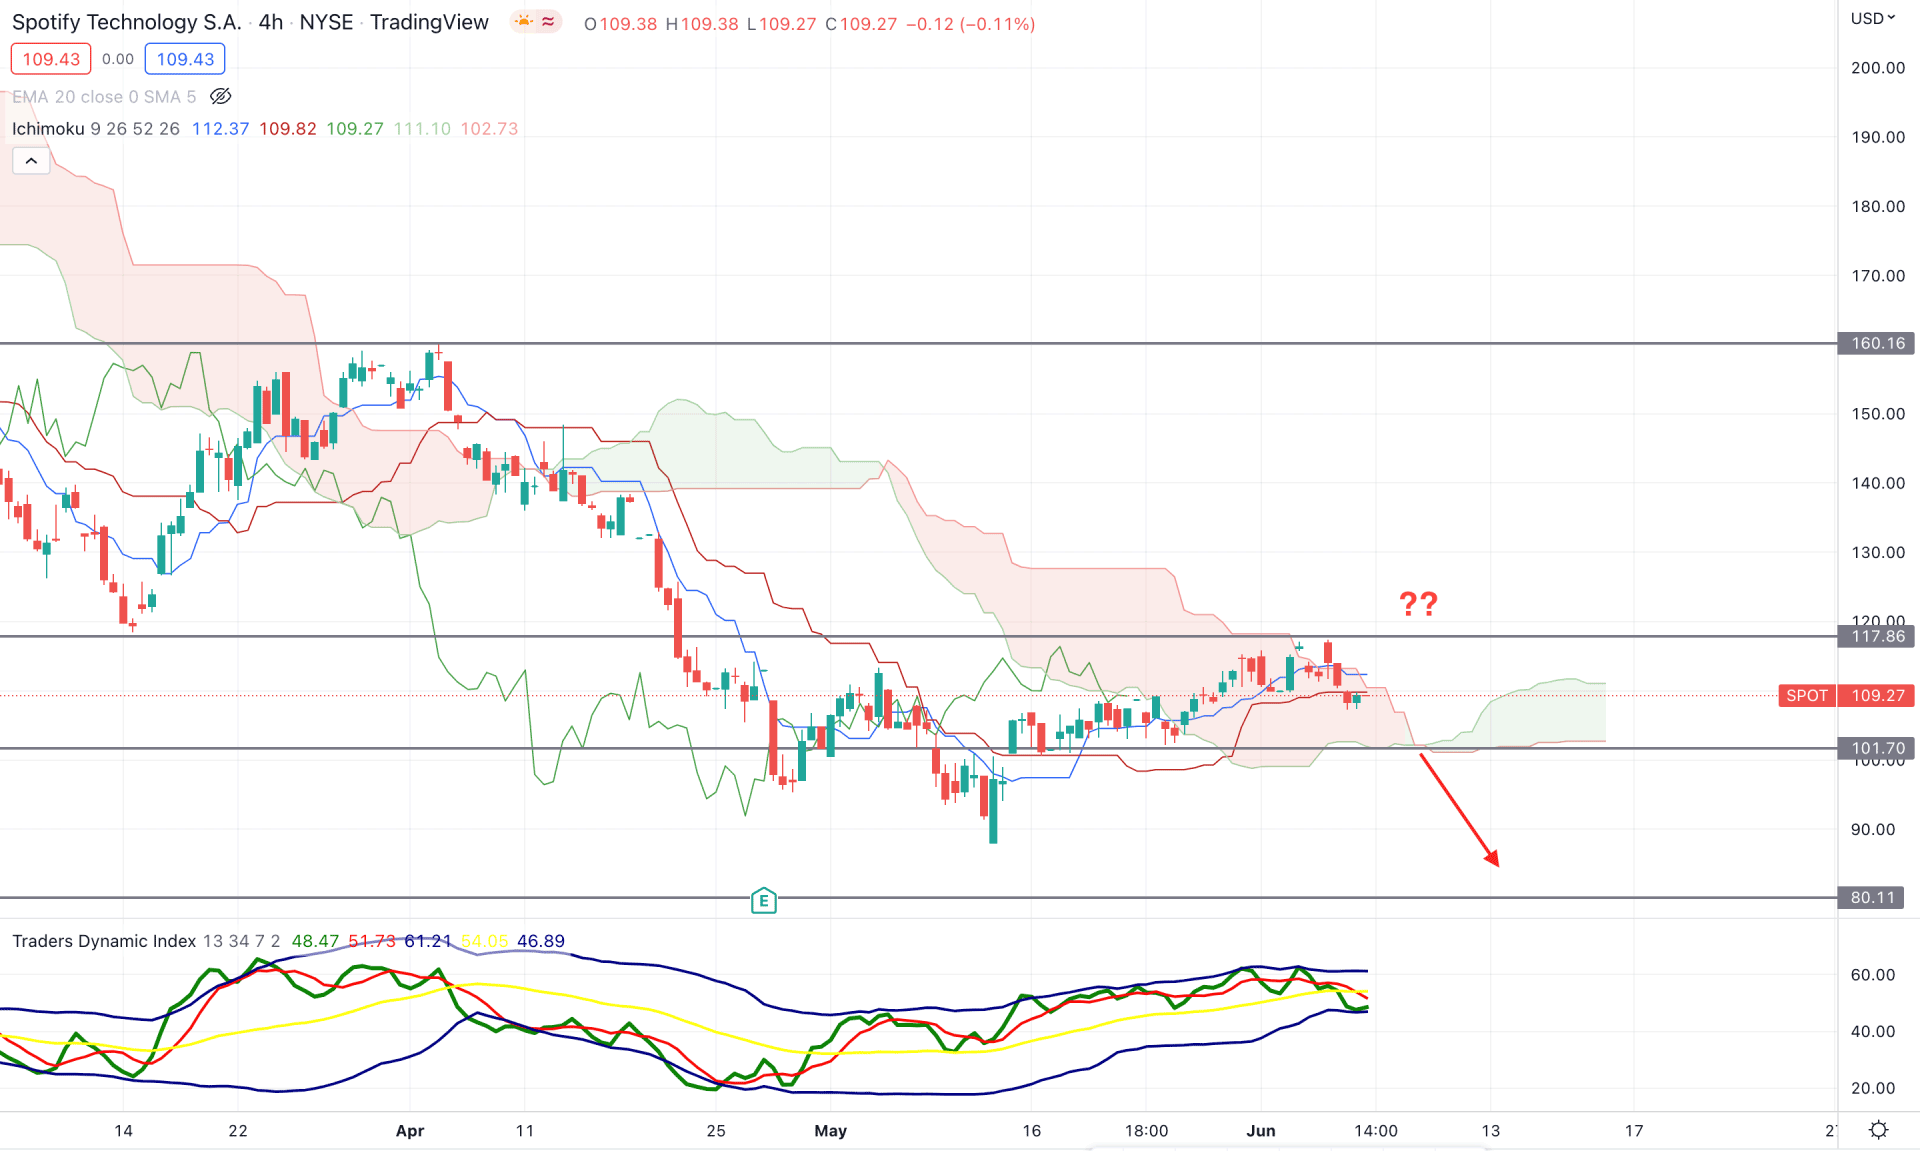
According to the Ichimoku Cloud analysis, SPOT is trading within a corrective momentum while the broader market context remains bearish. In the future cloud, the Senkou Span A aims higher above the Senkou Span B while the Lagging Span is above the price. However, the current price is still within the Cloud area, where a bullish break of structure above the 117.86 is essential to consider as a trend change.
The above image shows how seller activity increased from the Traders’ Dynamic Index Indicator. The TDI line reached the lower band and remained stable. At the same time, the current price trades below the dynamic Kijun Sen. Any bearish rejection from the dynamic Kijun Sen level would increase the selling pressure in the coming days.
Based on the current price structure, investors should wait for a bearish price action below the 101.70 static support level to consider it a bearish opportunity. On the other hand, any strong bullish price action above the 117.86 level would increase the buying opportunity where the primary aim is to test the 150.00 area.
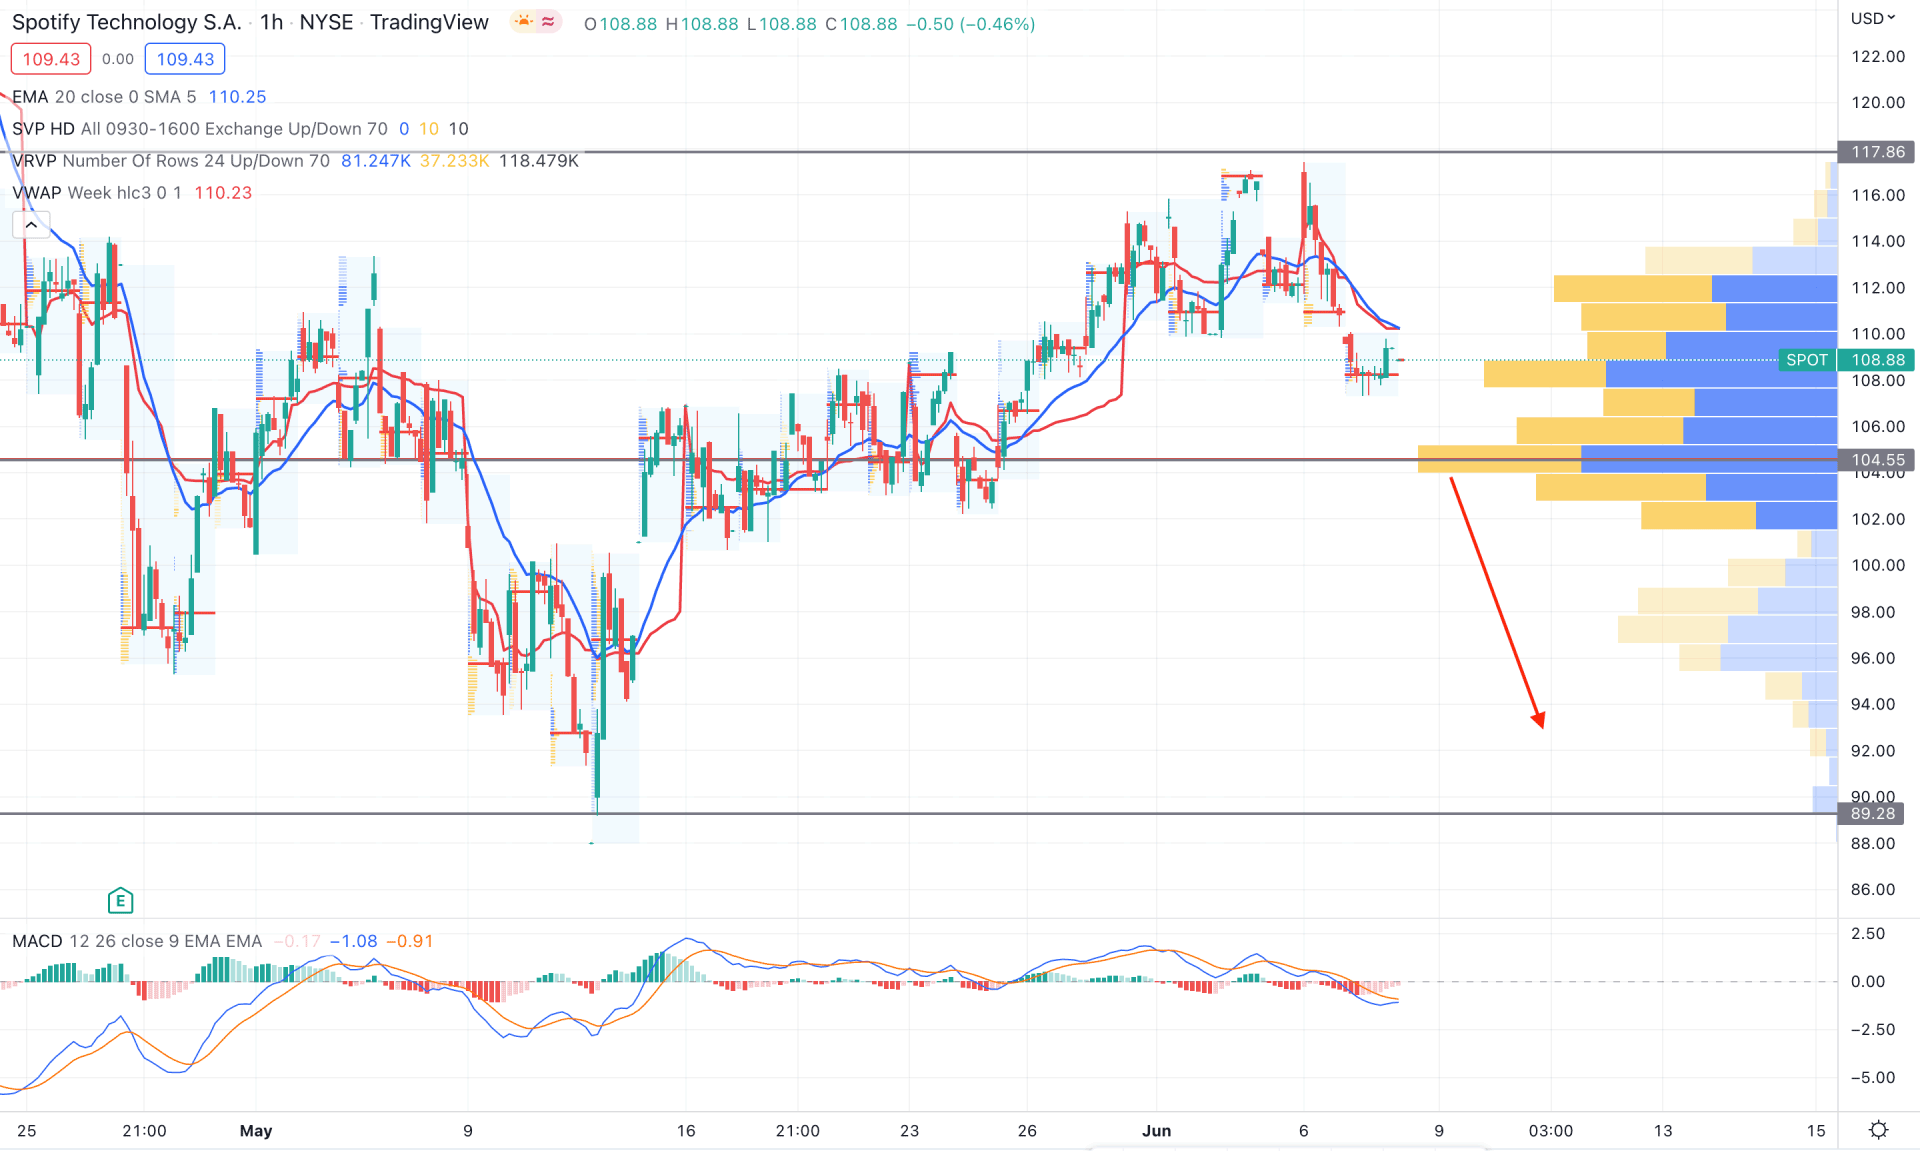
In the Spotify Stock (SPOT) intraday chart, the current price remains corrective within the 117.86 to 104.55 range, where the highest trading volume in the visible range is at the 104.55 level. Moreover, the intraday high volume made multiple lower lows before appearing below the current price at 108.25. Based on this volume structure, bears should overcome the 104.55 level to face decent selling pressure in this instrument.
The above image shows how dynamic 20 EMA and weekly VWAP work as major dynamic resistance to the price. Therefore, as long as the price trades below the dynamic level, it may move lower in the coming days. The trading idea is to wait for an H1 candle below the 104.55 support level before finding the bearish opportunity towards the 83.00 level. On the other hand, if the bullish H1 candle appears above the 117.86 level, it may extend the buying pressure towards the 140.00 area.
As per the current market context, SPOT has a higher possibility of extending the bearish pressure with a trend continuation momentum. In that case, investors should monitor how the price moves below the channel support to find the potential bearish opportunity.