Published: October 20th, 2020
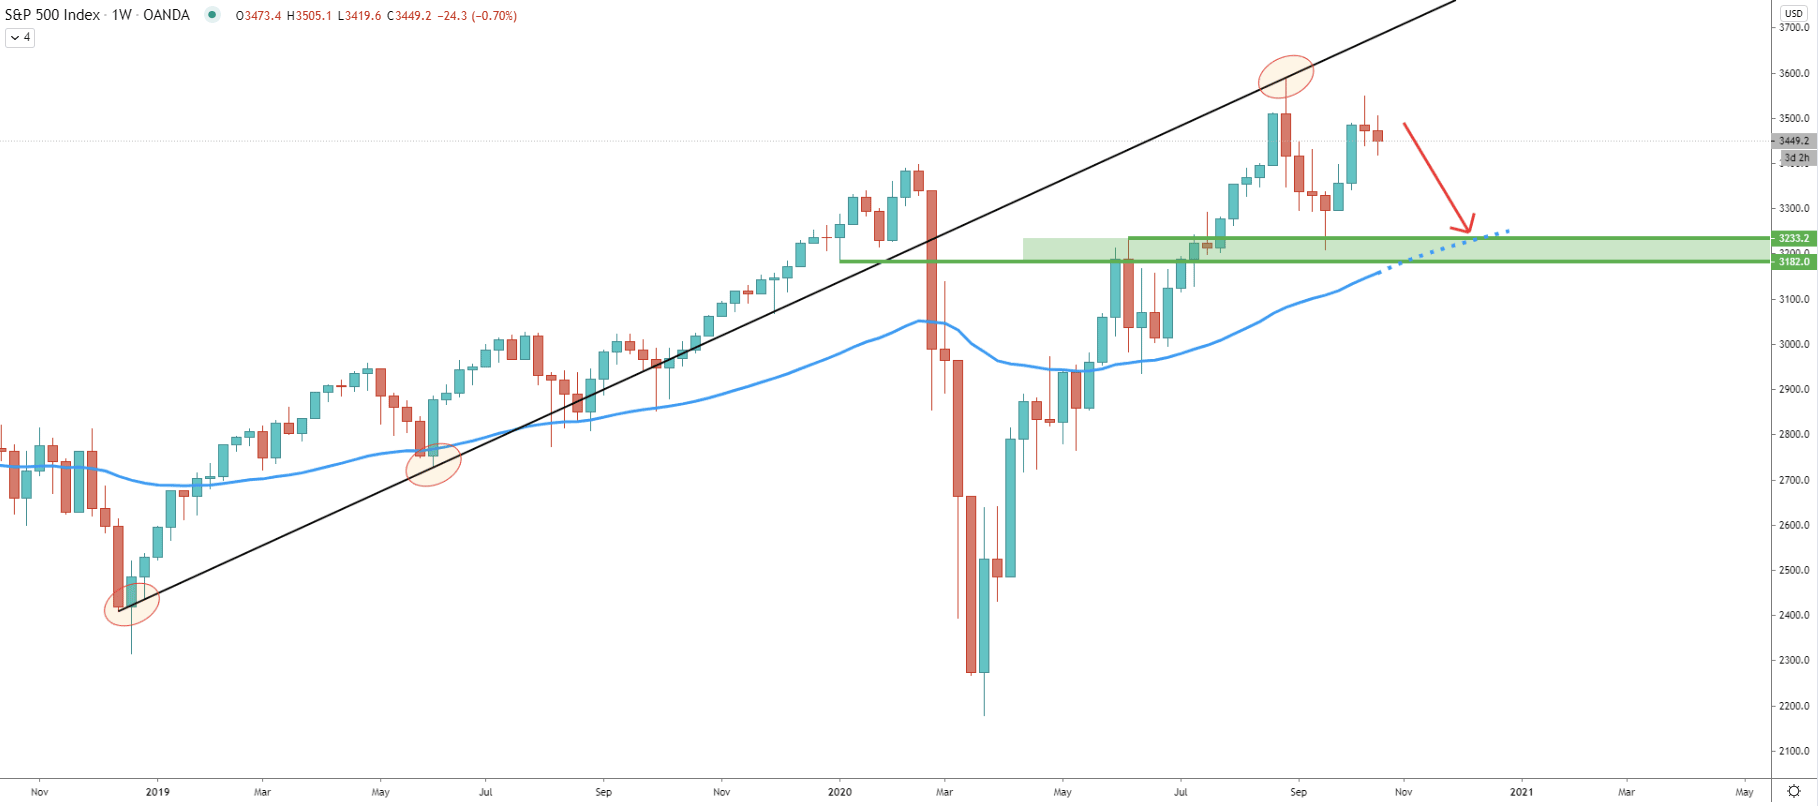
On September 2, S&P500 Index has reached an all-time high, while testing the 3588 level. At that point, the price has reached and cleanly rejected the uptrend trendline, which has been acting as the resistance. Right now, what could be happening is the potential formation of the double top or preparation for either a strong pullback or even a long-term trend reversal.
Therefore, as long as the price remains below 3588 high, S&P500 Index will most definitely attempt to go lower. Price could be aiming to test the 50 Exponential Moving Average which corresponds to the previous supply/demand area between 3182 and 3233.
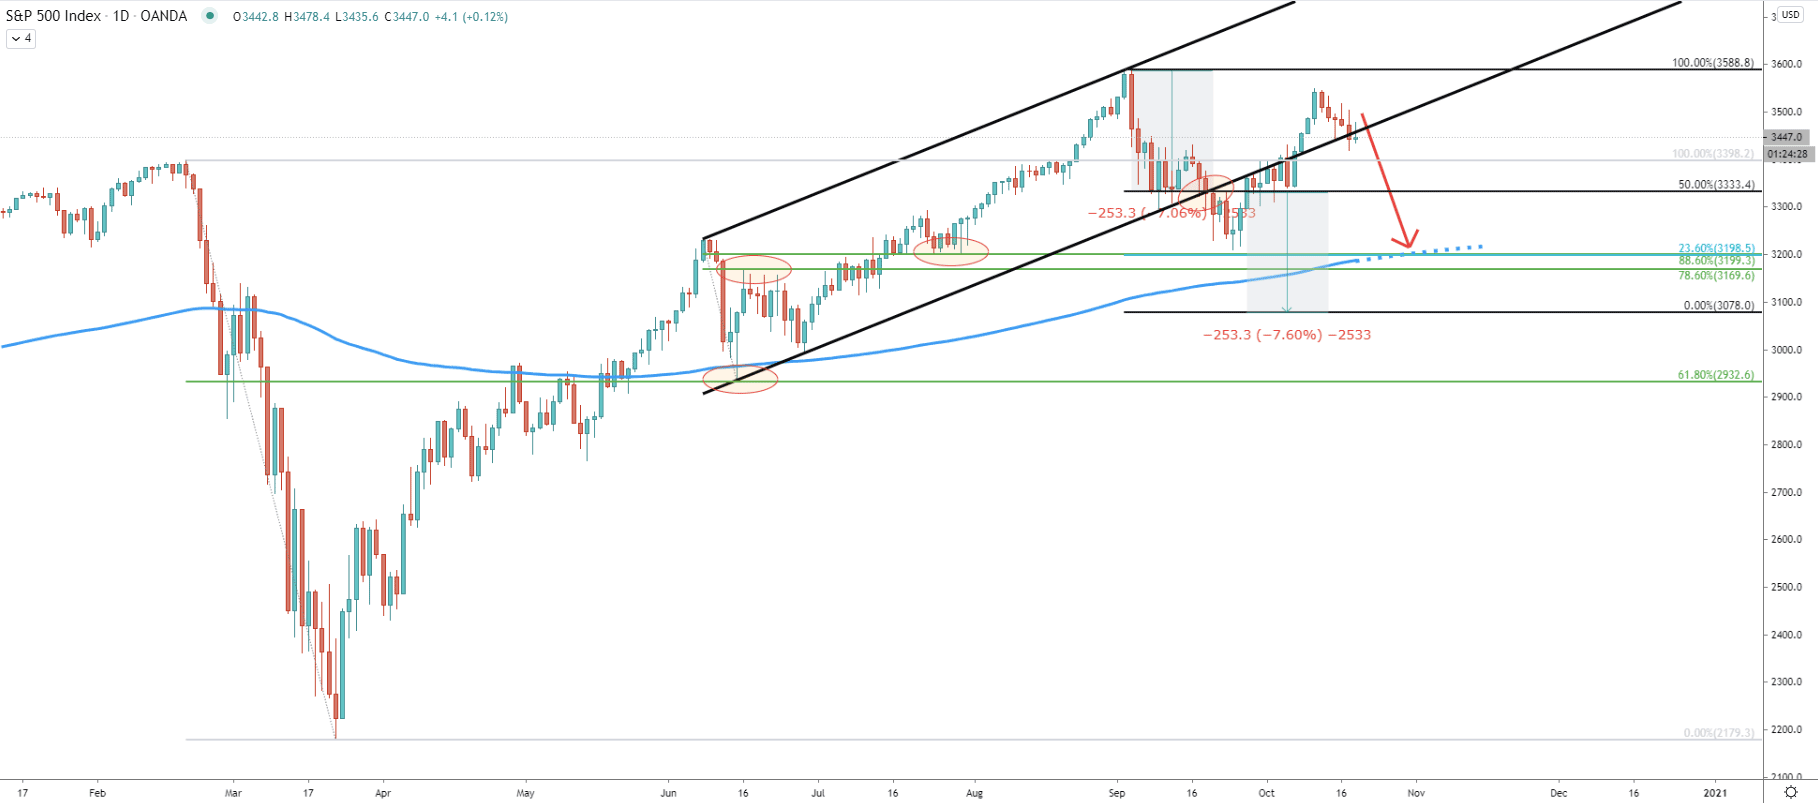
On the daily chart, S&P500 Index broke below the ascending channel suggesting further price weakness. Although since the breakout occurred S&P500 has been correcting up. But this correction could be providing a good risk/rewards opportunity to the sellers, as the price is expected to decline towards the 3200 psychological level.
To be precise, the key support is located at 3198, which corresponds to two Fibonacci retracement levels. First is the 88.6% Fibs, applied to the corrective wave down, when the 200 Exponential Moving Average as well as 61.8% Fibs at 2932 was rejected. The second Fibs was applied to the channel breakout point, where a 50% retracement level is placed. It shows that the final downside target at 0% Fibs is located at 3078. However, 23.6% Fibs at 3198 corresponds exactly to the 88.6% Fibs.
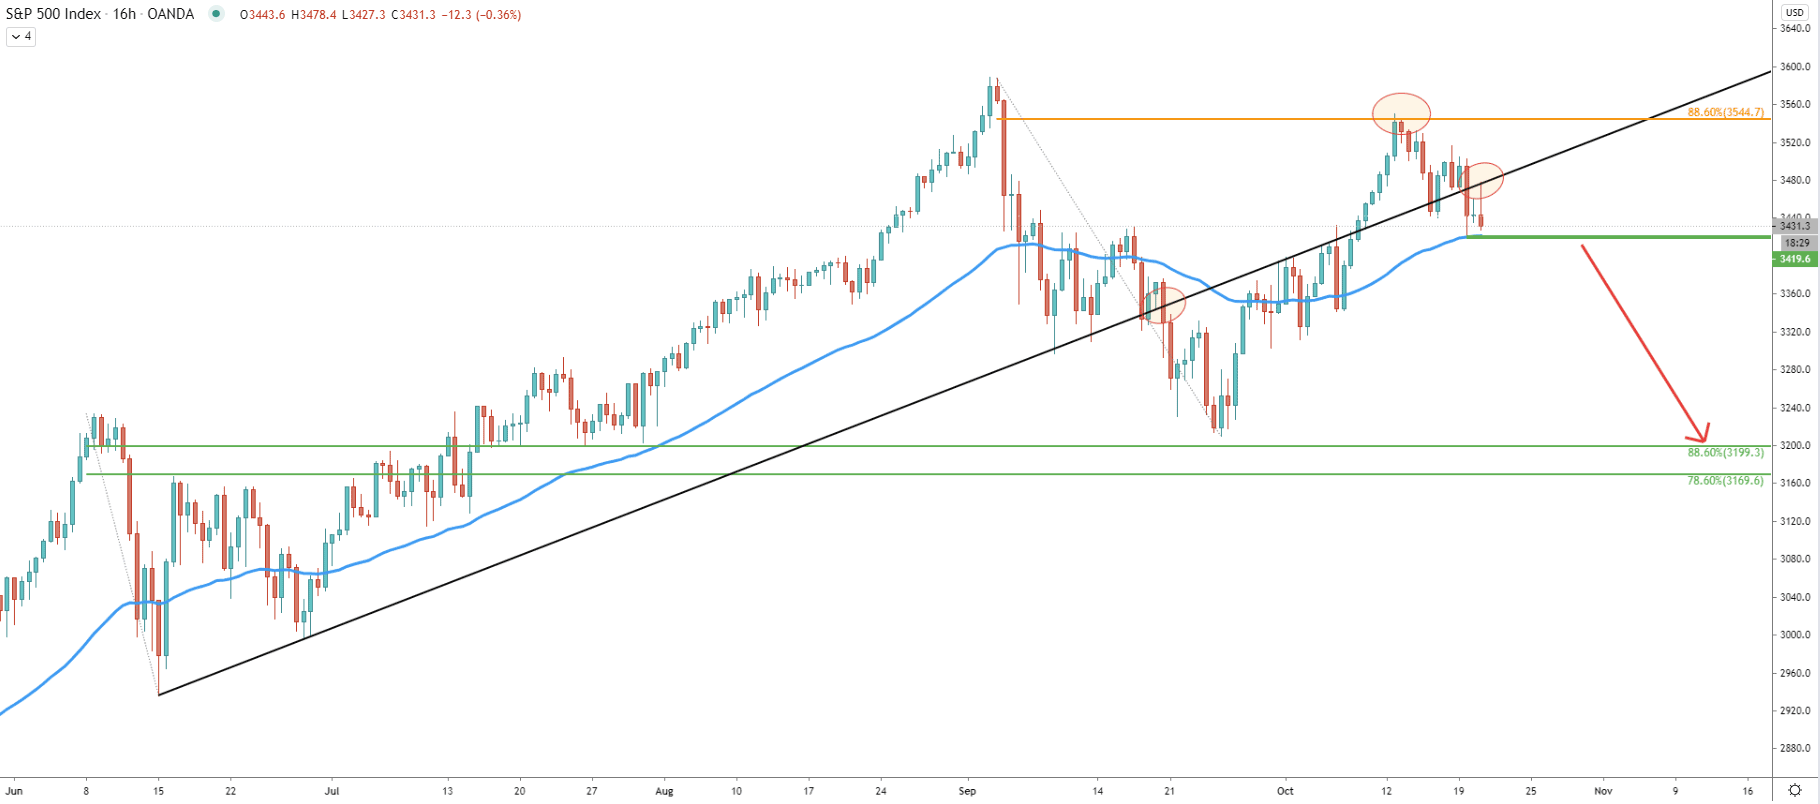
Back on September 18, the S&P500 Index price broke below the uptrend trendline. The corrective move to the upside brought the price up to 88.6% Fibonacci retracement level at 3544. Clearly, this resistance level has been rejected, after which the price started to decline once again. Right now, the S&P500 Index is facing support at 3419, which is a 50 Exponential Moving Average.
On the other side, it is facing the resistance, while cleanly bouncing off the downtrend trendline. It is very likely that sellers are waiting for the break and close below the 3419 support on the daily timeframe, before taking any action.
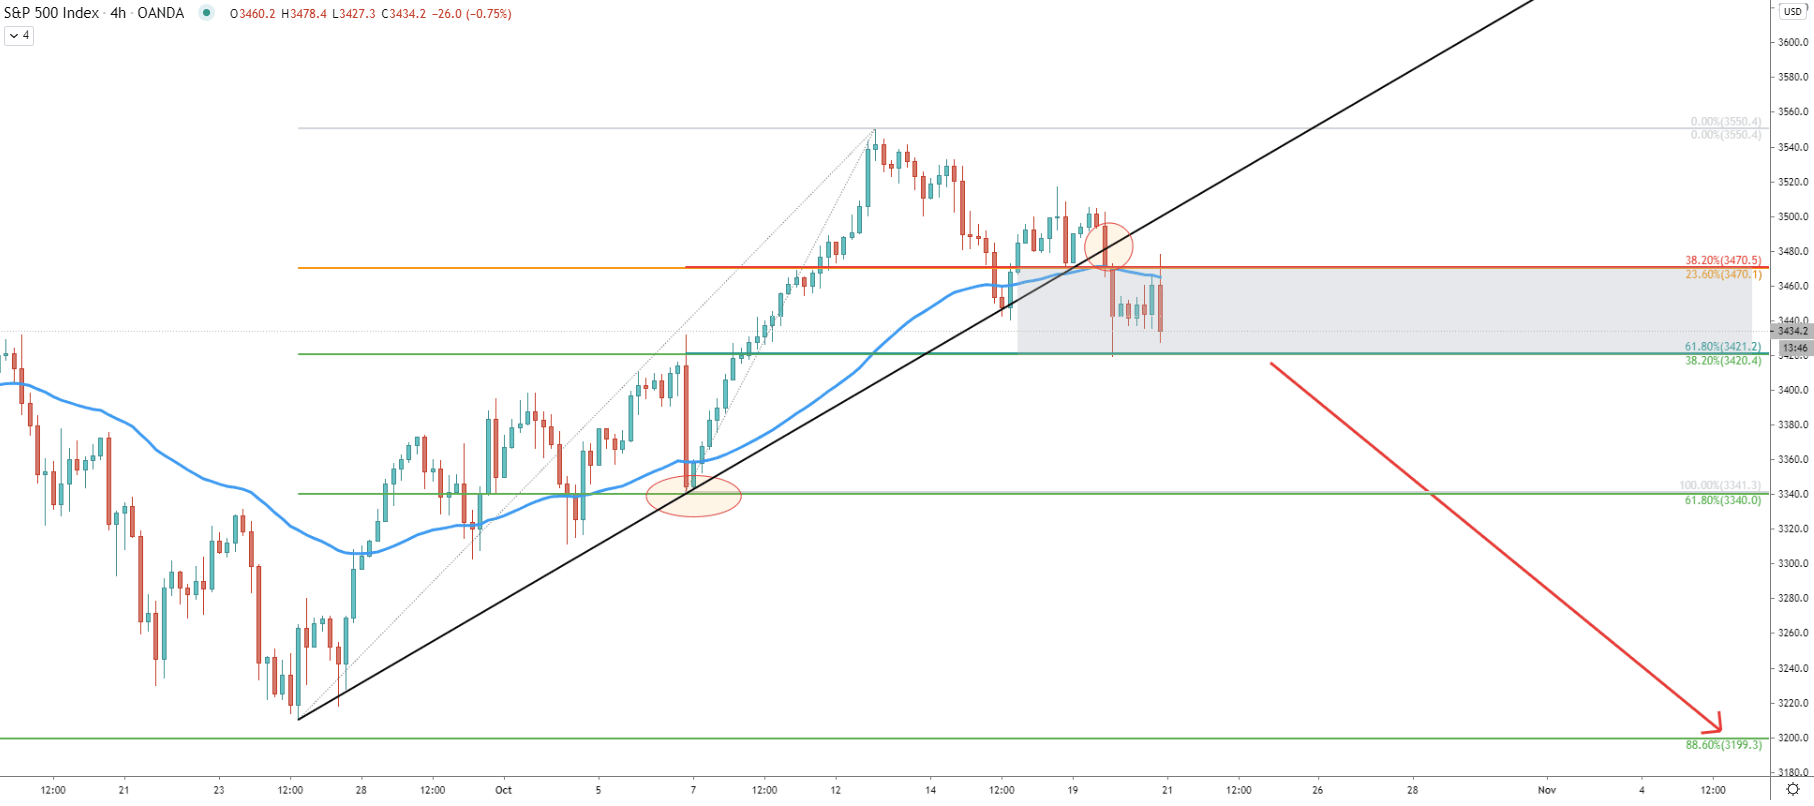
On the 4-hour chart, the price broke below the downtrend trendline as well as 50 Exponential Moving Average simultaneously. While this was a strong bearish signal, S&P500 found support at 3420. This support level is confirmed by two Fibs, 61.8%, and 38.2%. In regards to the resistance, it is located at 3470 and also confirmed by two Fibs, 38.2% and 23.6% as per the 4h chart. Therefore, currently, S&P500 is in the grey zone between 3420 support and 3470 resistance, where the price is likely to consolidate for a short period of time. It will be important to see the breakout to the downside, to confirm the increasing selling pressure.
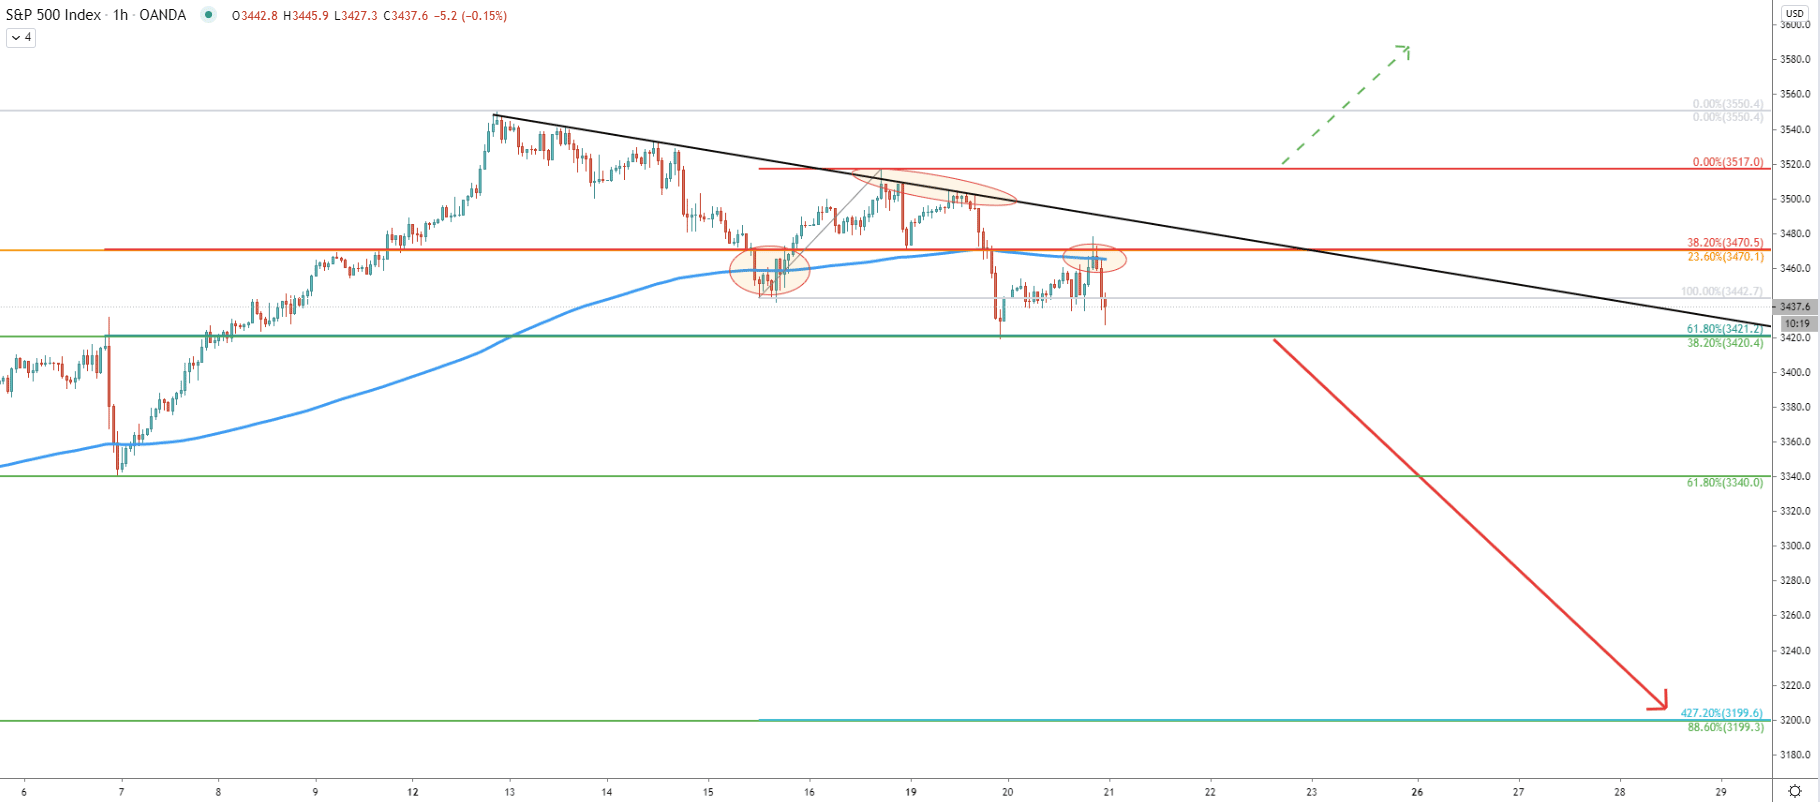
Finally comes an hourly chart, where price broke below the 200 EMA after which it rejected the downtrend trendline. Lower lows and lower highs pattern is in place while the 200 EMA is currently acting as the resistance. This goes to show the bearish domination, at least on the lower timeframes.
Concerning the downside target, the previously mentioned support at 3200, now corresponds to the 427.2% Fibonacci retracement level applied to the corrective wave up where the downtrend trendline was rejected.
On lower timeframes, S&P500 is showing the beginning of the bearish trend. Alghtout there is minor support which must be broke prior to the potential beginning of the downtrend.
As per the daily and 1-hour chart, the key resistance is located right at the 3200 psychological level. This support is confirmed by 3 different Fibonacci retracement levels, making it an extremely strong demand area.
As per the hourly chart, 1h and/or 4h break and close above the 3517 resistance will invalidate bearish outlook. Such price action is likely to result in S&P moving up, potentially to produce yet another all-time high.
Support: 3420, 3340, 3200
Resistance: 3470, 3517, 3550