
Published: December 23rd, 2021
Shopify has become an e-commerce giant with more than $1 billion in quarterly sales, which helped it challenge eBay and Amazon.com. However, the recent Q3 earnings report showed a disappointing result where investors have seen the earnings to come at $0.81 a share, 28% below the result a year ago. Moreover, the revenue came with a 46% surge to $1.124 billion, slightly below analysts’ expectations.
Despite the recent bearish pressure from the all-time high level, Shopify stock still has more than $500 profit since the beginning of 2021. Moreover, the company expects the current quarter to provide the largest share of revenue due to Black Friday and Cyber Monday shopping events. In 2020, the holiday session provided a $5.1 billion revenue.
Analysts currently expect that the Shopify revenue could climb 61% in 2021 with a 4% decline in earnings for 2022. Merchants and consumers have moved to online platforms that pushed Shopify to benefit from the pandemic. Moreover, the recent bullish pressure from the $1285.00 support level during the holiday season is a sign that investors are likely to see an upside pressure in the Shopify Stock ahead of the full-year report.
Let’s see the upcoming price direction from the Shopify Stock (SHOP) technical analysis:
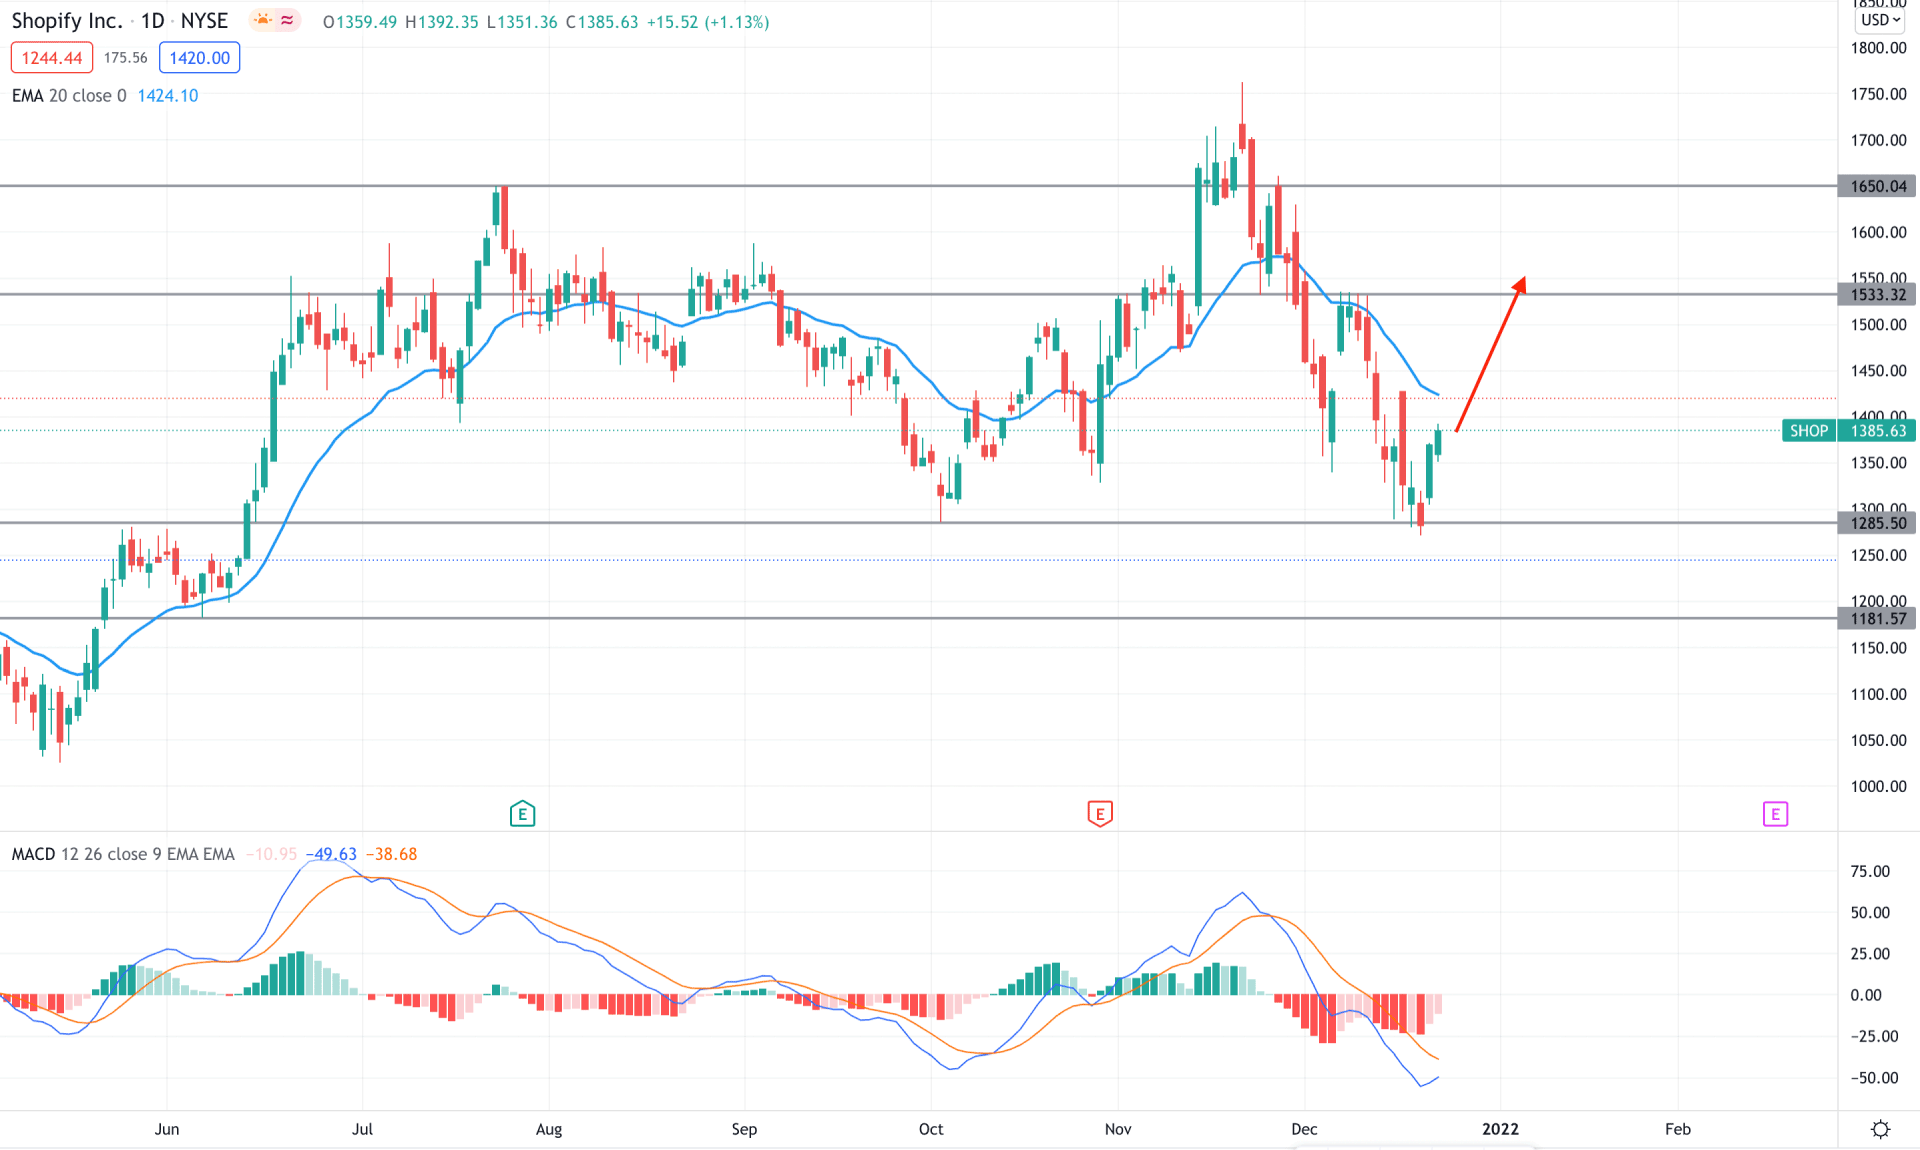
Shopify stock remained corrective in recent months, where the broader market direction is still bullish. Moreover, the bullish break of structure above the 1650.00 swing high and testing the all-time high at 1762.92 is a sign that bulls are still interested in this instrument, and might reopen their position soon.
The above image shows how the MACD Histogram loses its bearish power and moves to the neutral zone while the MACD line is below the Histogram. However, the dynamic 20 EMA is above the price and acts as an activeΩ resistance. Therefore, investors should closely monitor how the price reacts to the dynamic resistance. A bullish break and daily candle close above the dynamic 20 EMA would increase the bullish possibility towards the 1522.32 resistance level.
Based on the daily context, bulls have a higher possibility of taking the price in their direction. Still, selling pressure from the dynamic 20 EMA and a bearish daily candle below the 1285.00 static level would increase the bearish possibility towards the 1181.57 area.
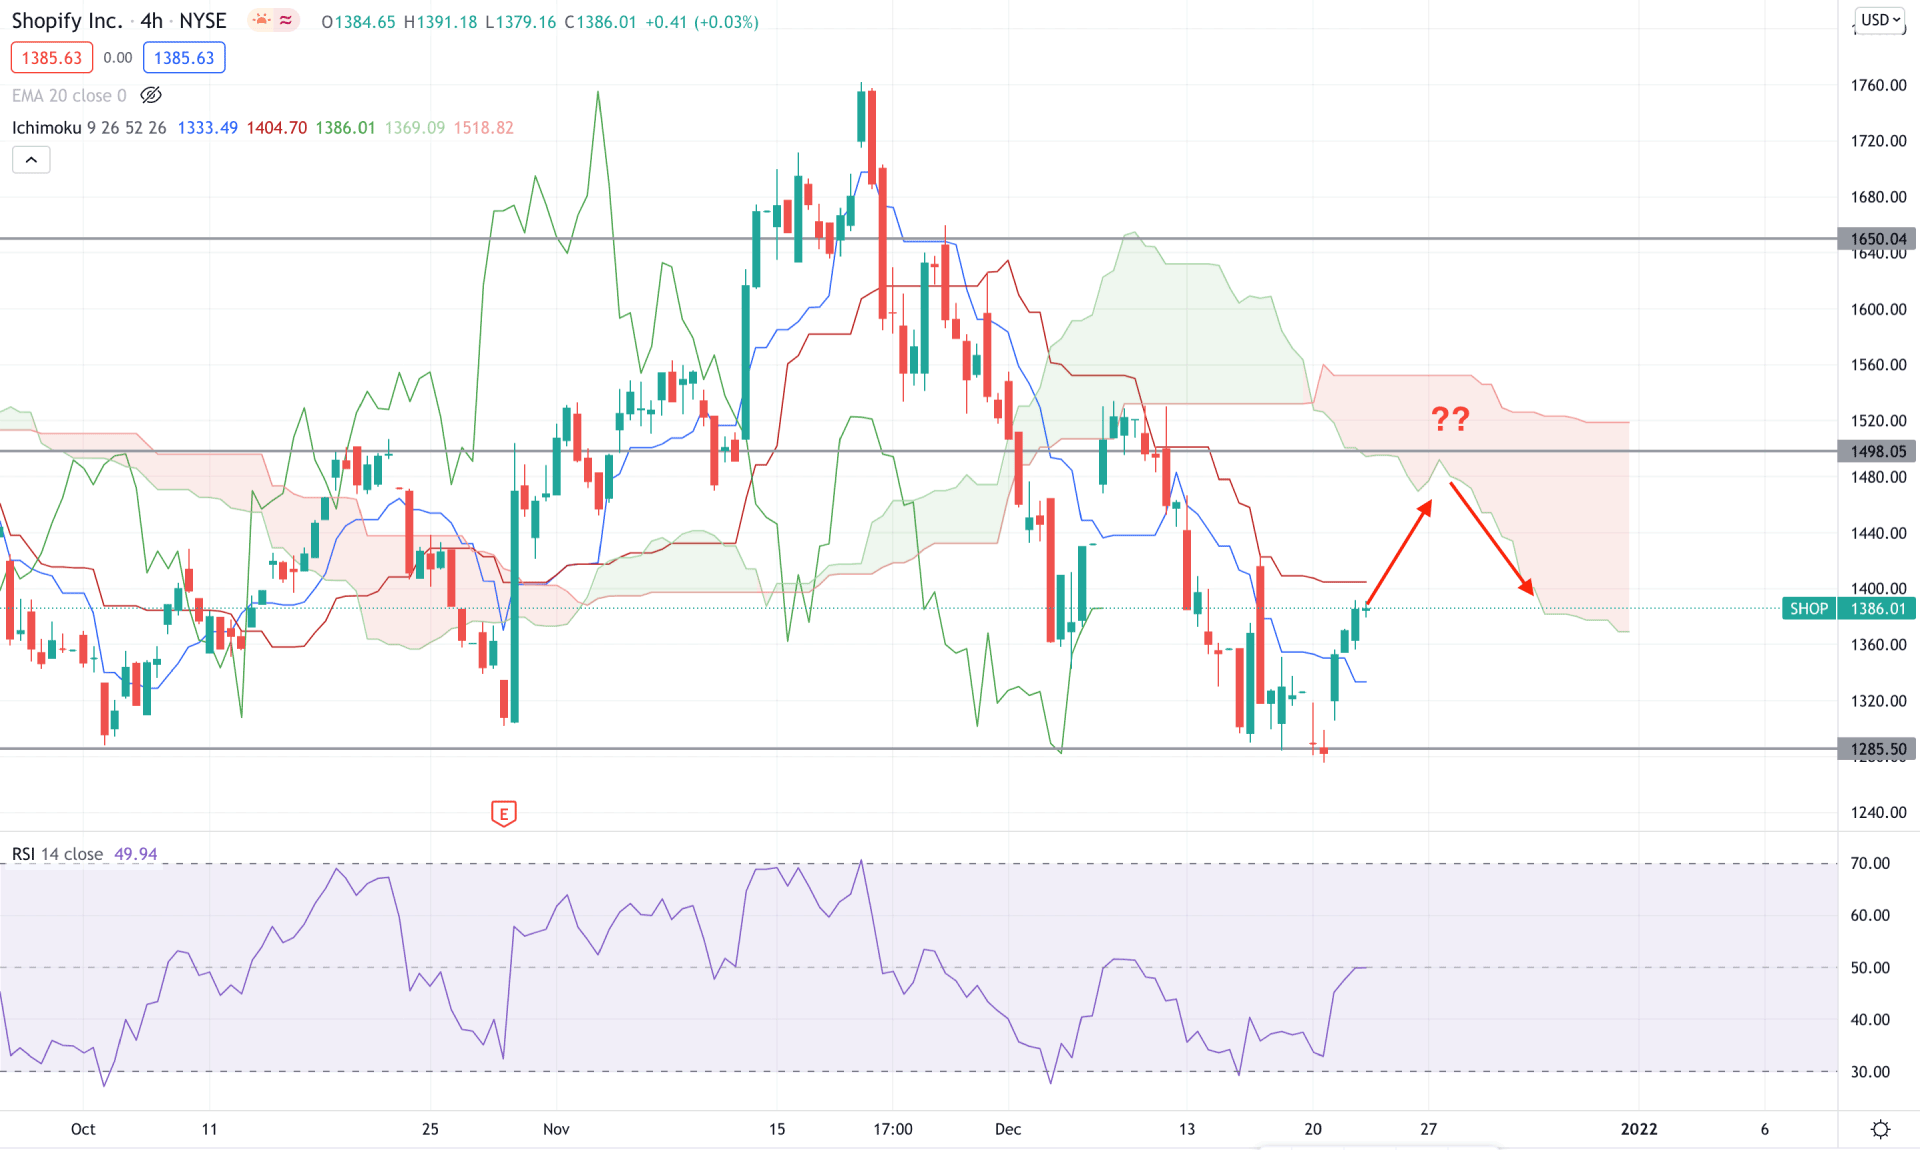
Although the price context in the higher timeframe is bullish, the H4 price is still below the Cloud resistance. Moreover, in the future cloud, Senkou Span A is below Senkou Span B and aiming lower, which is a sign of intense selling pressure in the price.
The above image shows that the RSI line formed a divergence with the price swing and aimed higher. Moreover, as the recent RSI level moved up from the oversold 30 level it is likely to move higher and test the 70 level. Meanwhile, the dynamic Tenkan Sen failed to hold the price as a minor resistance where the current price is between the Tenkan Sen and Kijun Sen.
Based on the H4 context, a bearish rejection from dynamic Kijun Sen would increase the selling pressure towards the 1285.00 area where a bullish break above the 1500.00 level is important to rely on the upcoming bullish pressure in the price.
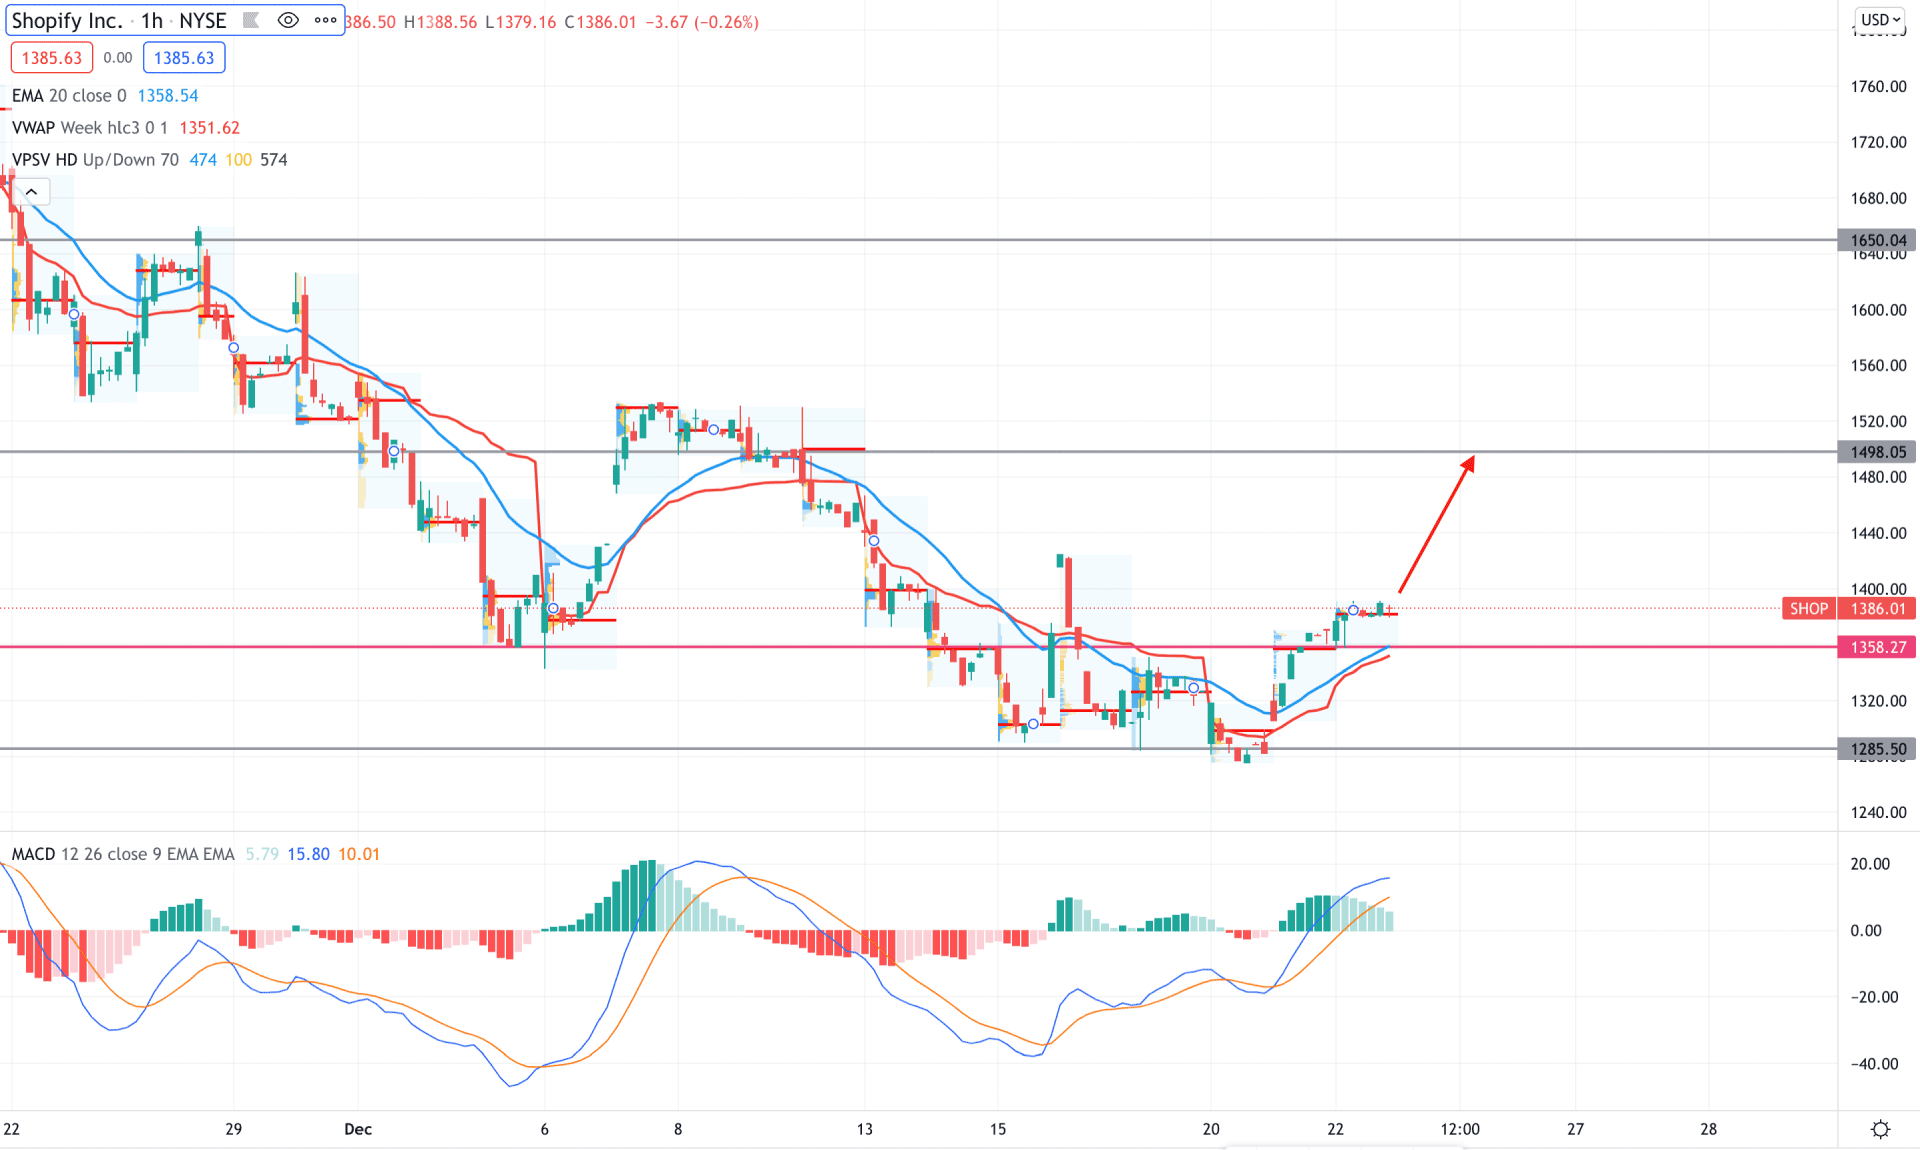
In the intraday chart, Shopify stock showed a bullish momentum as the price shifted its position above the dynamic 20 EMA and static 1358.27 event level. Moreover, the current price is hovering above the most recent high volume level of 1381.63, which is a sign of a strong buyer’s presence.
The above image showed that the MACD Histogram remained bullish while the dynamic 20 EMA and weekly VWAP is below the price. Therefore, as long as bulls hold the price above the dynamic VWAP, it is likely to extend the buying pressure towards the 1500.00 resistance level. On the other hand, a bearish pressure with an H4 candle below the 1358.27 level would increase the selling pressure towards the 1285.00 area.
As of the current observation, any intraday buying pressure above the 1400.00 level would signify strong buyers’ presence in the price. In that case, the primary target of the bullish run would be towards the 1533.32 level. However, the buying possibility will be invalid if the price moves below the 1285.00 level with a bearish H4 close.