
Published: April 17th, 2020
There are many altcoins that show some strong growth over the course of the past few months. This tendency is likely to continue, especially if we look at the Bitcoin Dominance weekly chart.
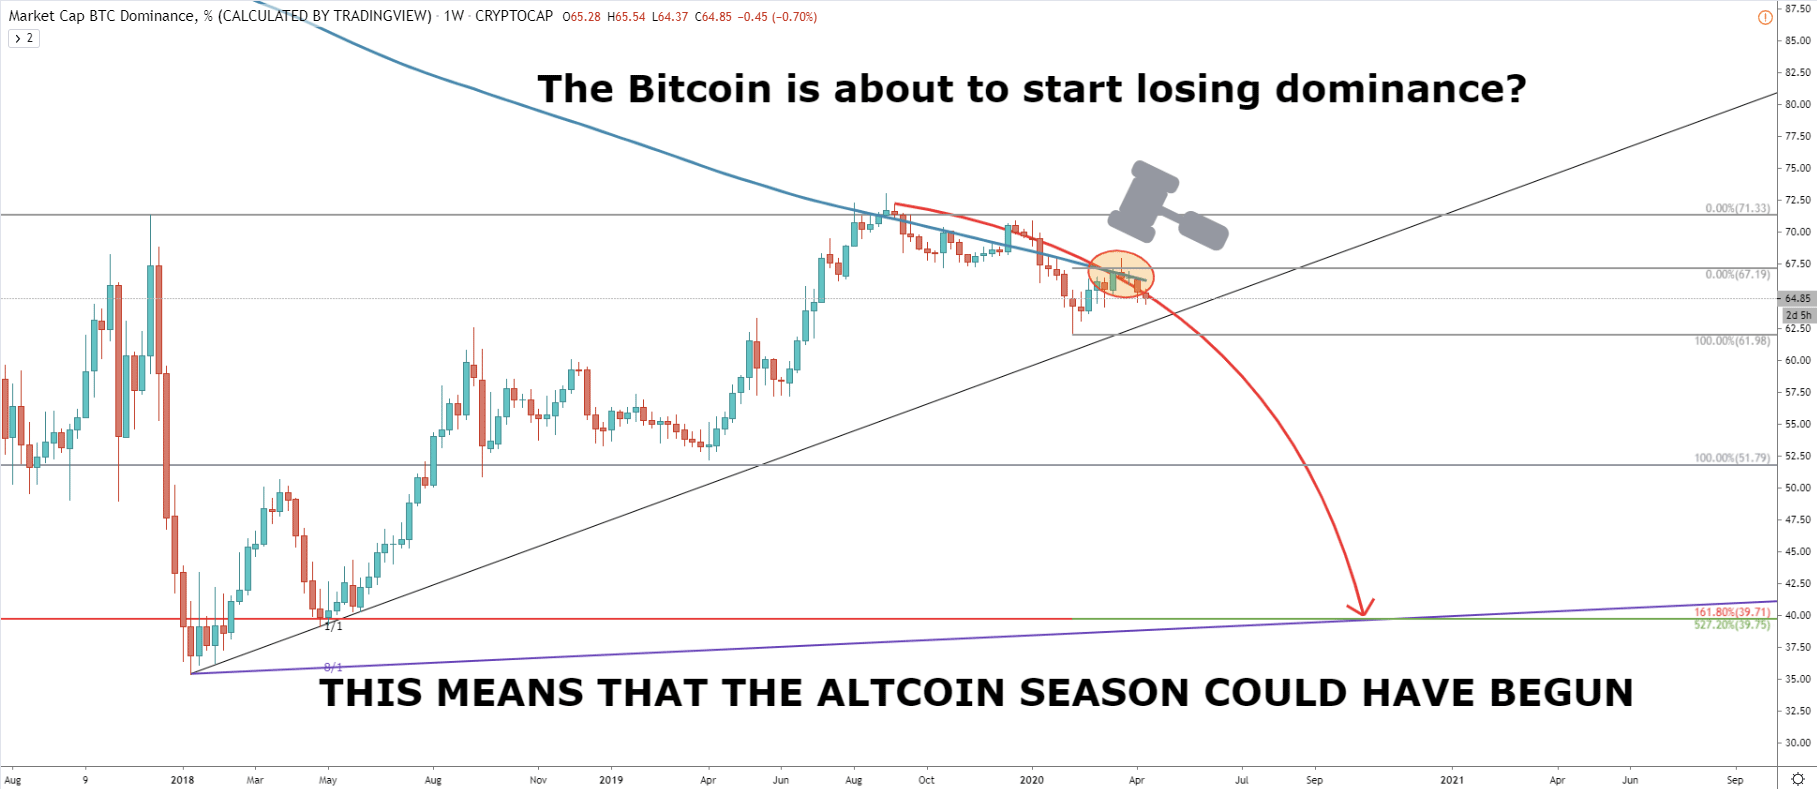
You can see, that when BTC.D has topped out, it also rejected the 200 Simple Moving Average. The price action during the past month shows that 200 SMA has been rejected once again. This suggests that Bitcoin might be about to start losing dominance in the long run, and if this scenario will come true, Altcoins could flourish. Based on our analysis, BTC.D is expected to drop down to 40%, which can only be compared to the 2017 Altcoin Season. Will we see the same growth on the crypto market once again? No one knows, but it is possible. In today’s’ analysis lets observe Monero vs USD, one of the few cryptocurrency pairs which have shown good results during the past several months.
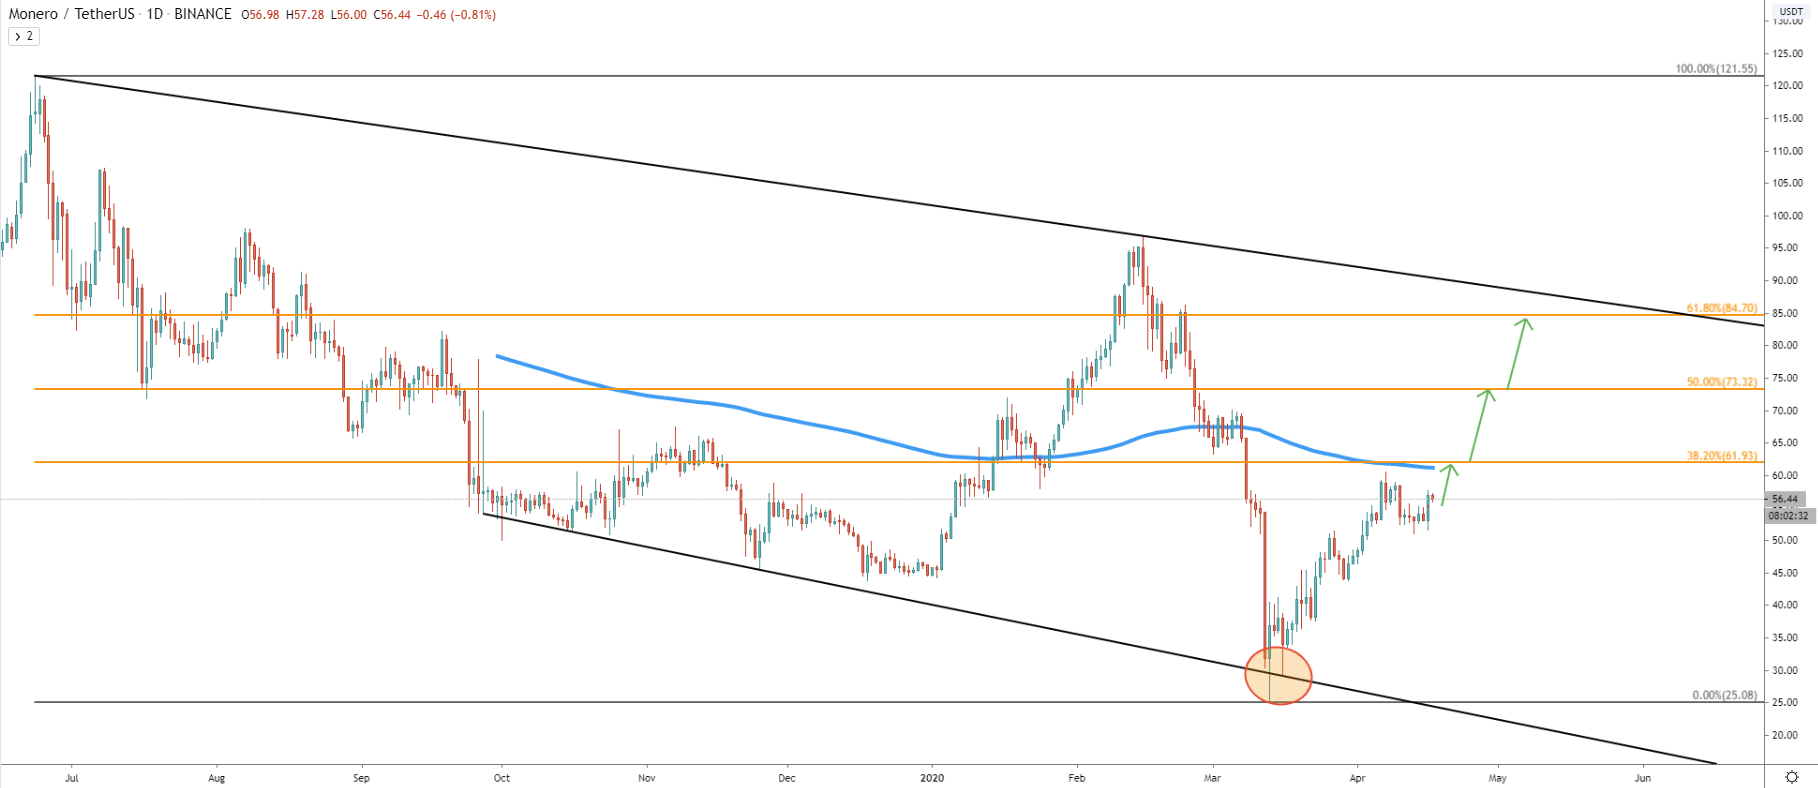
The daily chart brings to our attention the rejection of the downtrend support trendline in March 2020. First, the price produced the spike below but then rejected the trendline cleanly. Since then Monero has been rising steadily and moved from $25 low, up to the current price which is $56. This is a huge 100% growth in a matter of just a few months. It is hard to say how long the uptrend will be valid, but we can see some key resistance levels to watch for a rejection or the breakout.
Fibonacci applied to the overall downtrend shows that the nearest resistance is at 38.2% Fibs, which is a $61.90 level. This seems like the most important level, as it corresponds to the 200 Exponential Moving Average on a Daily timeframe. If/when this resistance is broken, there might be a huge long-term buying opportunity presented on XMR/USDT.
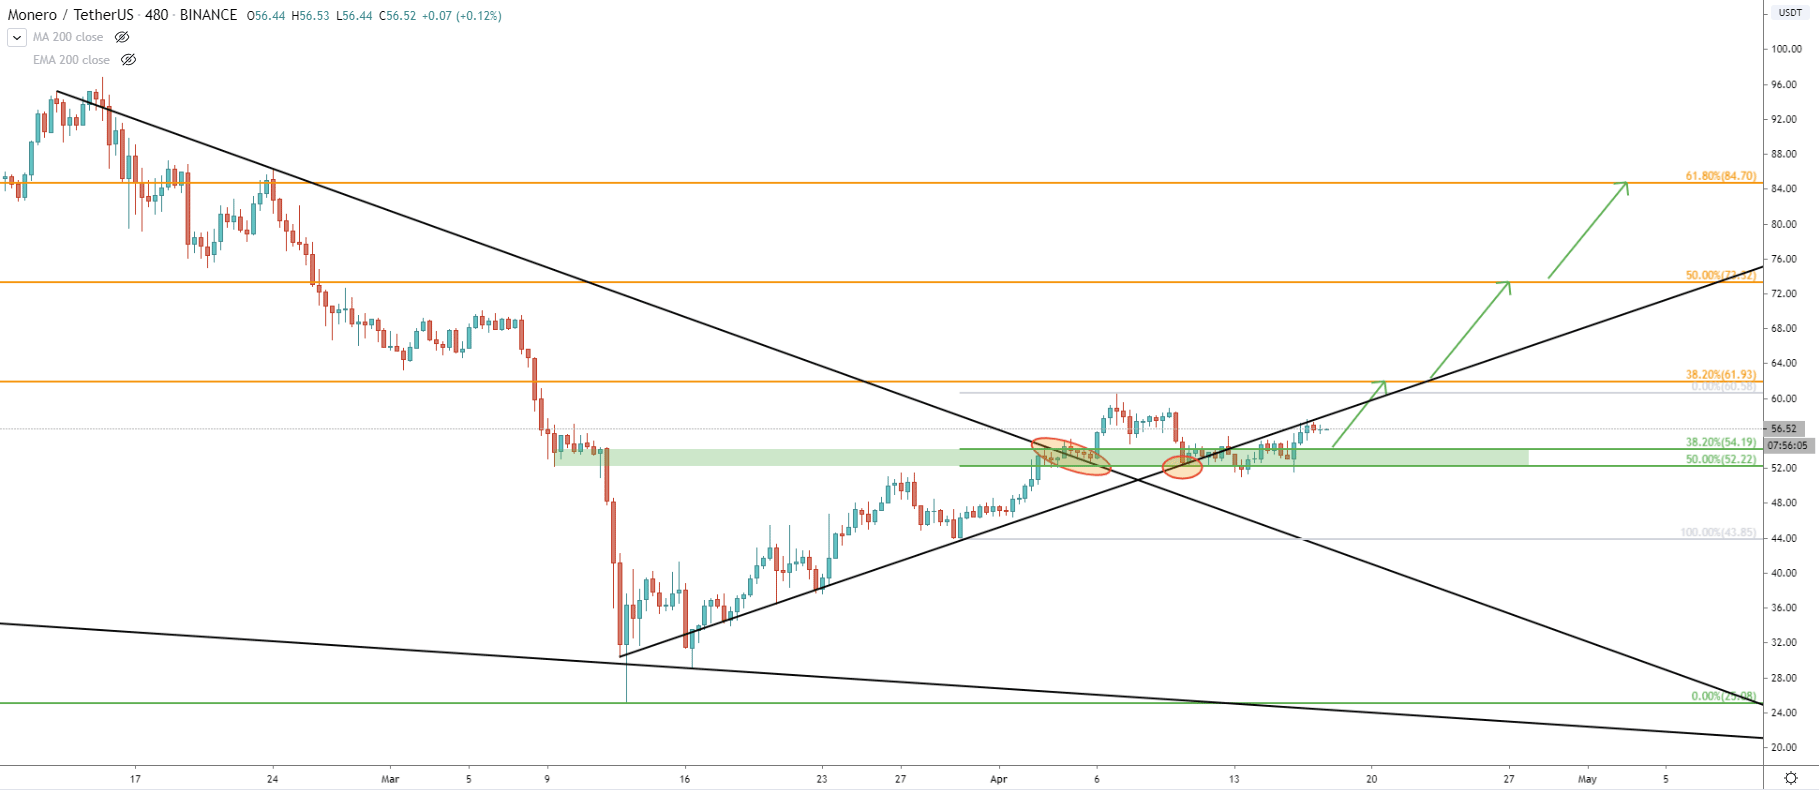
On the 8H chart, Monero has broken above the downtrend trendline, corrected down and rejected the uptrend trendline. Fibs applied to the last wave up shows that there is a strong support area formed between $52 and $54. Up until now, the support area has been rejected and the price slowly starting to move up. While we can still expect XMR/USDT to re-test the support, it already starts to look quite bullish in the short term.
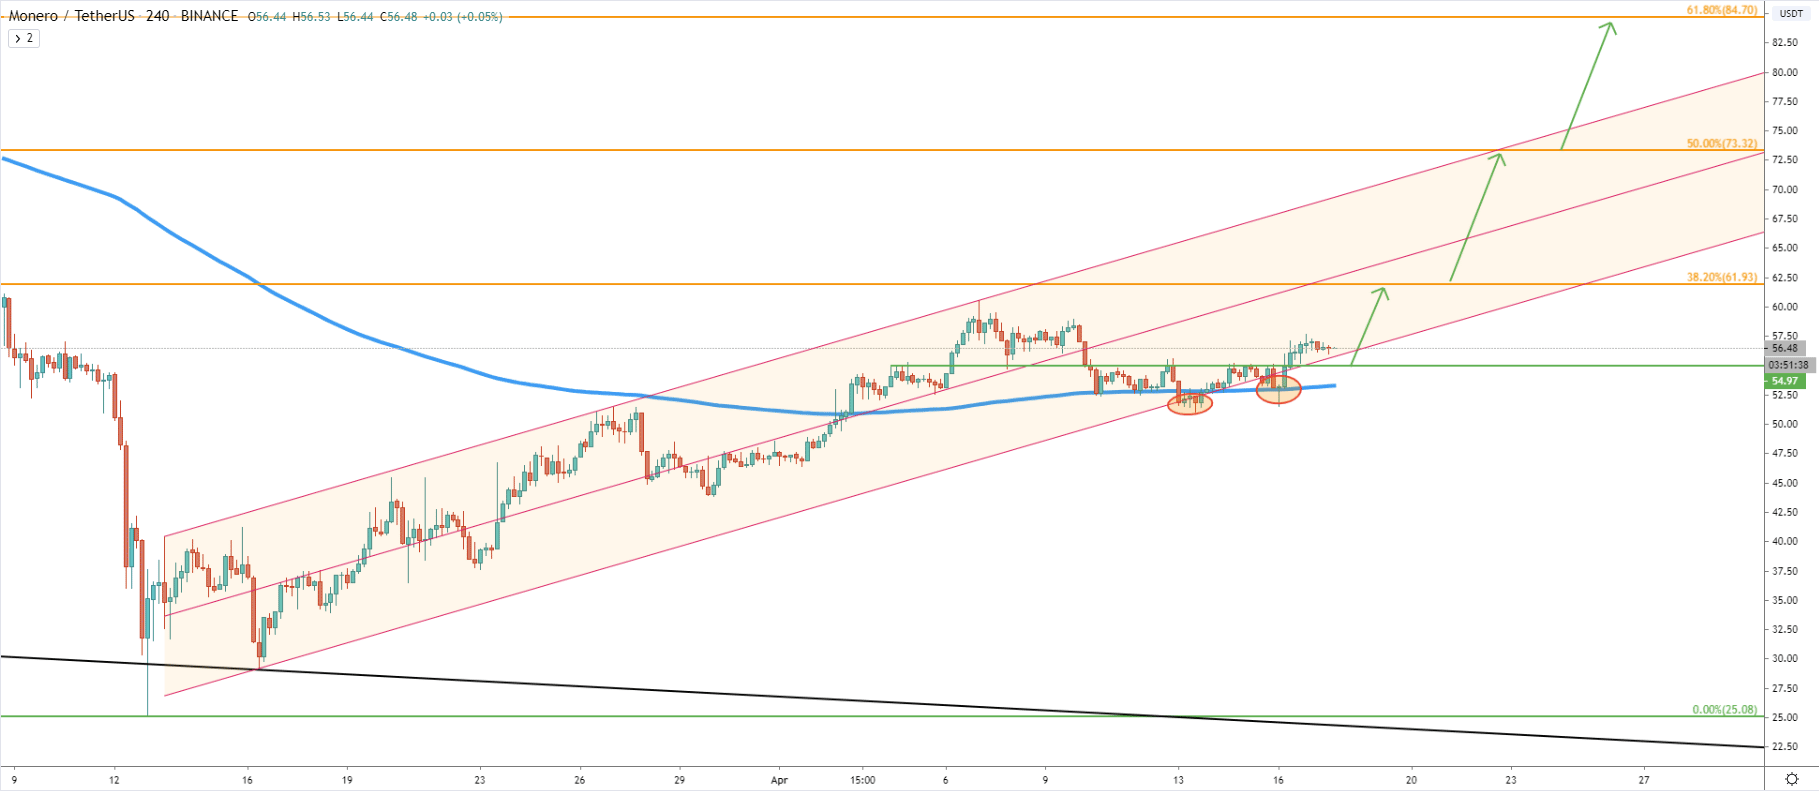
On the 4H chart, we can see that price continues to move within the ascending channel. Just recently, it has reached and rejected the lower trendline of the channel. Then the price went up, corrected down, and rejected the 200 EMA. Currently, Monero started to produce higher highs and higher lows, which is the first sign of bullish domination. Therefore, the next wave to the upside may not be too far away.
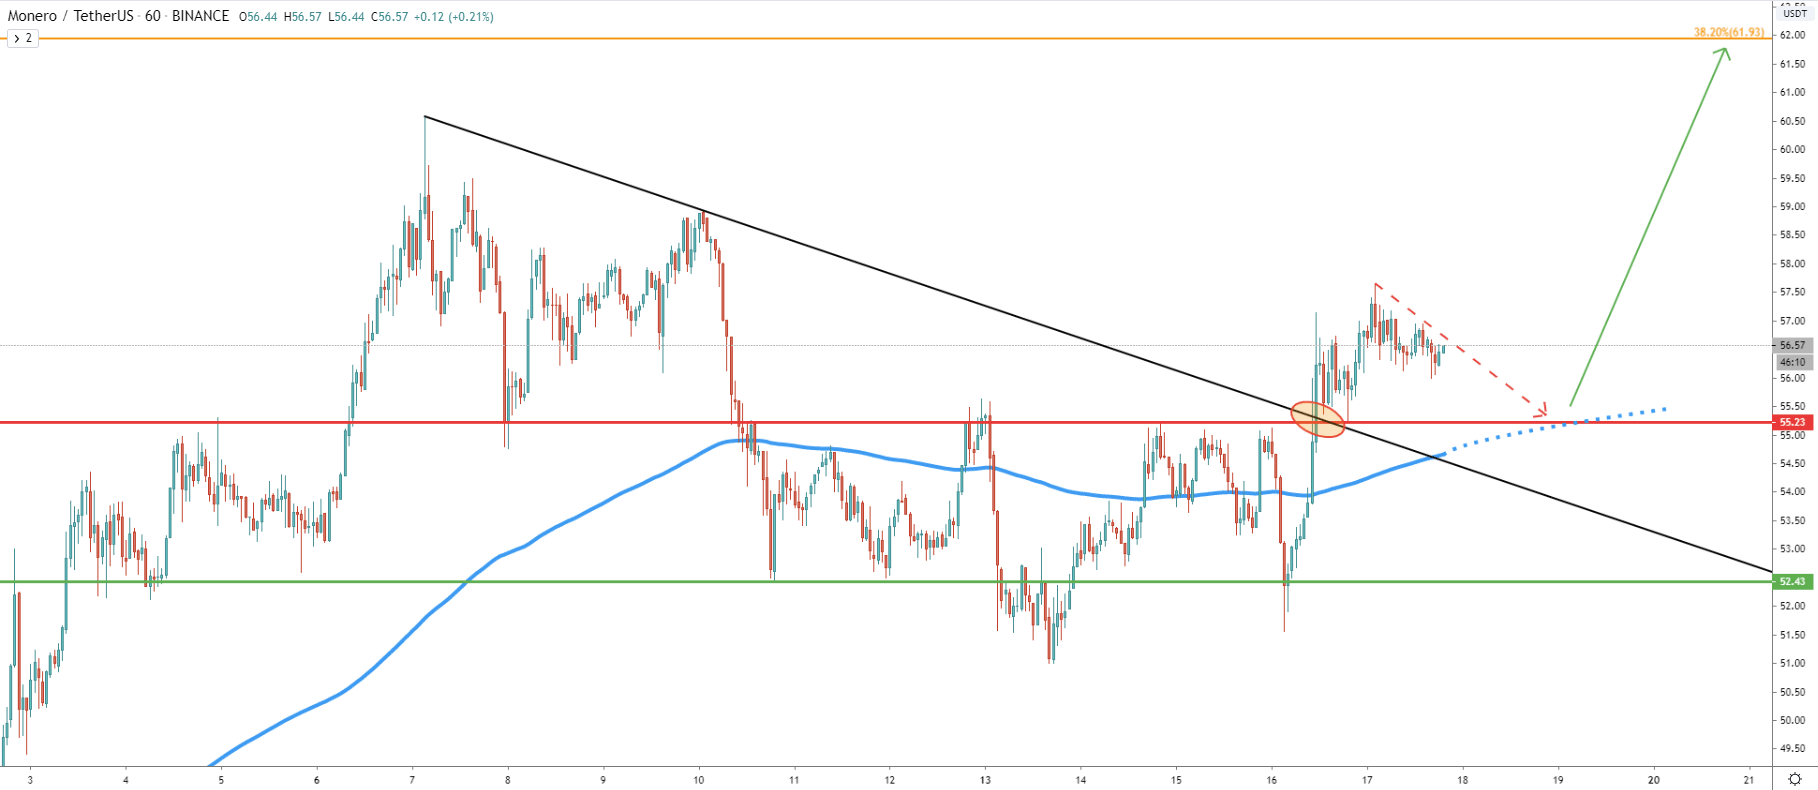
The final chart we’ll look at is on the 1H timeframe. Here price broke above the downtrend trendline, also suggesting further growth. But at the same time, before/if the price will produce a strong move up some consolidation for several days is quite possible. Potentially, price could still move down to re-test the 200 EMA, and only then move to the upside.
Monero, along with some other Altcoins could be about to initiate a long term uptrend. Maybe it is at the very early stage before we’ll see explosive growth. Currently, XMR/USDT is trading at a very attractive buying area, which can stimulate further growth within a short period of time.
There are 3 main upside targets, all of which are based on the Fibonacci retracement levels as per the Daily chart. First is $61.93, second is $73.32 and the third is $87.70.
To understand the probability of a downtrend, perhaps it is best to look at the 1H chart. It shows a very strong support area near $55, which also corresponds to the 200 EMA. Only break and close below this price could invalidate a bullish scenario. But final confirmation would be a break and close below the $51 level as per the 8H chart.
Support: 52.22, 54.19, 54.97, 55.23
Resistance: 61.93, 73.32, 84.70