Published: June 10th, 2021
Most of the top-tiered cryptocurrencies moved down over the past weeks, and there is no expectation for XRP.
There is no specific reason for the bearish pressure in the cryptocurrency market, but the major push came from China’s crypto crackdown last month. Further agitation came from a couple of weeks ago when Mr. Elon Musk announced that Tesla would not accept Bitcoin as a payment method.
XRP started the year with a favorable price development, coming from digital tokens via Telegram. Therefore, analysts were expecting a price surge like ADA or Dogecoin. However, the sentiment changed from the Ripple vs. SEC case, but everything is still favorable for the XRP.
After that, the investors’ sentiment focused on the crypto crash where there is no sign of rebound until today. Can Sellers take the XRP price below the 0.6469 event level?
Let’s see the future price direction from the XRP technical analysis:
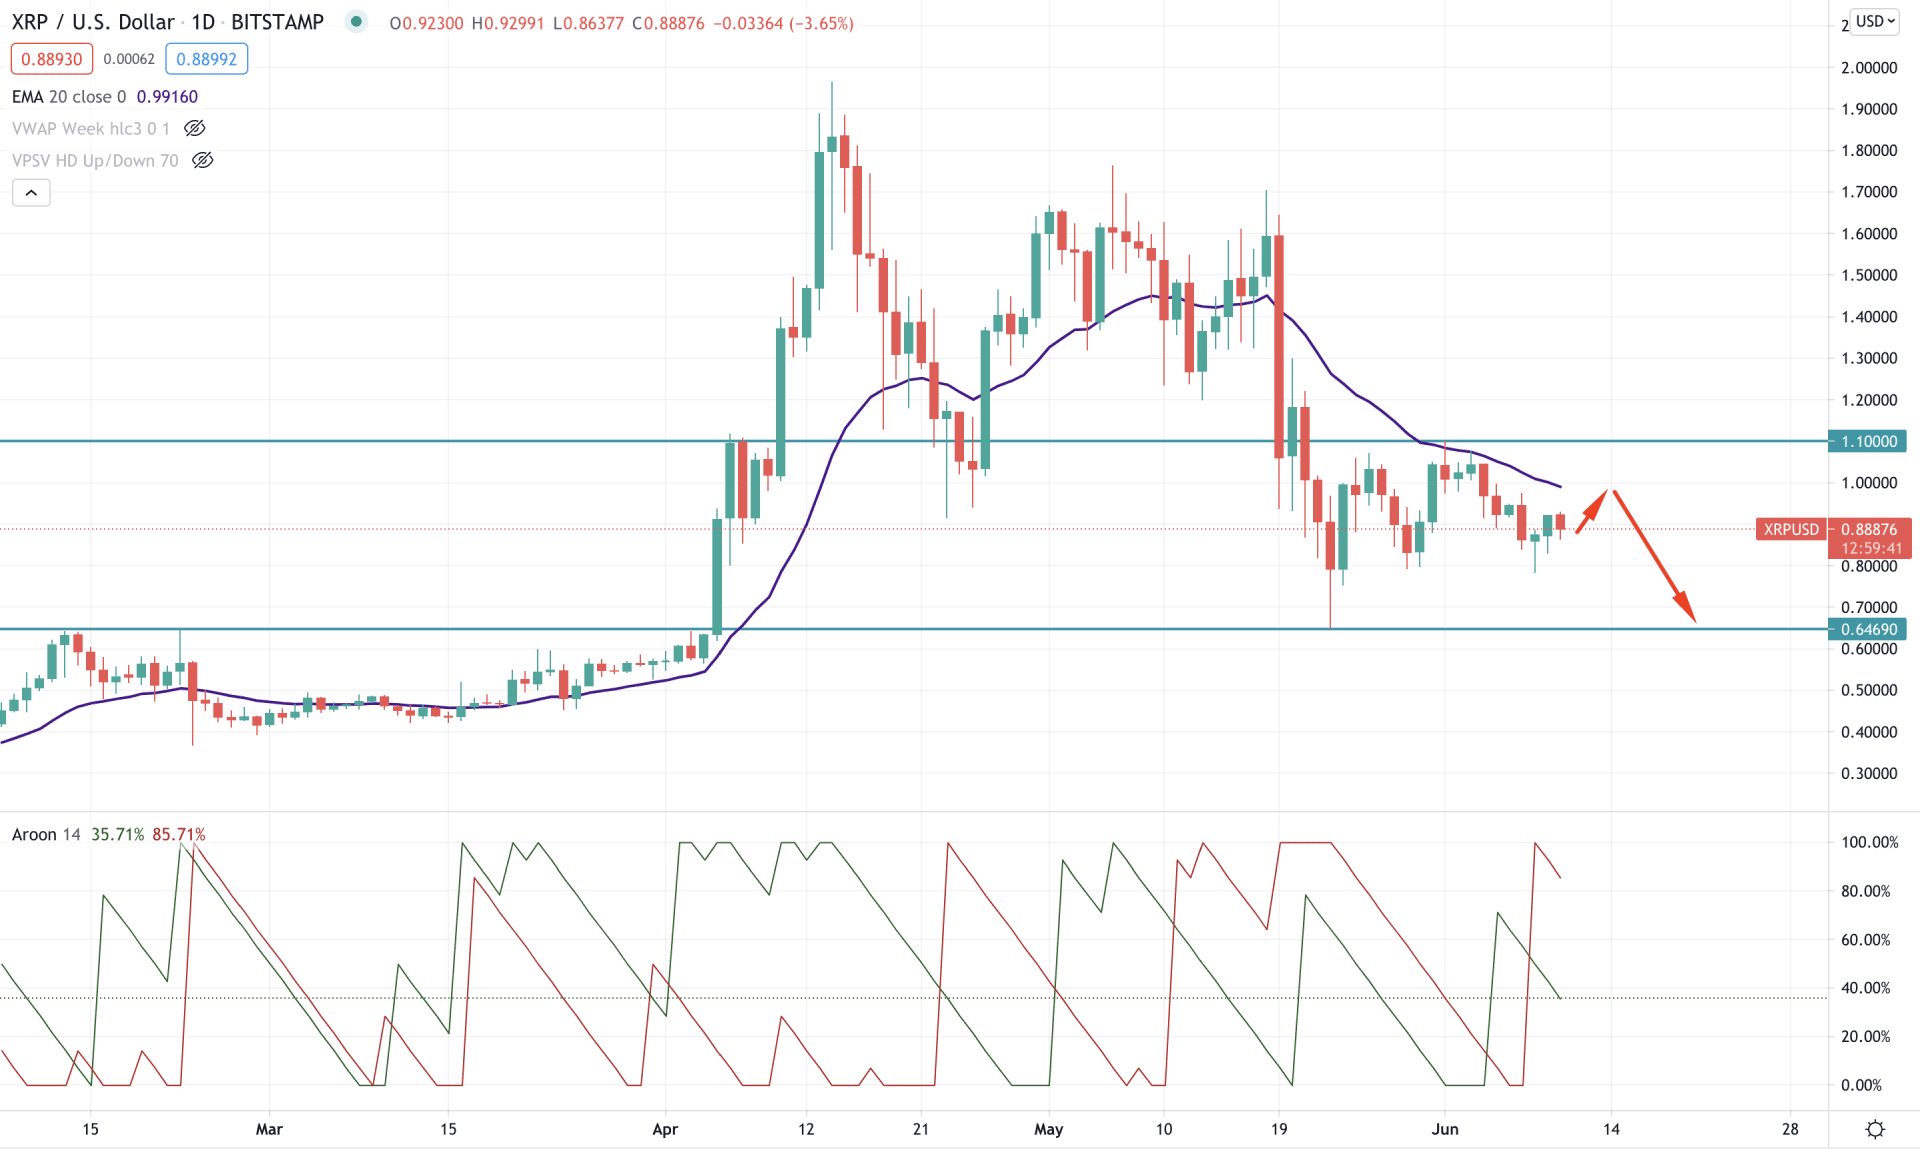
Ripple’s XRP started to move higher as soon as 2021 began, where the price reached the multi-year high at the 1.9496 level in mid-April. Later on, the price became volatile but held a strong position above the 1.100 level.
However, the price crashed below the 1.100 level on 19th May and started to consolidate. Therefore, the current price is trading below the 1.100 level, and it may move lower towards the 0.6469 level in the coming days.
In the above image, we can see the daily chart of XRP where the price is consolidating below the 1.100 level. Moreover, the dynamic 20 EMA is above the price and providing resistance. Therefore, any bullish rejection from the dynamic 20 EMA would increase the upcoming bearish possibility in the price.
On the other hand, Aroon Down (red line) crosses over the Aroon Up (green line) in the indicator window, which signifies the bearish trend. Moreover, Aroon Up reached 100 levels, indicating that the bearish trend has been established.
In this market context, any bullish rejection from the dynamic 20 EMA would take the price down towards 0.6469 event-level in the coming days. However, the bearish market sentiment is valid as long as the price is trading below the 1.00 level.
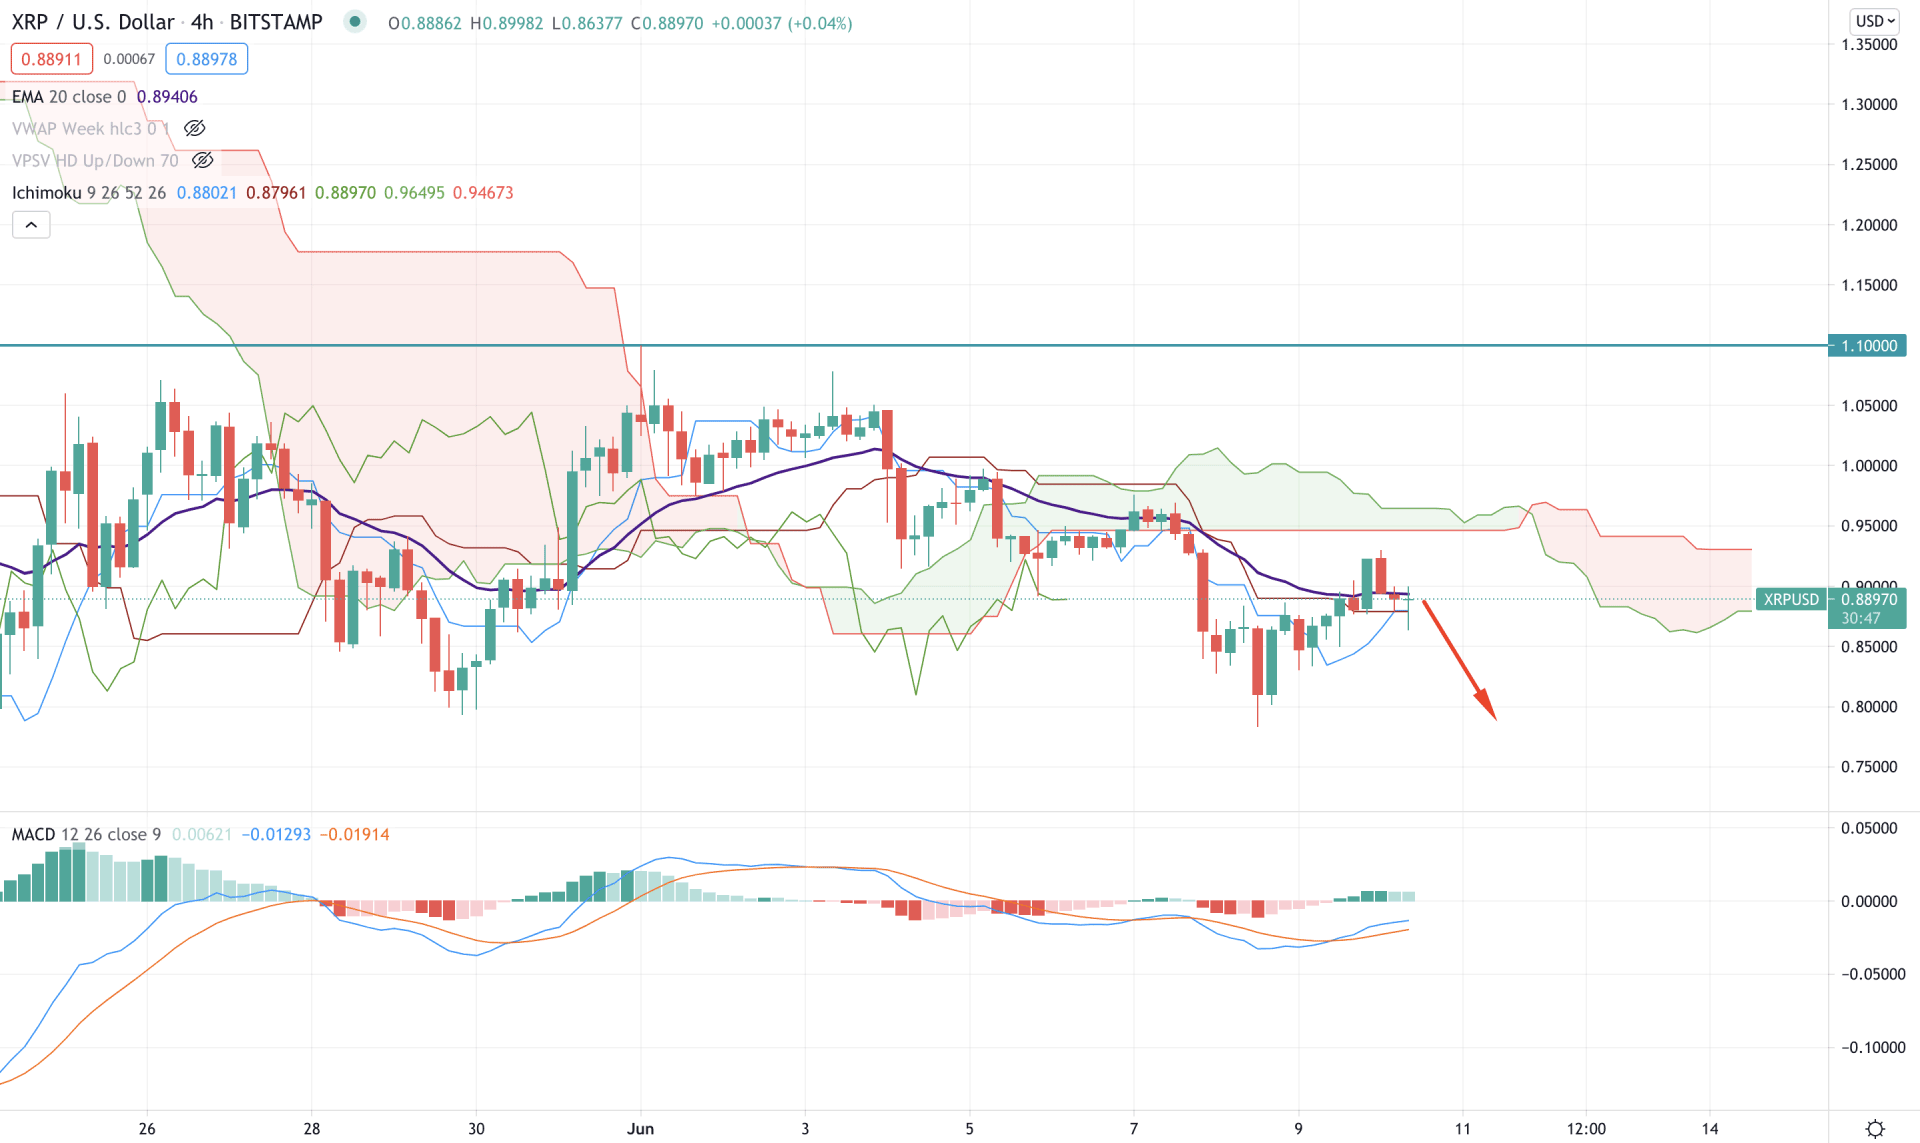
According to the Ichimoku Kinko Hyo on the H4 chart, the price was trading below the Kumo Cloud and made a new low. However, the current price is above the flat Kijun Sen, indicating that sellers need another push to continue the bearish pressure.
Moreover, the Senkou Span A is below the Senkou Span A in the future cloud, and Chikou Span is below the price.
The above image shows the H4 chart of XRP where the price is near the dynamic 20 EMA and Kijun Sen. However, the overall price since 5 June is below the Kumo Cloud. Therefore, any strong bearish H4 close below the Kijun Sen may continue the current bearish pressure where the primary target would be 0.800 support.
On the other hand, MACD is still bullish where Histograms are above the zero lines. Therefore, the price may move higher towards the Kumo Support level at 0.9500 and start consolidating. Any strong bullish H4 close above the 1.00 resistance will make the current scenario invalid. In that case, the price may move higher towards the 1.10 level.
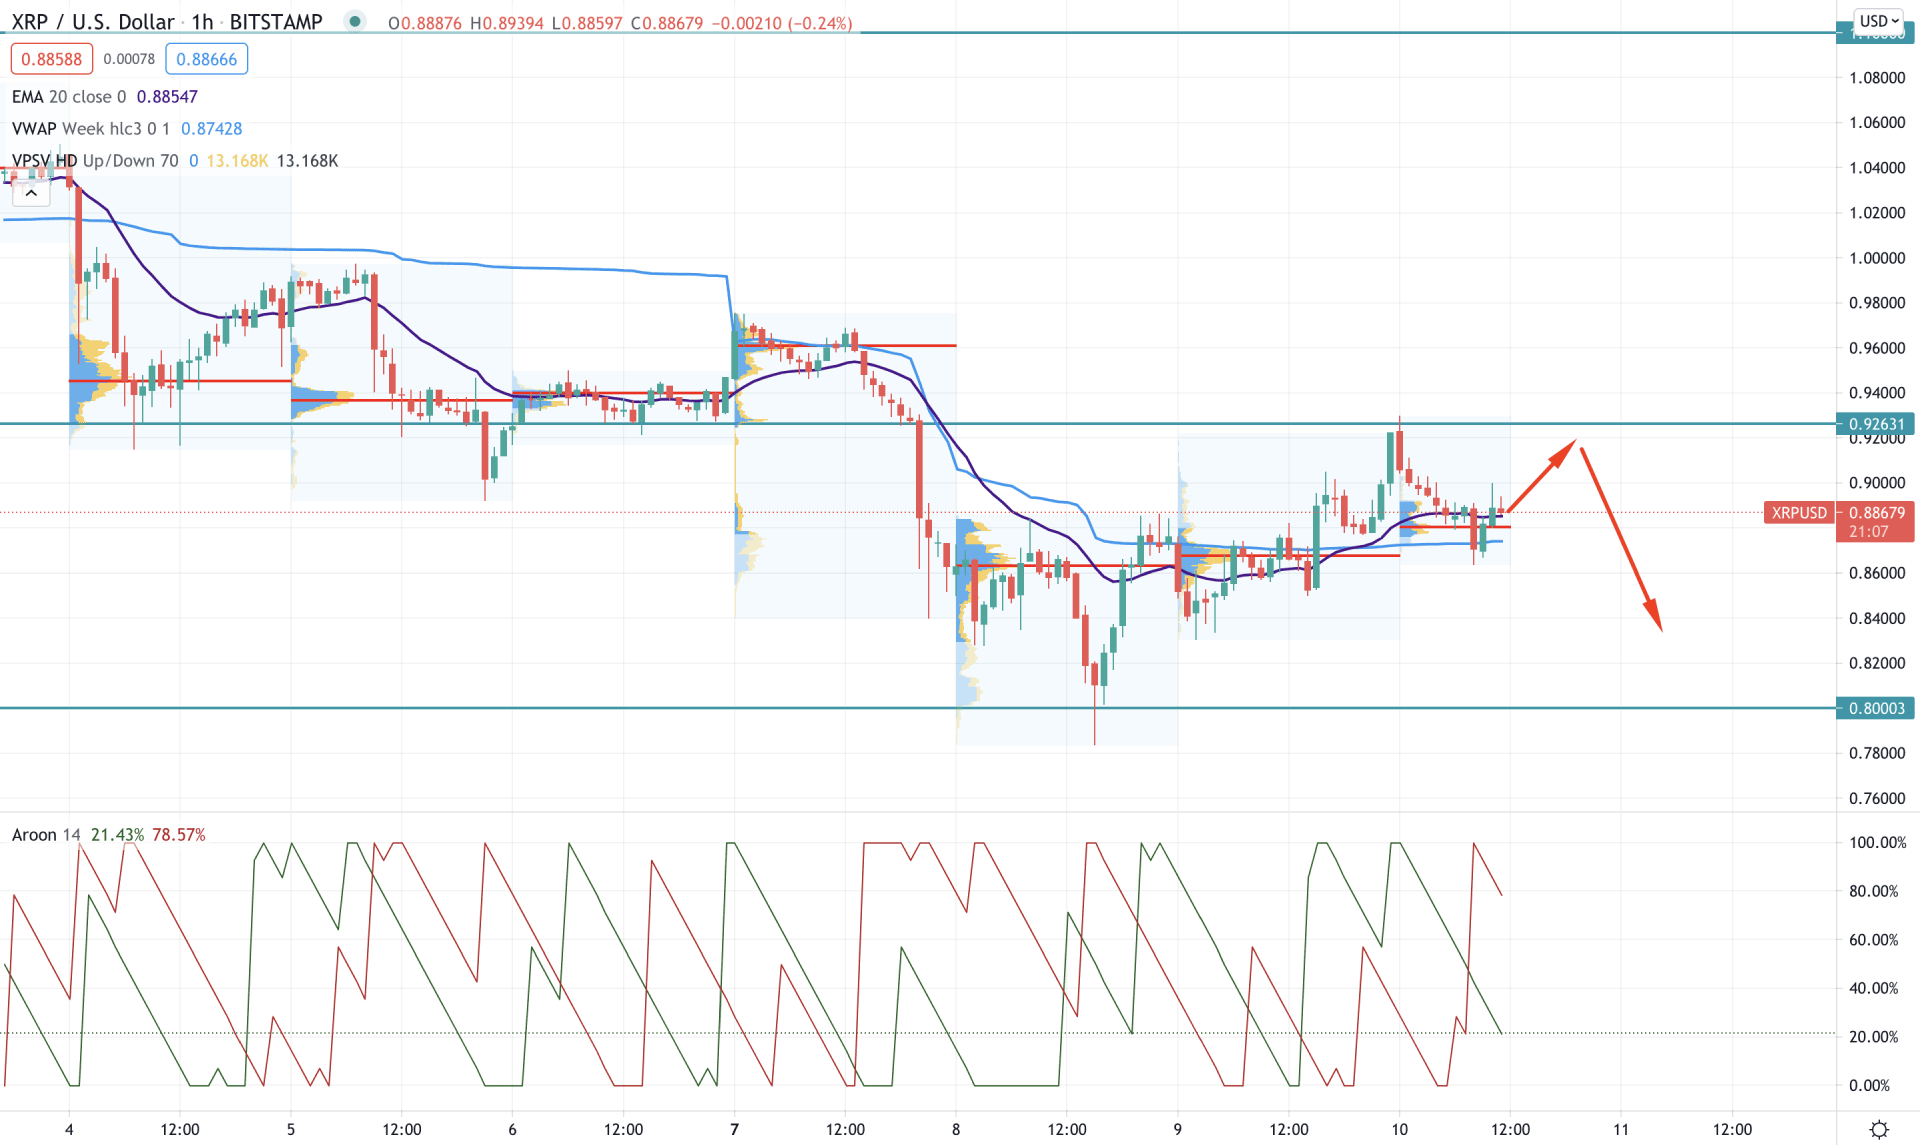
XRP is correcting higher in the intraday chart as the price rejected 0.800 level with multiple higher highs in the intraday high volume level. Therefore, the price has a higher possibility of testing 0.9261 event level in the coming session.
In the above image, we can see that the current price is above the intraday high volume level of 0.8852, where the dynamic 20 EMA and vwap provide support to the price. Therefore, as long as the price is trading above the dynamic vwap level, the intraday sentiment will be bullish.
However, In the indicator window, Aroon Down (red line) is above Aroon Up (green line) and residing at 100 level, which signifies that sellers are still controlling the trend. In that case, any strong H1 close below the dynamic vwap would increase the bearish sentiment to the price where the primary target would be 0.800 support level.
As of the above discussion, we can say that XRP intraday selling pressure should come below the dynamic vwap to consider the current bearish trend as strong.
Overall, the price structure is bearish as long as it trades below the 1.00 level that may take the price lower towards 0.6469 event-level.
On the other hand, a strong bullish daily close above the 1.00 level may alter the current market structure that may resume the long-term bullish trend.