Published: April 6th, 2020
QTUM is a cryptocurrency with is in the top 100 by the coin market cap. Currently, it is ranked #41 by market capitalization with a total market cap of $133,010,271. This cryptocurrency has been around for quite some time and was monitored by many investors for an extended period of time. It is well-known crypto and you can read all the information about its’ features in multiple media channels.
But we are going to analyze the price action on multiple timeframes to understand the price potential of QTUM in the medium to long term. The title of this article says it all, QTUM could have reached the very bottom and finally price can be expected to reverse to the upside.
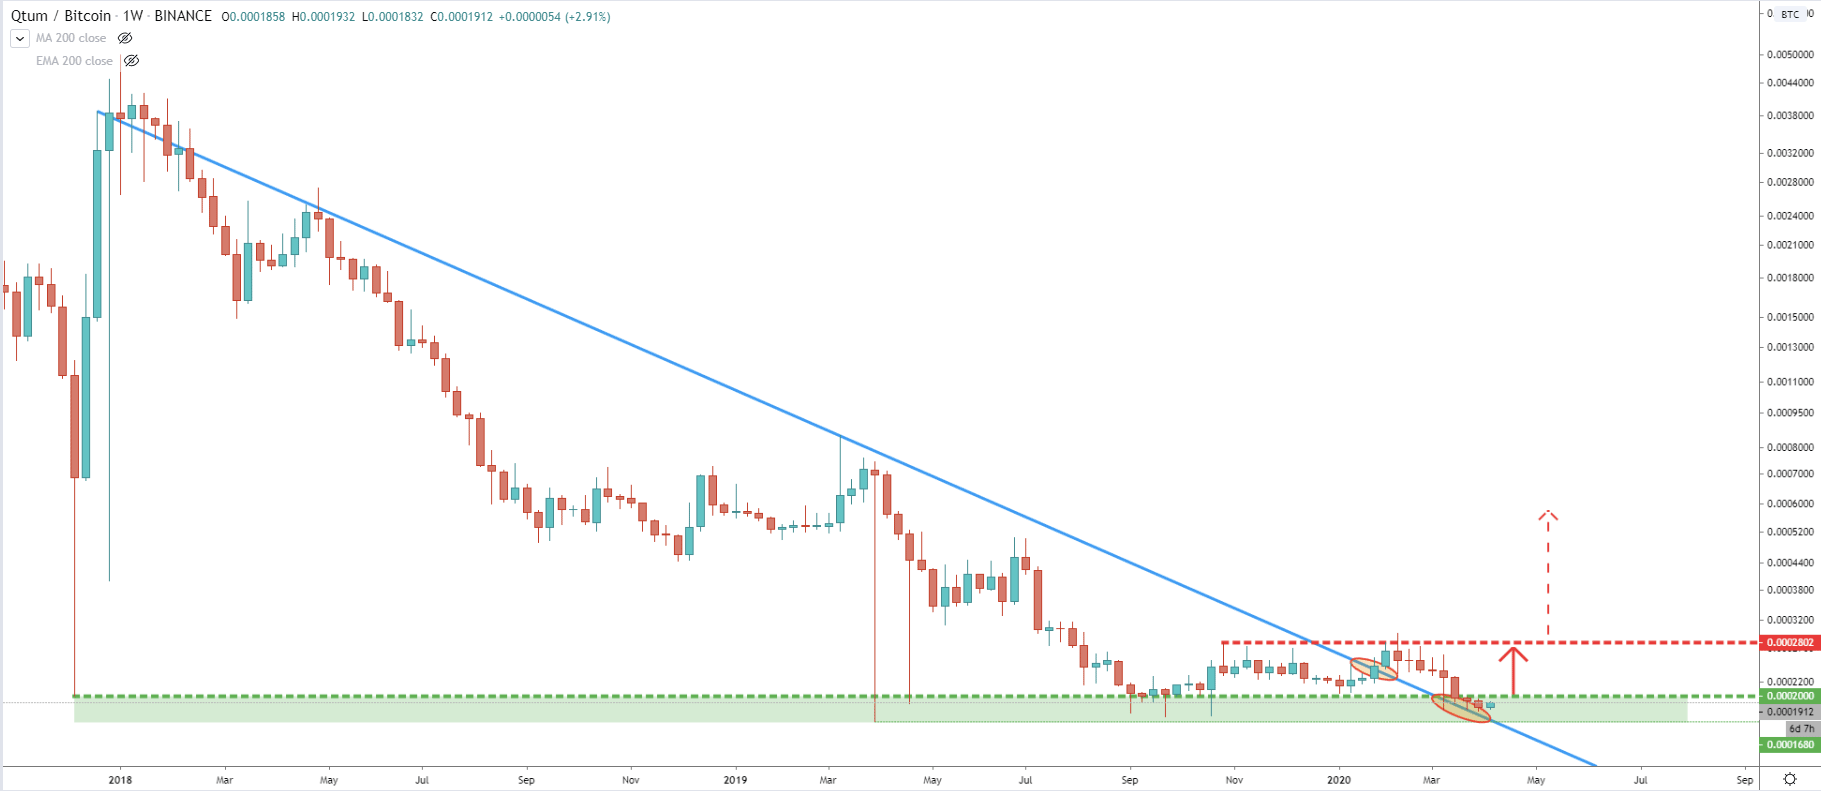
On the weekly chart, we might be witnessing a key turning point in QTUM/BTC trend. The long term downtrend trendline has been broken, after which price has returned back to the key support area near 0.00018 BTC. It seems that QTUM is still in the consolidation phase for the time being, as it stuck between 0.00028 resistance and 0.00018 support levels. Nevertheless, the downtrend trendline breakout is the first indication that it might start rising as long as the support area holds.
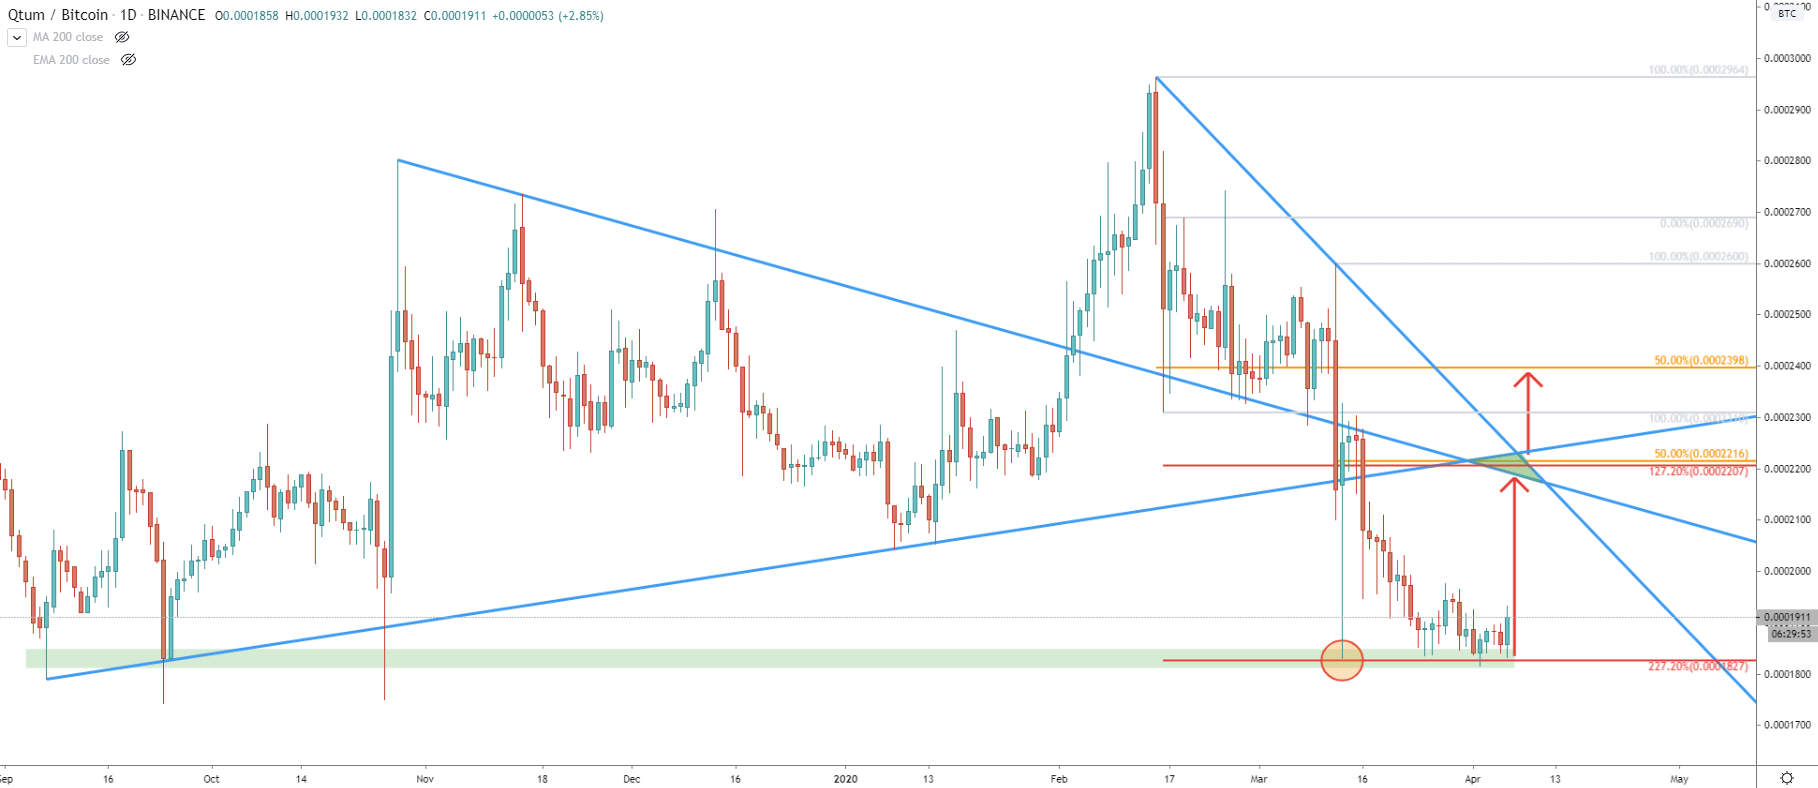
Next is the Daily chart which also shows great support near 0.00018 level. But what is interesting here, sit that after the breakout of the downtrend trendline on the weekly chart, the price has corrected down to 227.2% Fibonacci retracement level. It was rejected cleanly at first, but then price attempted to move lower, but only produced a spike below. This means that the 0.00018 support level is valid and QTUM/BTC could finally start rising.
In regards to the upside target, we can see that there is massive resistance formed near 0.00022. It corresponds to two Fibonacci retracement levels, first is being 50% and second 127.2%. At the same time, it corresponds to the triple trendline cross, two downtrend trendlines, and one uptrend trendline. It will be very interesting to see the price action around this resistance level, as it might give the signal of the change in the major trend, and can start pushing price up for the long term.
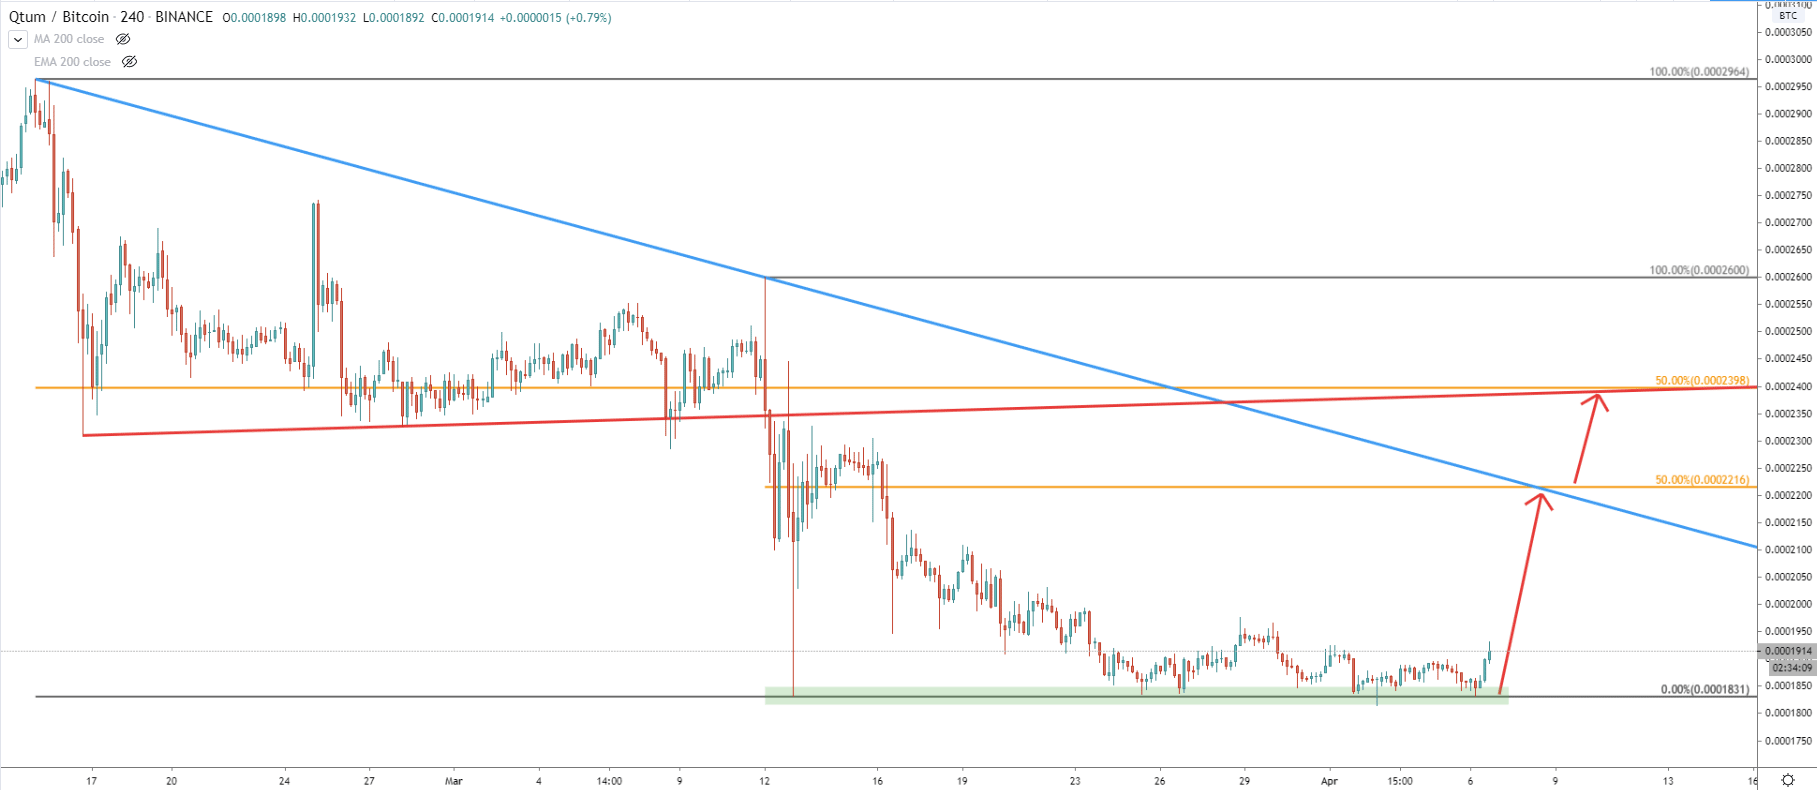
On the 4H chart, the red uptrend trendline corresponds to the second upside target which is 50% Fibonacci retracement level at 0.00024 BTC. Overall, we have two resistance levels to watch for the potential upside rally. The first is being 0.00022 and the second is 0.00024 BTC.
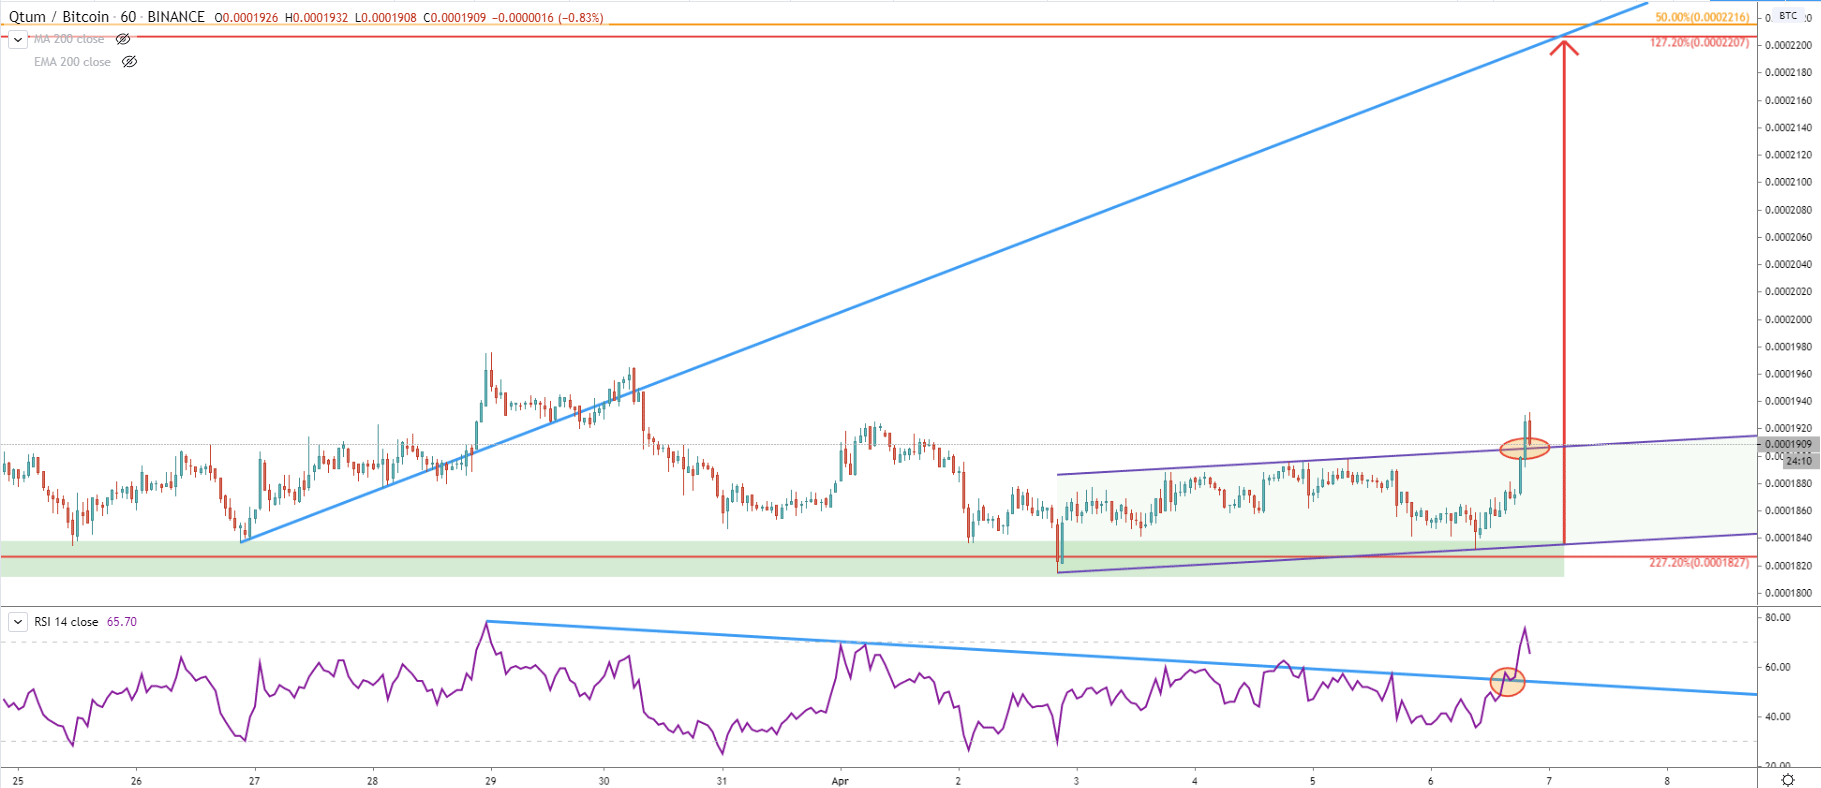
The final chart is on a 1H timeframe where price broke above the ascending channel. We can also see the RSI oscillator breaking above the downtrend trendline, indicating the change in trend. For the time being, the price can consolidate near 0.00019 BTC area, although the upper trendline of the ascending channel now should be acting as the support.
QTUM/BTC could be about to initiate a long term uptrend and we can be witnessing the very beginning of the upside move. The current price seems to be attractive in terms of investment opportunity as there is huge potential for QTUM growth.
0.00022, 0.00024
The only way downtrend will continue is only if Daily close will be below the recent low, formed at 0.00018 BTC. In this scenario, downtrend continuation will become very likely but at the same time, it might result in the extended consolidation for QTUM/BTC.
Support: 0.00018, 0.00019
Resistance: 0.00020