Published: September 2nd, 2021
PepsiCo has a strong root from 1989 when a pharmacist Caleb Bradham created this company and started offering beverages to customers. After 67 years, the company expanded the business into a combined cola and snacks company.
In the present world, Coca-Cola focuses on drinks and syrup, while PepsiCo offers a wide range of products to more than 200 countries around the globe. Last year, PepsiCo earned more than $70 billion with its brands- Gatorade, Pepsi-Cola, Quaker, Frito-Lay, and Tropicana. Despite the COVID-19 pandemic, PepsiCo maintained a strong position in the stock appreciation and held its position as an S&P 500 dividend aristocrat.
PepsiCo announced a 5% increase in the Quarterly dividend to $1.075 a share or $4.30 in an entire year. Therefore, the annualized payout of this company came at 2.7%, which is more than double of the S&P 500’s 1.31% on yields. The steady earnings growth with a stable dividend may make the PepsiCo stock an attractive investment opportunity to traders.
Let’s see the upcoming price direction from the PepsiCo [PE] technical analysis:
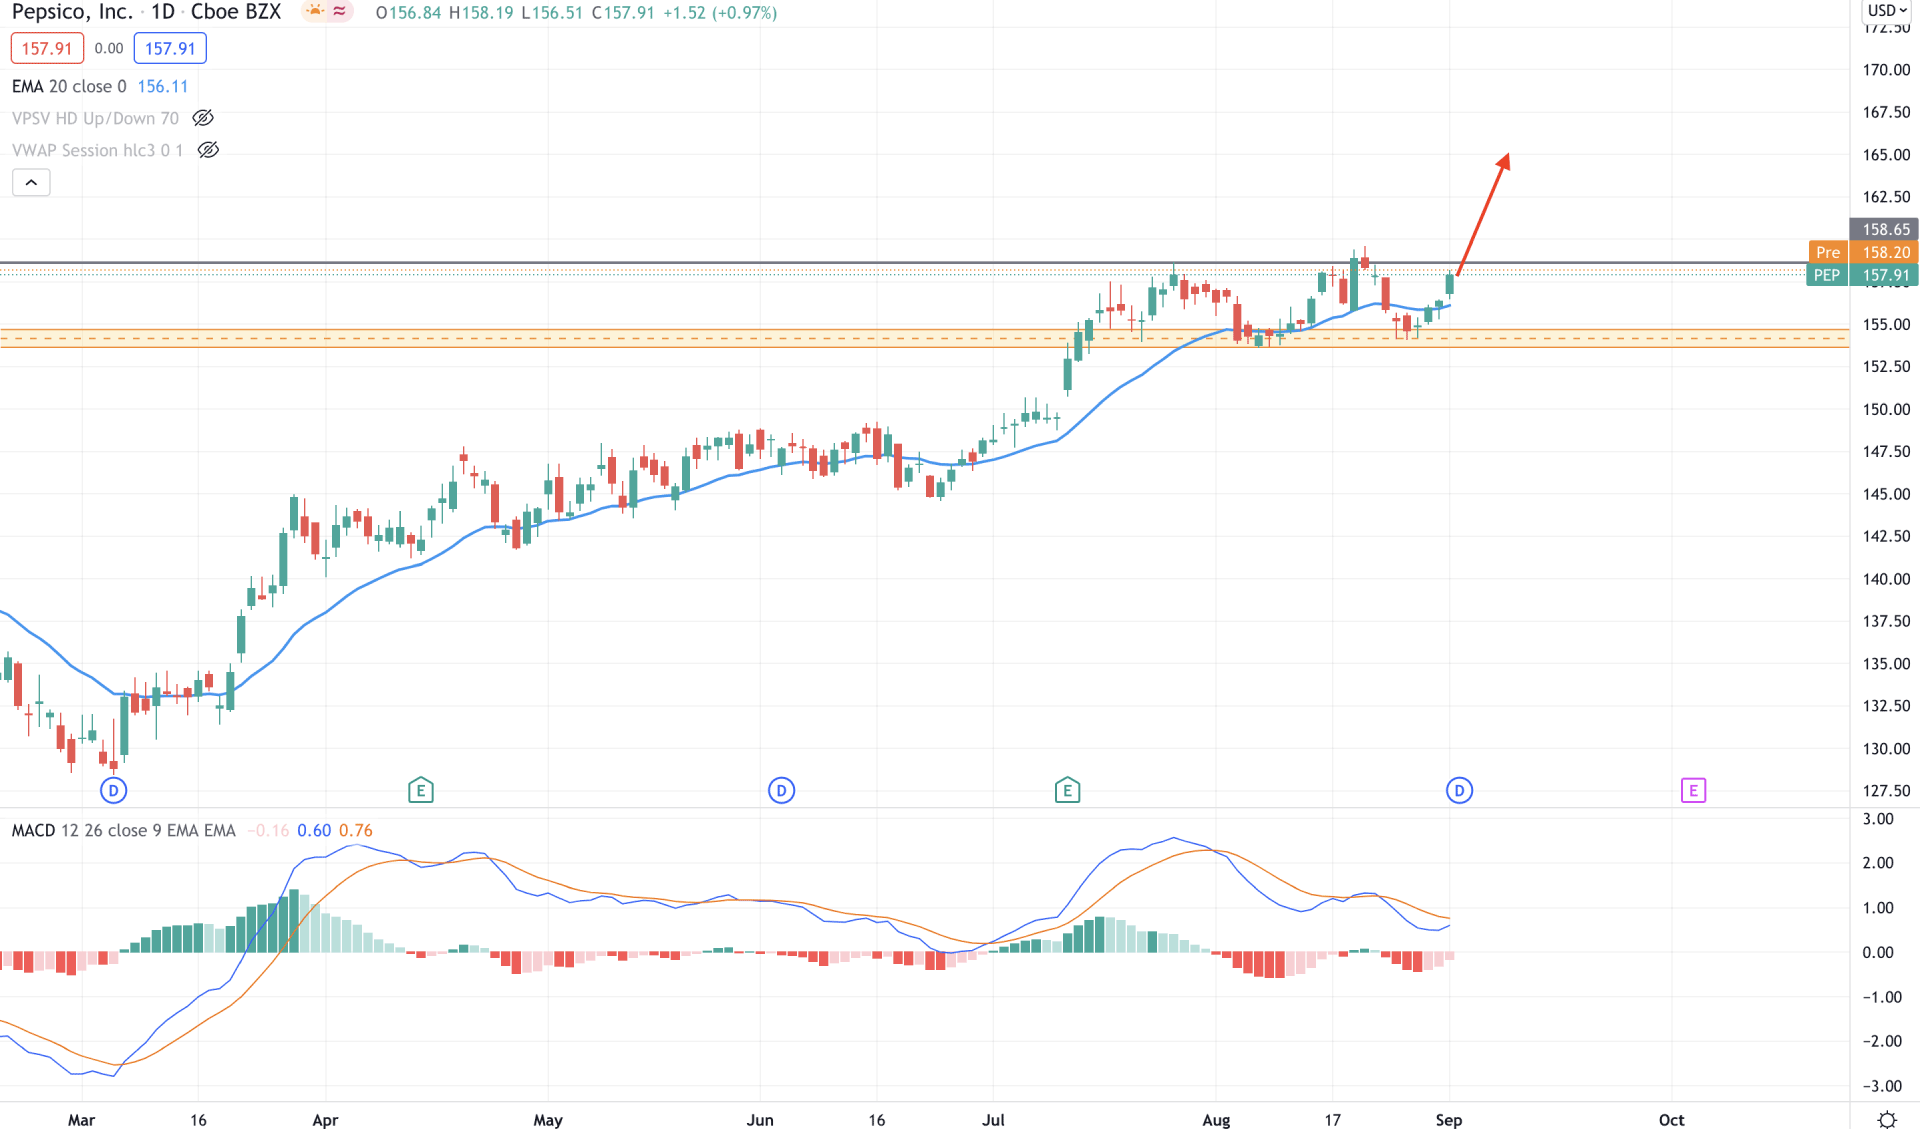
PepsiCo stock continued the bullish momentum from the 2021 low of 128.32 and made a new all-time high at 159.63 in mid-August. However, the bullish pressure halted as the price moved lower below the dynamic 20 EMA from the 158.20 level. Later on, the price broke the structure above the 158.20 level and came down to the 154.61 to 153.64 demand zone. In the current chart, the price moved above the dynamic 20 EMA from the most recent demand zone and aiming higher.
The above image shows how a daily candle closes above the dynamic 20 EMA. Moreover, the MACD line is above the Histogram in the indicator window while the Histogram is bearish and squeezing to zero levels. Therefore, as long as bulls hold the price above the 154.61 to 153.64 demand zone, the price may make another all-time high towards 170.00 the level.
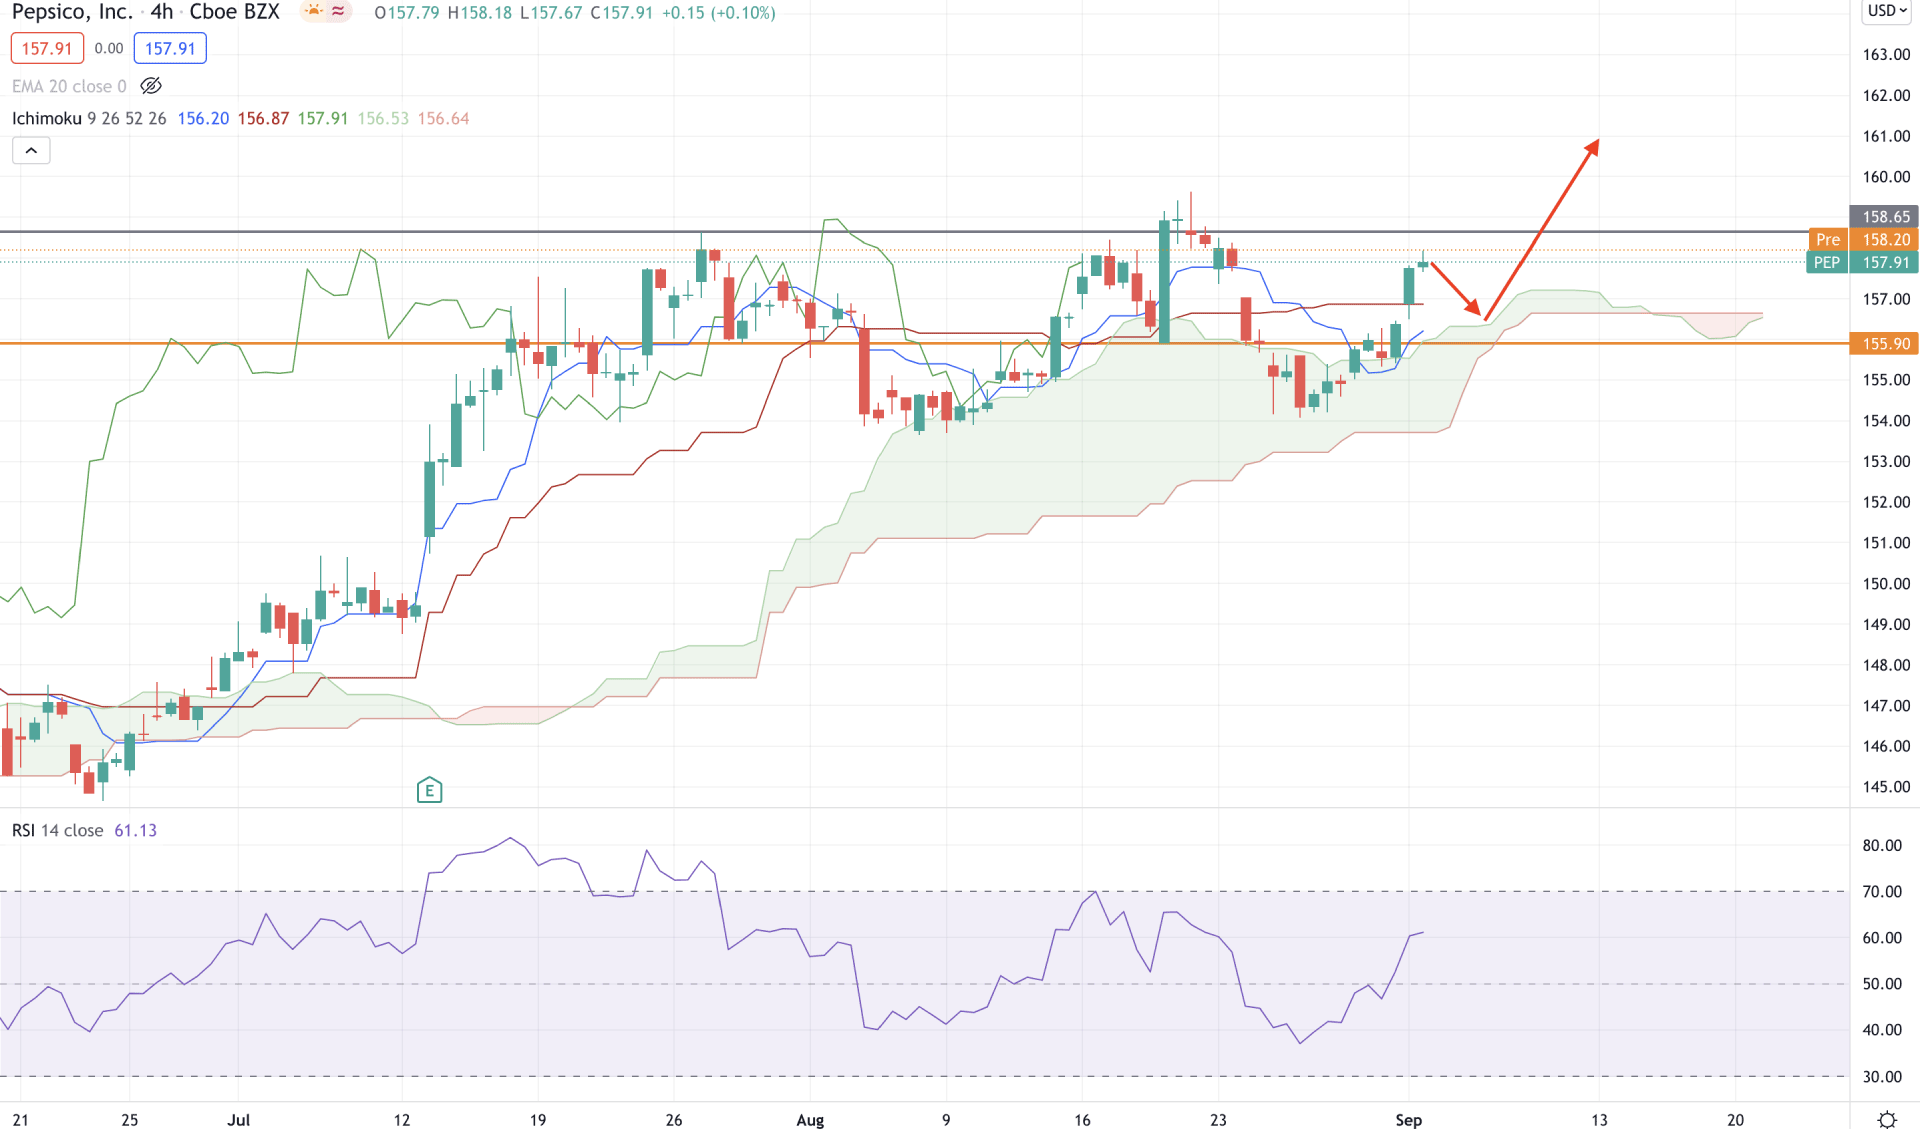
PepsiCo stock moved above the Ichimoku Kumo Cloud on 1 July 2021 and made a strong move towards the 158.65 level. Later on, the price corrected lower but failed to reach cloud support. However, the thickness of the future cloud is not solid, but the price got a stable movement above the 155.90 event level.
In the above image, we can see the H4 chart of PepsiCo Stock [PE], where the price is above the dynamic Tenkan Sen and Kijun Sen. Moreover, the Tenkan Sen is still below the Kijun Sen, which is a sign of a correction that may increase the bearish pressure towards 154.00 cloud support level.
However, the RSI lines are above 50 levels and pointing up towards the potential 70 levels. Therefore, a bullish H4 close above the 158.65 level with a bullish crossover in dynamic lines may initiate a long bull run towards the 170.00 psychological level.
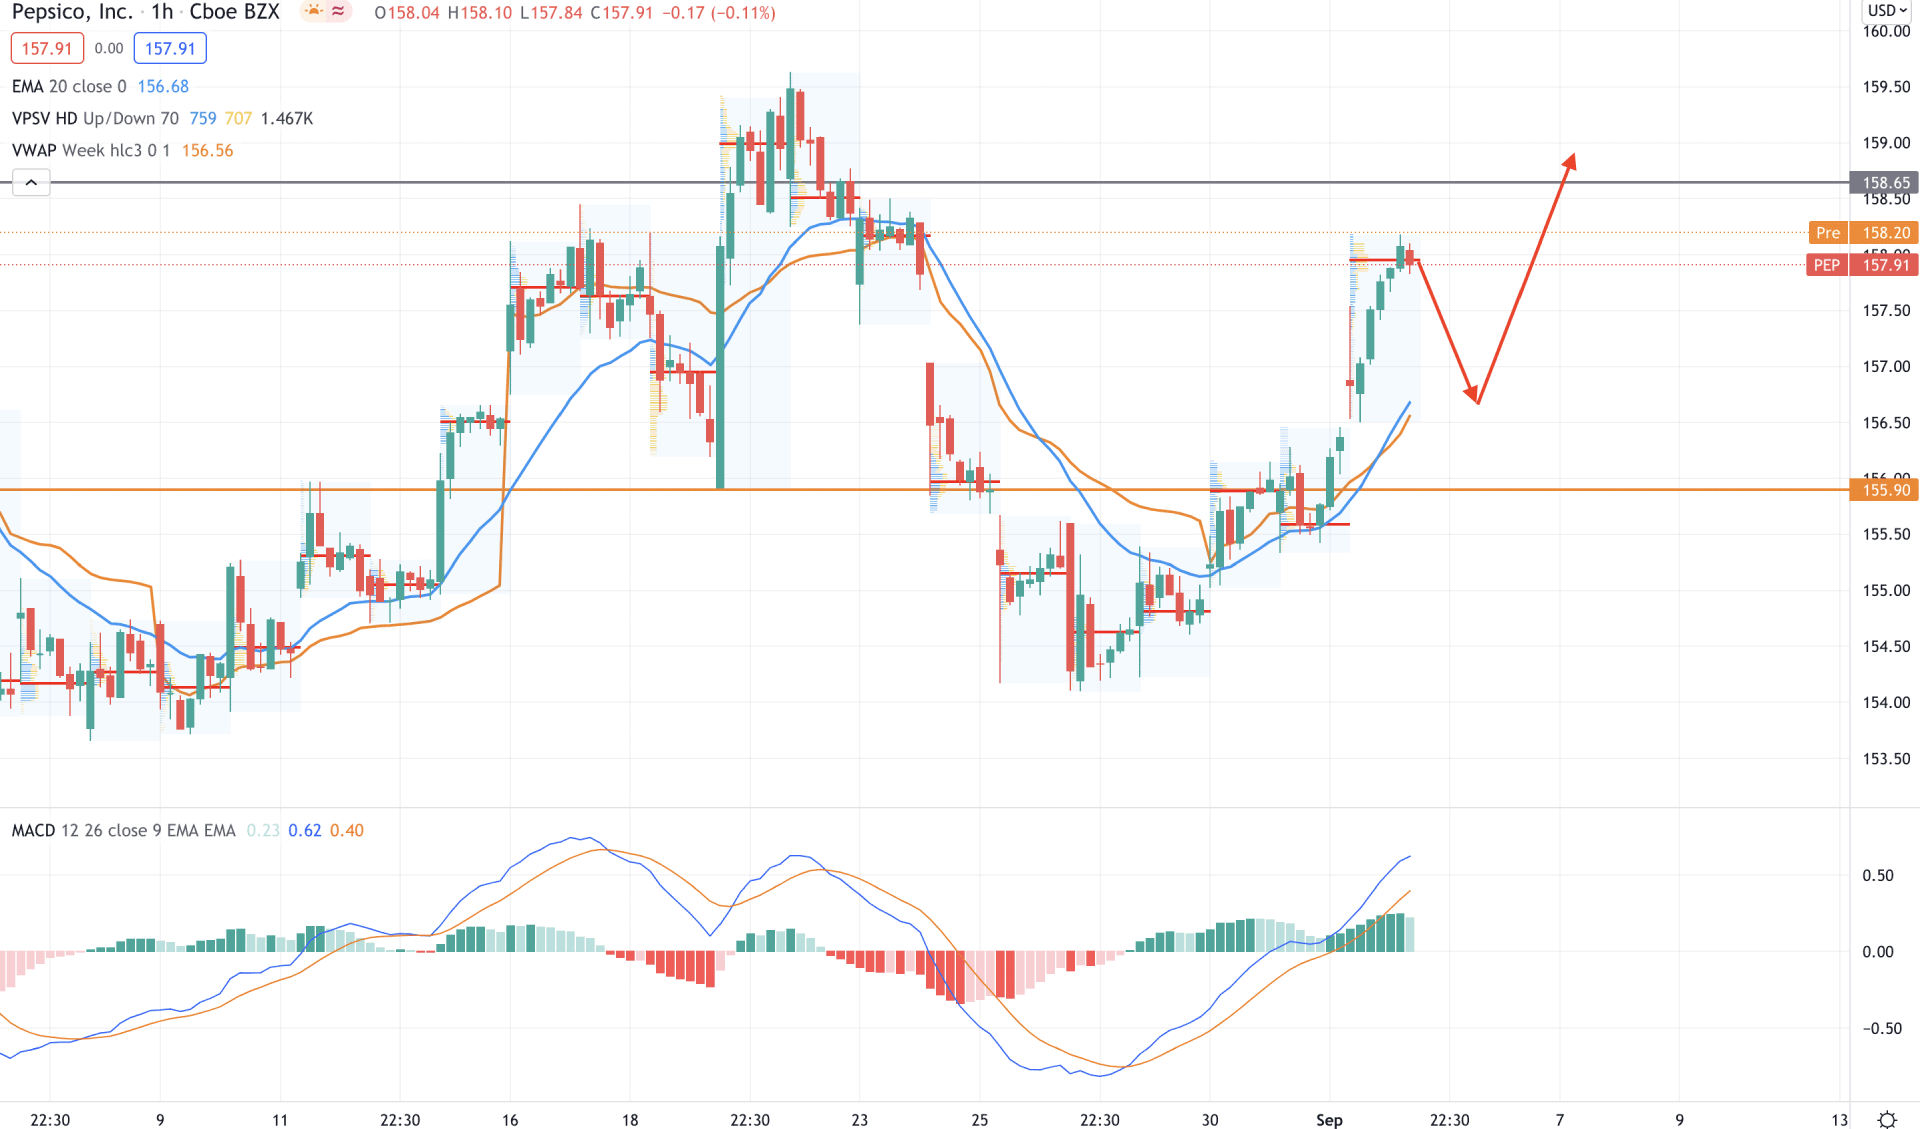
In the intraday chart, PepsiCo stock moved above the dynamic 20 EMA and static 155.90 level with intense bullish pressure and reached the 157.95 high volume level. However, the price failed to show a strong momentum above the 157.95 level and closed the day with a bearish H1 candle. Moreover, the bullish pressure expanded the gap between the price and dynamic 20 EMA, increasing the possibility of a bearish correction.
The above image shows how the price moved above the dynamic 20 EMA and vwap, where any bullish rejection from 157.00 to 155.90 may increase the buying pressure for the coming hours. On the other hand, a stable decline below the 155.90 with a solid bearish H1 close may take the price lower towards the 154.00 bottoms.
As of the above observation, PepsiCo Stock is trading above the near-term demand level at 154.00 area that may increase the current buying pressure towards 170.00 psychological level.
On the other hand, the H4 market structure is very corrective, where a stable H4 close below the cloud support may alter the current market structure and take the price lower towards the 150.00 level.