
Published: May 24th, 2022
The selling pressure in the NZD was boosted by the recent GDT price auction report that was declined by -2.9%. As a result, the whole milk powder price faced a record drop of -4.9%, as shown in the latest PPI report. In particular, the input and output prices q/q moved higher by 3.6% and 2.6% consecutively. It was the most significant rise since the financial crisis in 2008. In that case, if producers want to avoid the situation, they should transfer the cost to consumers, leading to an increase in inflation.
On the other hand, the preliminary Q1 GDP showed a lousy quarter in Japan but not as bad as feared, which is the first impression of expecting a strong JPY against the NZD. The quarterly GDP came at -0.2% vs. -0.4% expectation, while the private consumption was flat. The trade balance showed nine consecutive months of trade deficit due to increased energy and commodity prices. Although the inflation came at 2.5% y/y, it reached the BOJ’s 2% target.
This week, the RBNZ rate decision will happen where the current expectation is a rate hike of 2.0%. Therefore, investors should monitor how the RBNZ shows reaction to the rate decision where a dovish tone would be a bearish signal for NZDJPY.
Let’s see the future price direction from the NZDJPY technical analysis.
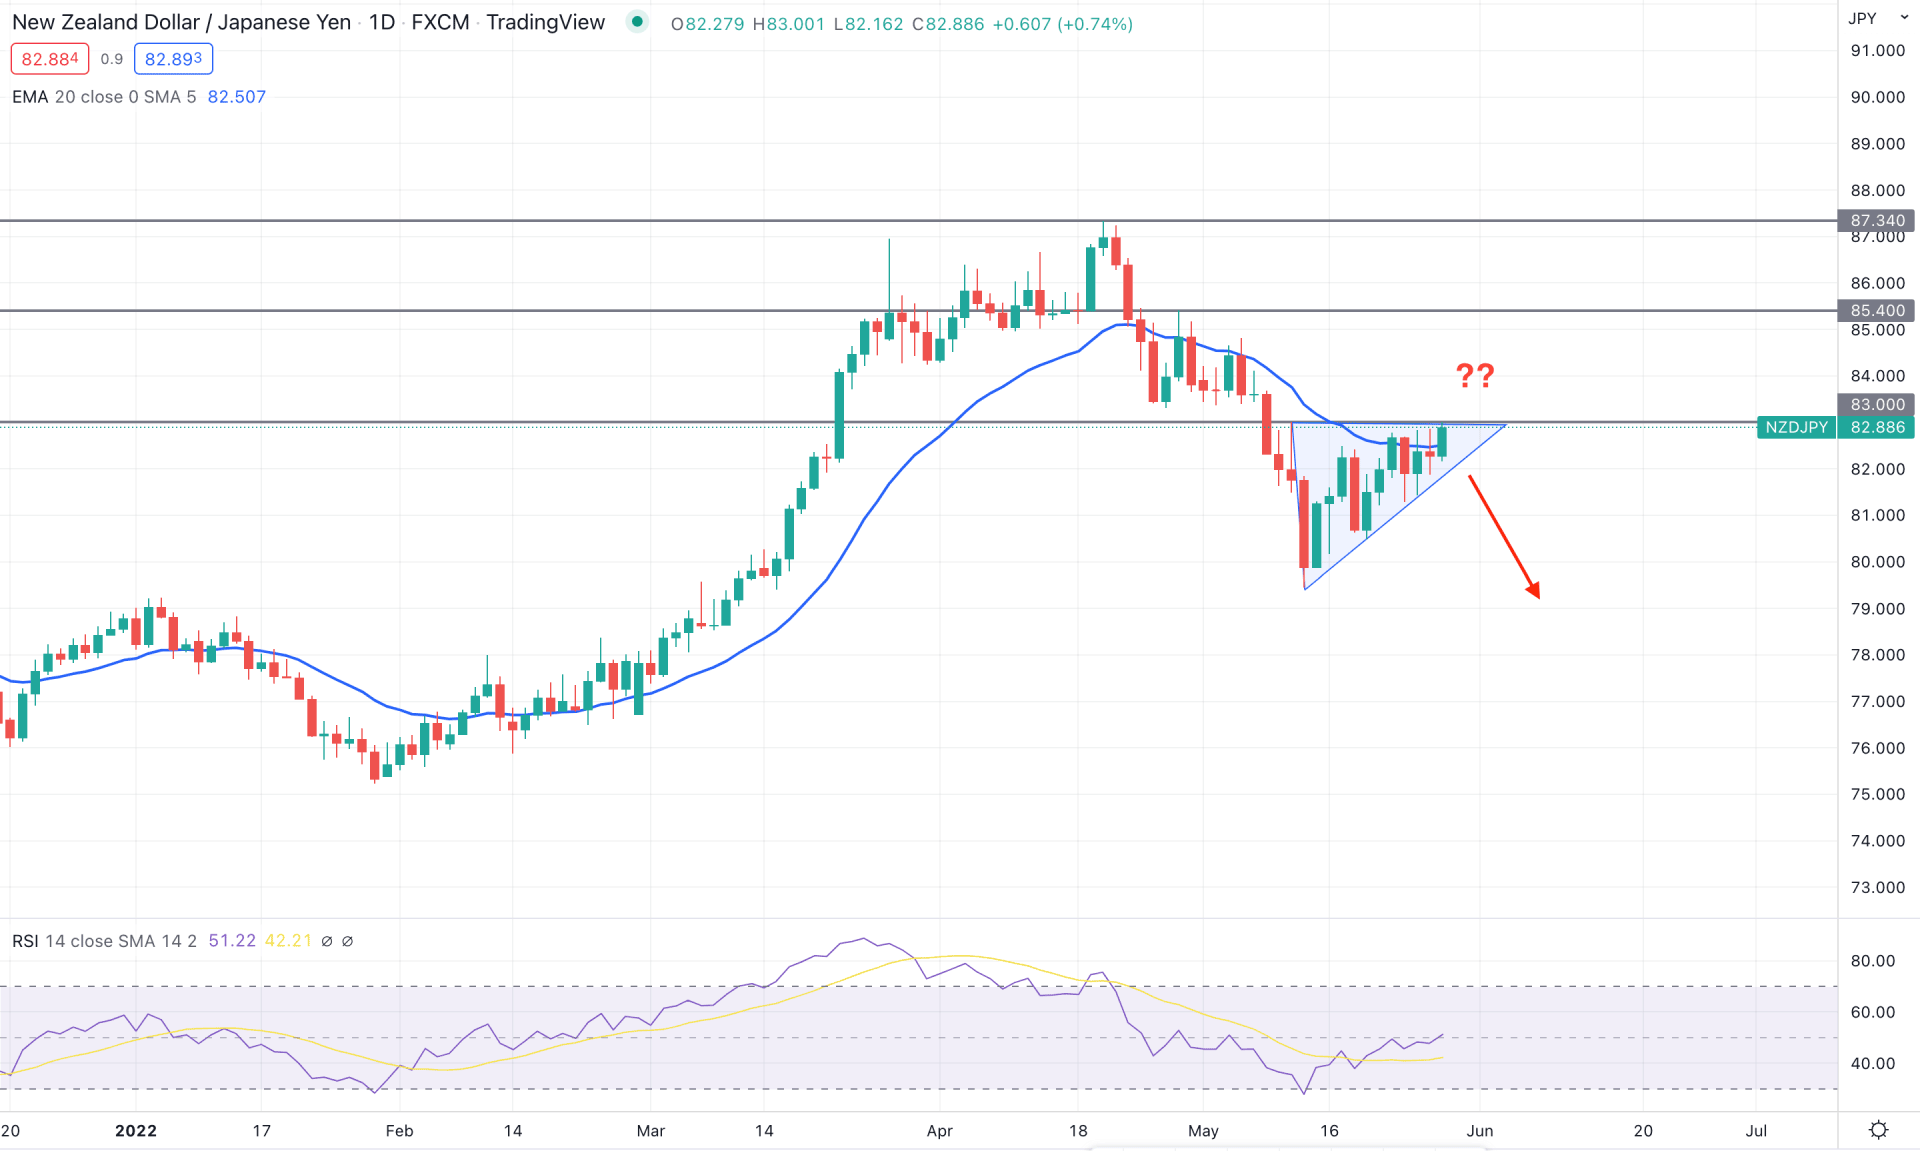
In the daily chart, NZDJPY trades within a bearish trend where the current price is at dynamic 20 EMA resistance. Therefore, a strong buyer's failure from the current resistance level would lower the price, followed by a simple trend continuation pattern. Moreover, the current price trades within a symmetrical triangle formation, besides the immediate static resistance level, are 83.00. In that case, the selling pressure with a candle close below the triangle support would boost the bearish momentum where the price awaits more than 400 pips of drop.
The above image shows how the price closes a daily candle at the 20 EMA level and rebounds immediately on the next day. In the indicator window, the current RSI level is at the neutral 50 level from where a strong move may happen. In that case, a rejection from 50 RSI with a bearish daily candle would be a selling opportunity in this pair.
Based on the daily context, the selling pressure in this pair may extend towards the 79.00 area in the coming days. In that case, the 82.50 to 83.50 area would be crucial for bears as a daily candle above the 83.20 would eliminate the current bearish momentum.
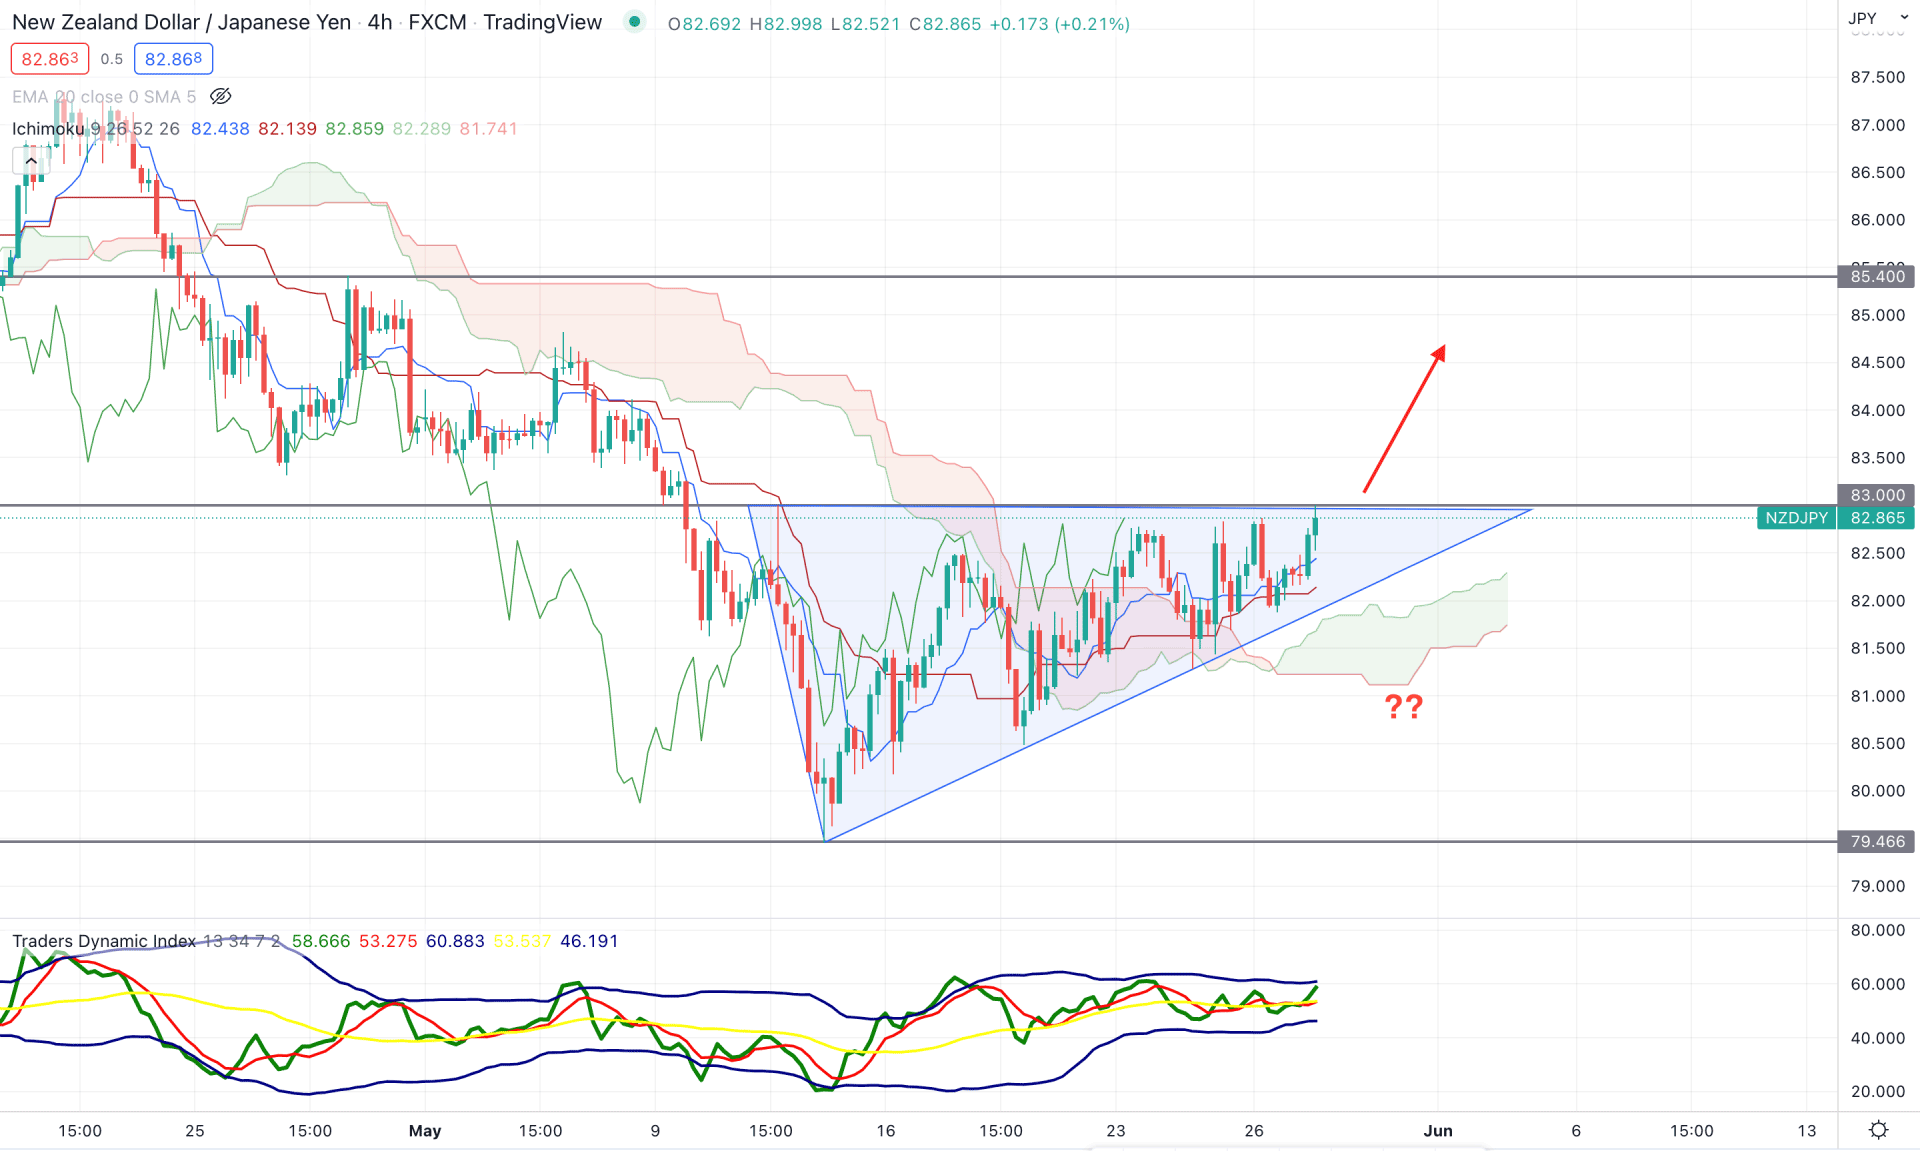
According to the Ichimoku Cloud, the current H4 trend of the NZDJPY price is trading within a corrective bullish momentum where the broader market direction remained bearish. However, the current price trades above the Kumo Cloud while the current price trades within the symmetrical triangle. On the other hand, the situation has become tricky to sellers as the current Future Cloud is strongly bullish while the dynamic Kijun Sen is below the price.
The above image shows how the price trades above the Kumo Cloud while the Traders Dynamic Index shows a buying pressure. The TDI line reached the upper band of the indicator window and hold to momentum, indicating that buyers’ pressure is still intact in the chart. Meanwhile, the dynamic Kijun Sen is below the price, which is the primary barrier for sellers.
Based on the H4 context, a strong bearish H4 candle below the 81.35 level would increase the bearish opportunity in this pair, where the primary target is to test the 79.00 support level. On the other hand, as the current price trades above the Kumo Cloud and Kijun Sen, a new H4 candle above the 83.10 would raise the price towards the 85.40 area.
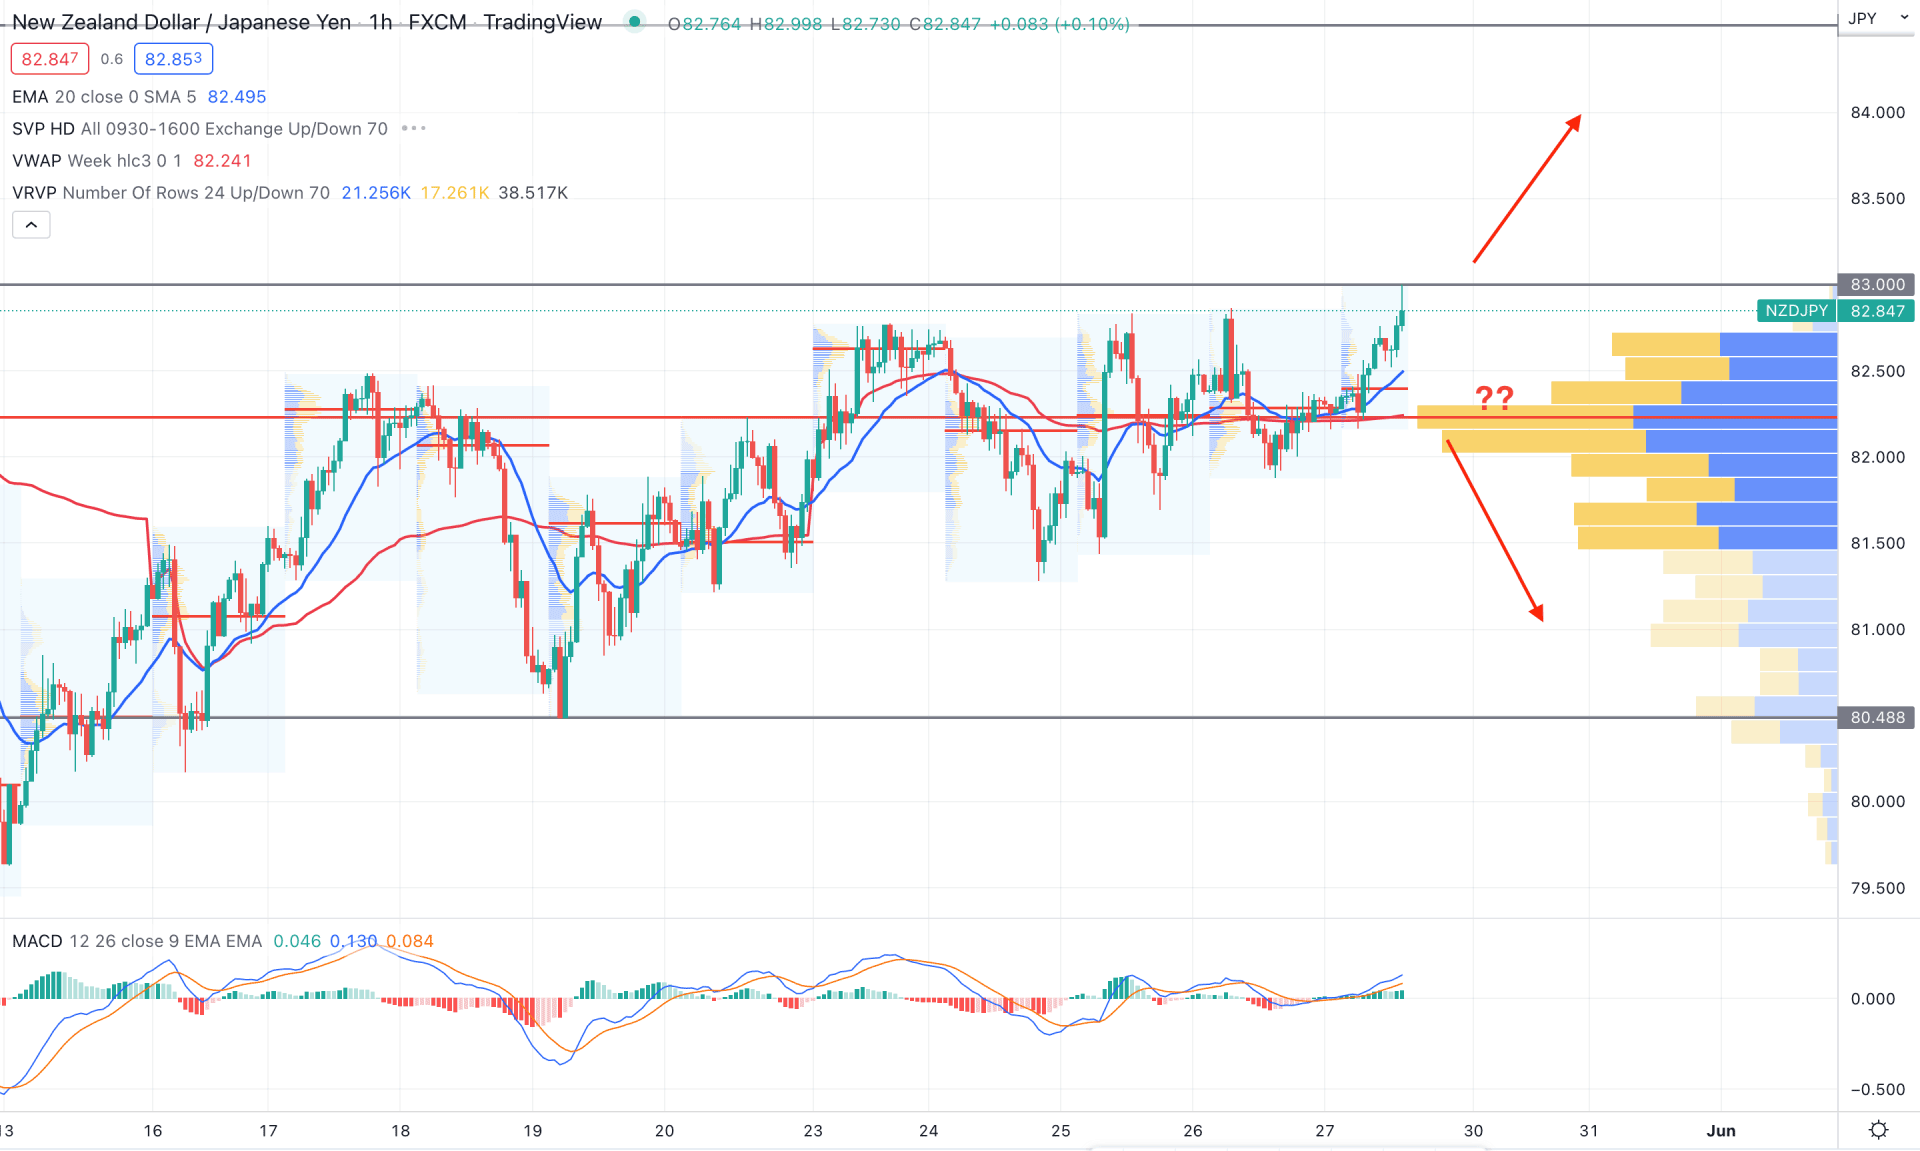
In the intraday chart, the most strong volume from the visible range is at the 82.24 level, which is below the current market price. Moreover, the dynamic 20 EMA and weekly VWAP are below the price, working as dynamic supports. On the other hand, the latest intraday high volume level is also below the price, indicating that the current buying pressure is backed by strong momentum.
The above image shows how the MACD Histogram remains above the neutral line where dynamic weekly VWAP is below the price. Based on the current H1 structure, an intense buying pressure above the 82.47 level is likely to extend the price to the 84.20 level to grab the buy-side liquidity. On the other hand, a strong break below the 82.20 level with rejection from dynamic weekly VWAP would be a bearish opportunity toward the 80.47 level.
As per the current market context, NZDJPY bears have a higher possibility of taking the price down, where the 83.00 level is the most crucial static level. In that case, strong selling pressure from the 83.00 with a bearish symmetrical breakout in the daily chart would be the potential selling opportunity in this pair.