
Published: March 11th, 2020
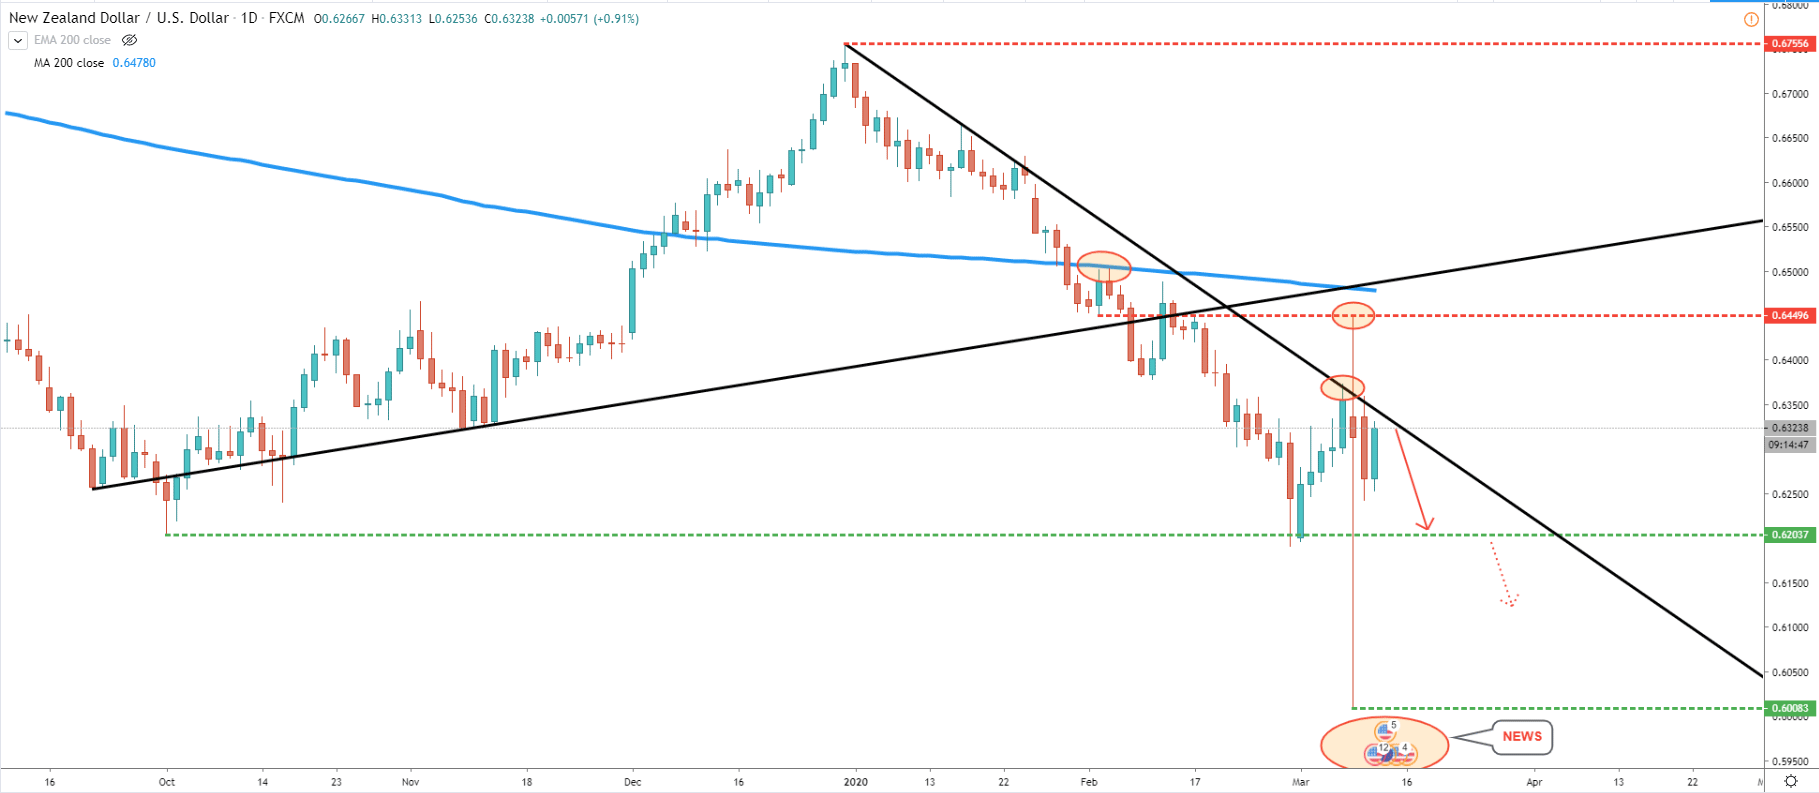
Clearly, the long term uptrend has been broken prior to which we can see a clean bounce off the 200 Simple Moving Average on a daily timeframe. Overall we can see that the pair has established a double bottom at 0.6200 psychological support. Although on a corrective wave up it failed to break and close above the downtrend trendline, which still indicates the validity of a downtrend.
Multiple news will be released today as well as tomorrow on the US Dollar, which could trigger big movement within 48 hours. While the trend is down, it remains more probable that the next move could be towards new lower lows, but the nearest target would be 0.6200.
Have a look at the low at 0.6450, established prior to rejection of the 200 SMA. Because on March 09, this was the highest point produced by the huge spike. This goes to show that bears remain in control of the situation and the downside potential is open for opportunities.
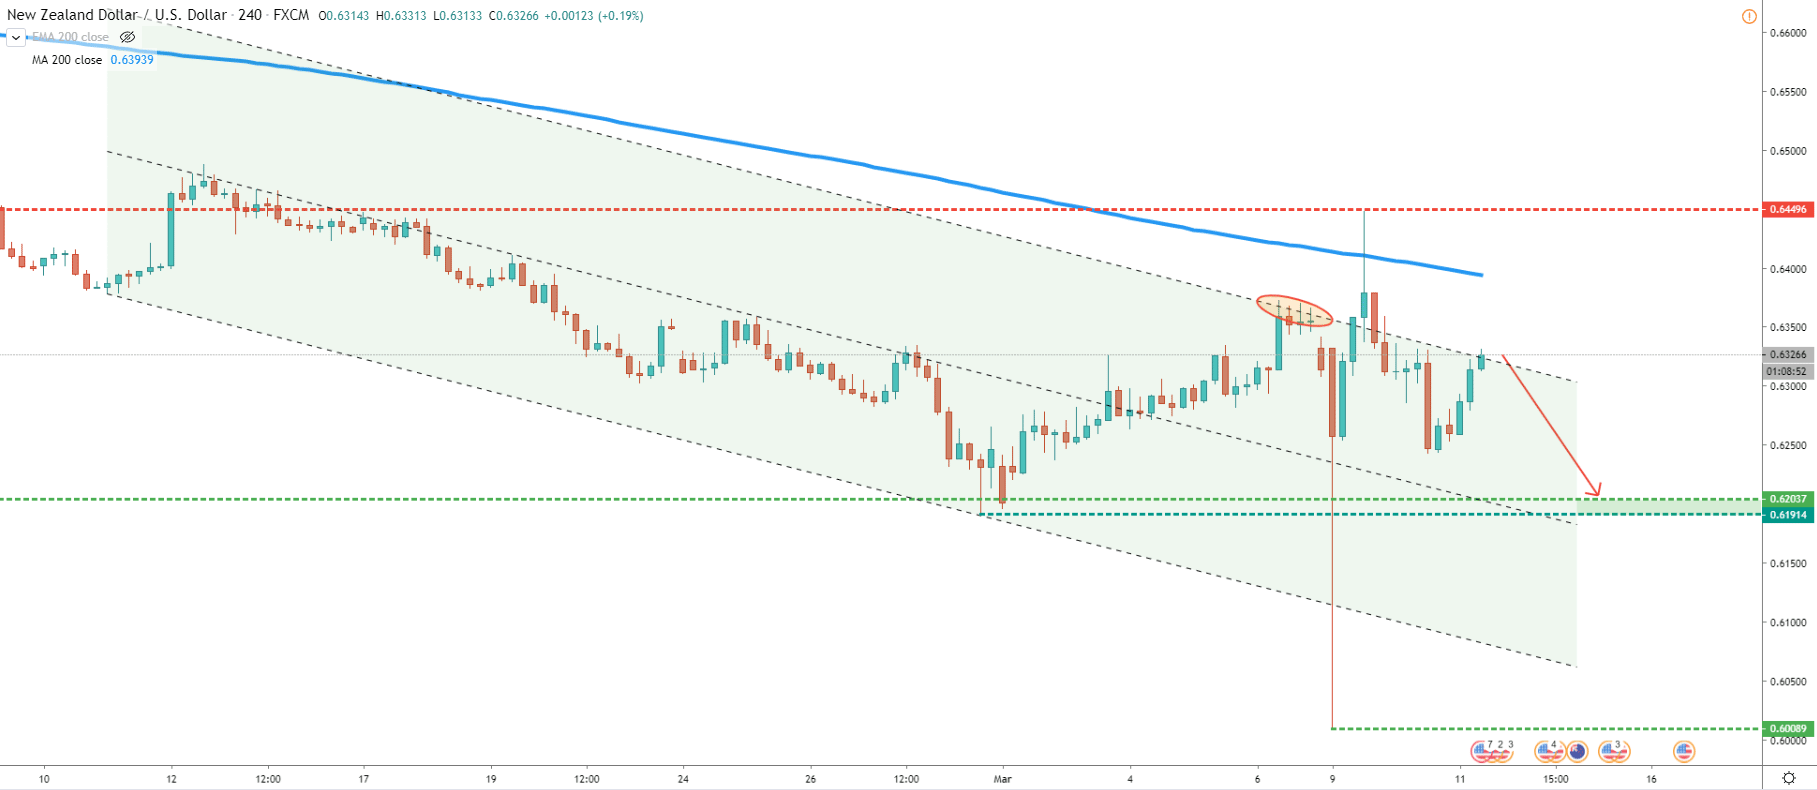
The 4H chart shows that the price did reject the upper trendline of the extended descending channel. It seems that the pair broke above, although, on a daily chart, there was no close above the trendline. At the same time price bounced off the 200 SMA and currently remains at the top of the extended descending channel. This could be an attractive price for the sellers at this stage.
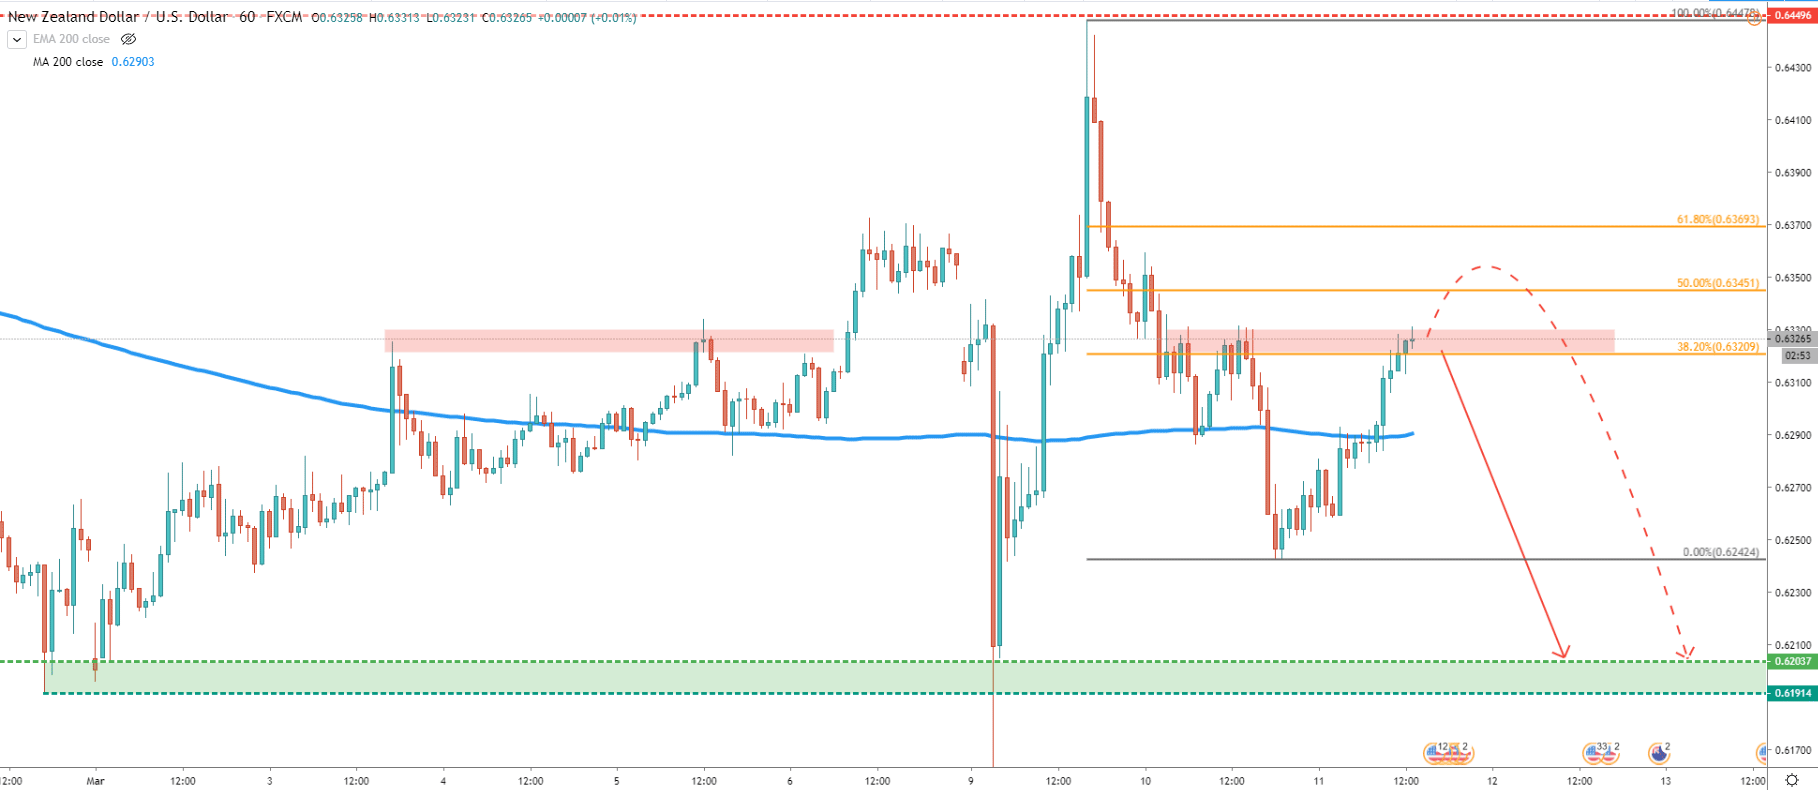
On the 1H chart, it looks like a consolidation phase is still intact. Because price keeps moving around 200 SMA. At the same time, NZD/USD remains at the previous are of resistance, which is near 0.6325. We can see that throughout 3-6 March, the pair struggled to break above. Yet again this area remains a supply zone. Looking at Fibonacci retracement levels, it is possible that price will attempt to move higher towards one of the resistance levels, before an if it will go down.
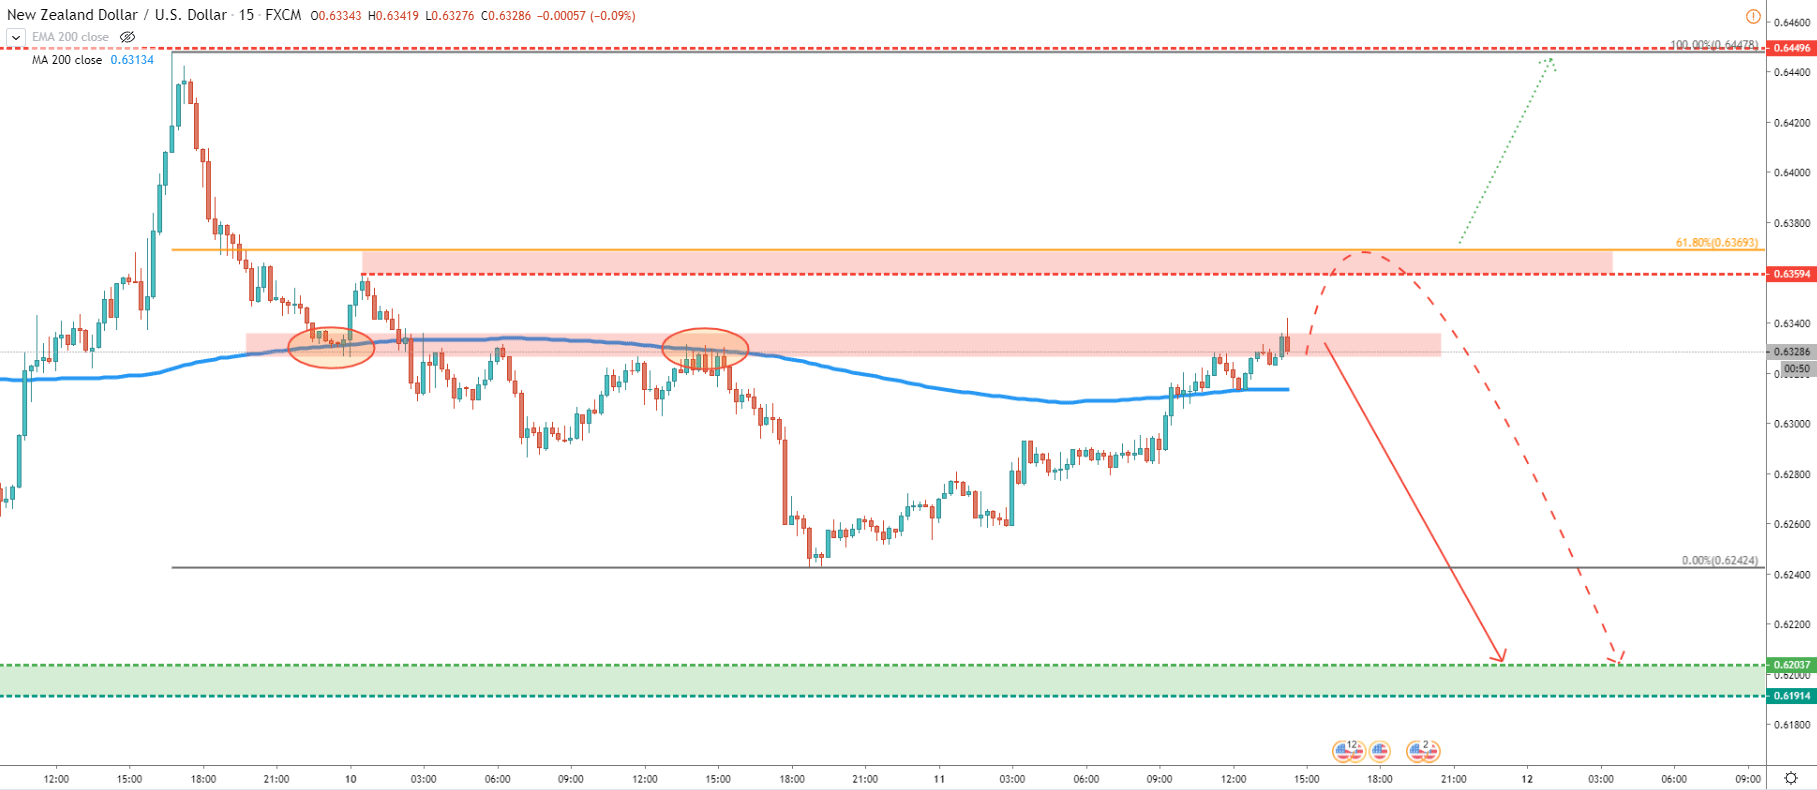
On 15M chart we can see a potential rise towards the 61.8% Fibonacci retracement level at 0.6370. But at the same time, price did reject the 200 SMA and now it still remains a valid resistance area. For now, selling opportunities might be a priority as long as price remains below the 0.6370.
NZD/USD long term trend is down, and this could result in another price drop within the next 48 hours due to the scheduled news release. However, the risk of more upside move can be expected.
Key support is seen at 0.6200 psychological level, although if broken, the price can drop towards previous low at 0.6000, which is another psychological level.
As long as the price is below 0.6370 there is a strong probability of an uptrend. But key resistance remains at 0.6450, and only break and close above this level would invalidate bullish outlook and can result in a trend reversal.
Support: 0.6200, 0.6000
Resistance: 0.6370, 0.6450