
Published: December 30th, 2020
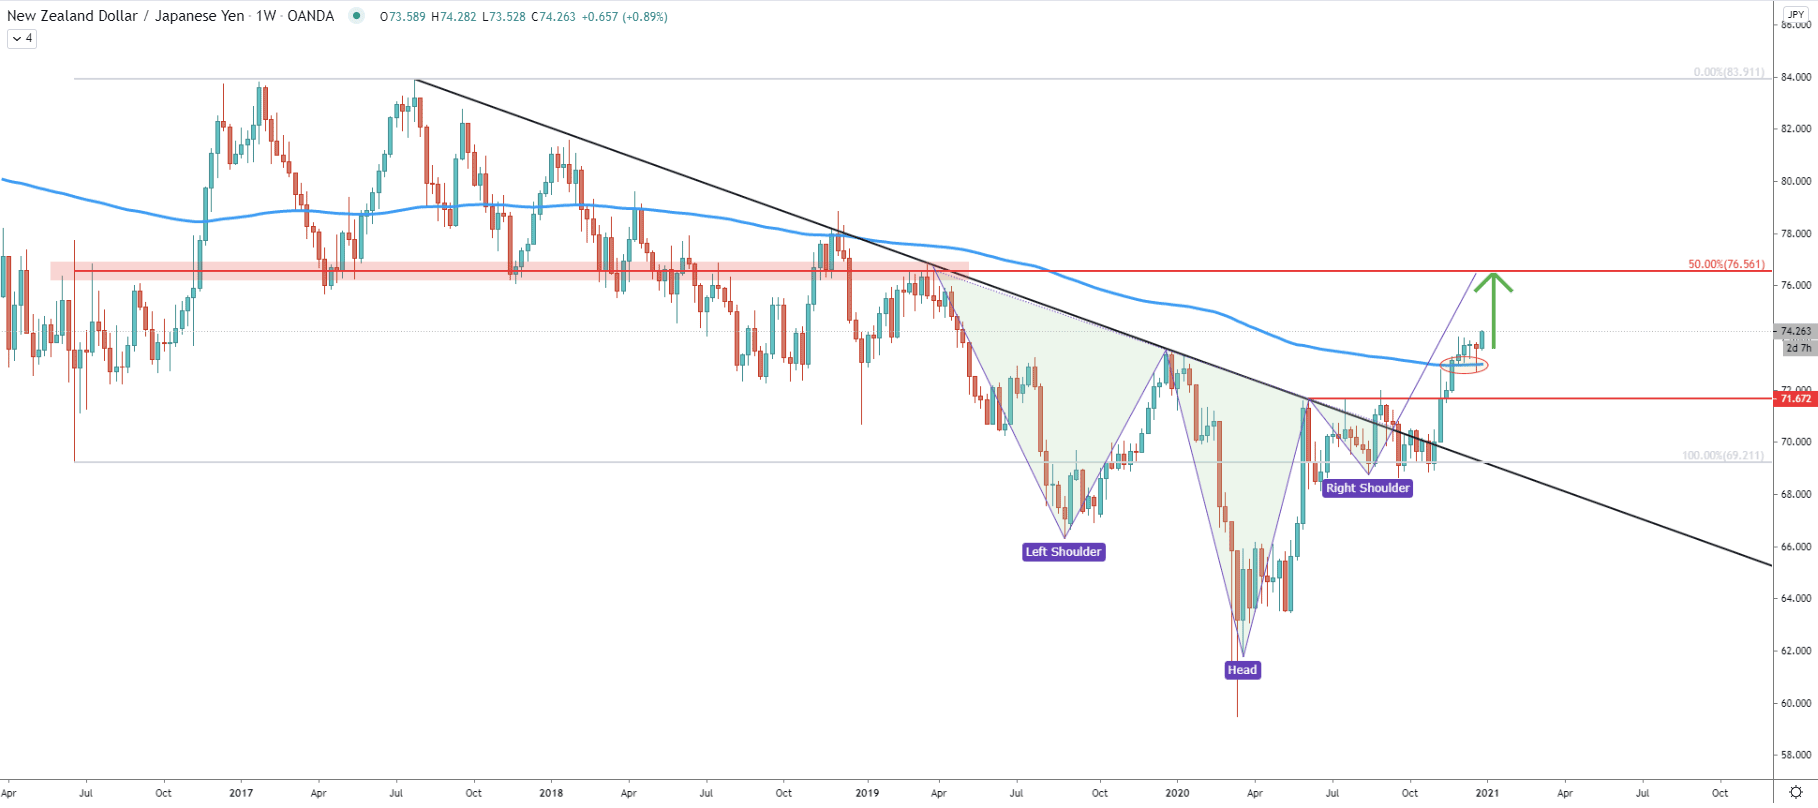
At the end of November NZD/JPY broke above the uptrend trendline, followed by the breakout of 71.67, which was a strong resistance formed between July and September. This was the very first confirmation of the potential long-term trend reversal, from bearish to bullish. After the key resistance got broken, the price went higher and broke above the 200 Exponential Moving Average. It can be seen, that after the EMA breakout, the price corrected down, and found support near EMA. Right now NZD/JPY continues to print higher highs and higher lows, which is a strong indication that the uptrend is likely to continue.
Looking from another perspective, NZD/JPY could have confirmed a reversed head and shoulders pattern after it broke above the neckline. This pattern suggests that price is likely to increase towards the 76.56 resistance, which is confirmed by the 50% Fibonacci retracement level applied to corrective move up that occurred back in 2016-2018.
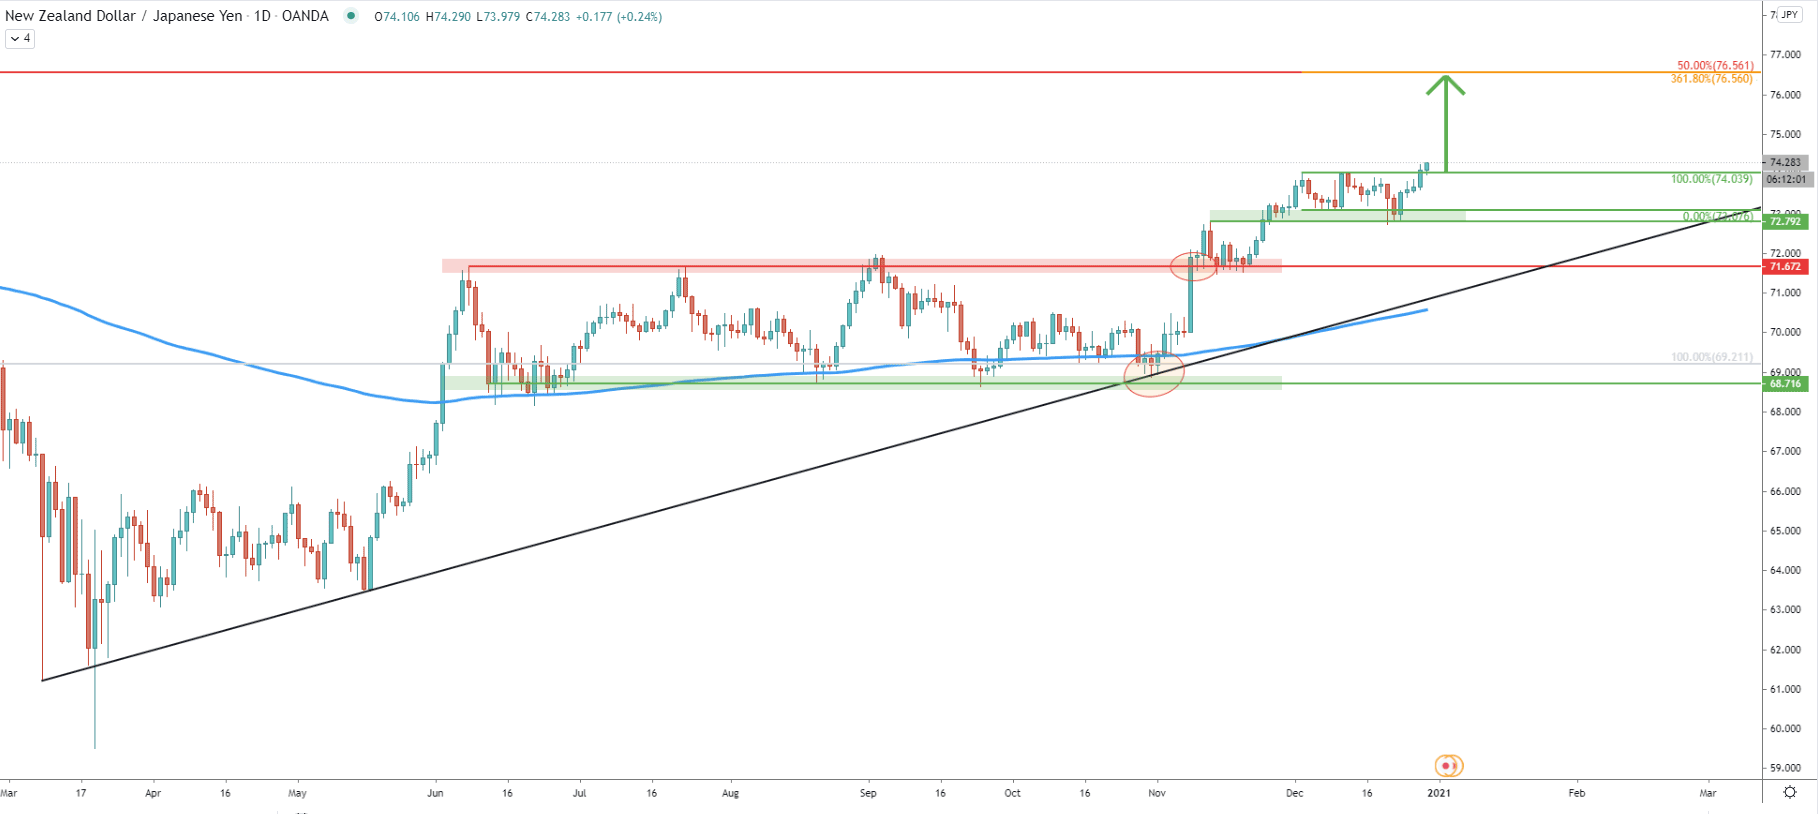
The daily chart gets to show a consolidation area, where the price has been stuck since June. This area is located between the 68.70 support and 71.67 resistance, which was broken recently. After the price broke above the resistance it pulled back and resistance became the support. The uptrend continued followed by yet another minor consolidation phase. And today the 74.00 psychological resistance got broken, confirming strong bullish pressure.
Fibonacci applied to the most recent downside correction shows that 361.8% Fibs exactly corresponds to the 50% Fibs as per the weekly chart. This makes 75.56 a very strong supply area, which should be watched either for a rejection or breakout.
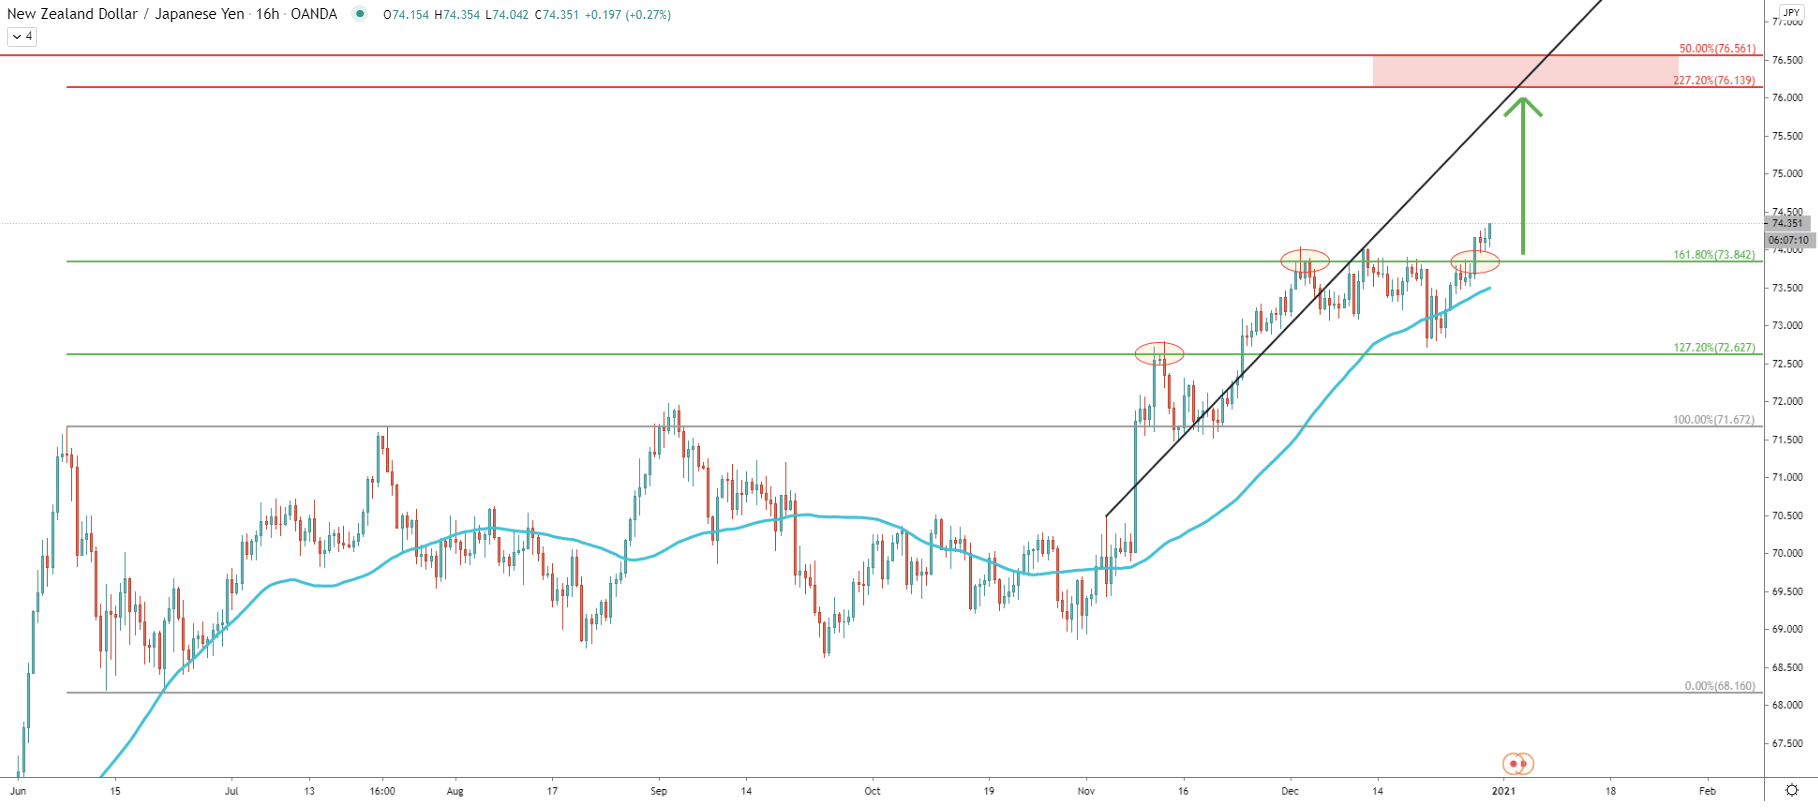
Fibonacci applied to the downside correction, where previously 50 EMA was rejected, shows that 127.2% Fibs at 72.62 and then 161.8% Fibs at 73.84 were both acting as resistance at some point in time. Nonetheless, both of them got broken, which opens the potential towards the next resistance at 227.2% Fibs. This shows, that the resistance area could be located between 76.13 and 76.56.
The trend is strongly bullish and the buying pressure is likely to increase thought this and next week. This is because based on the average price uptrend trenldine the resistance area could be tested in just several trading days.
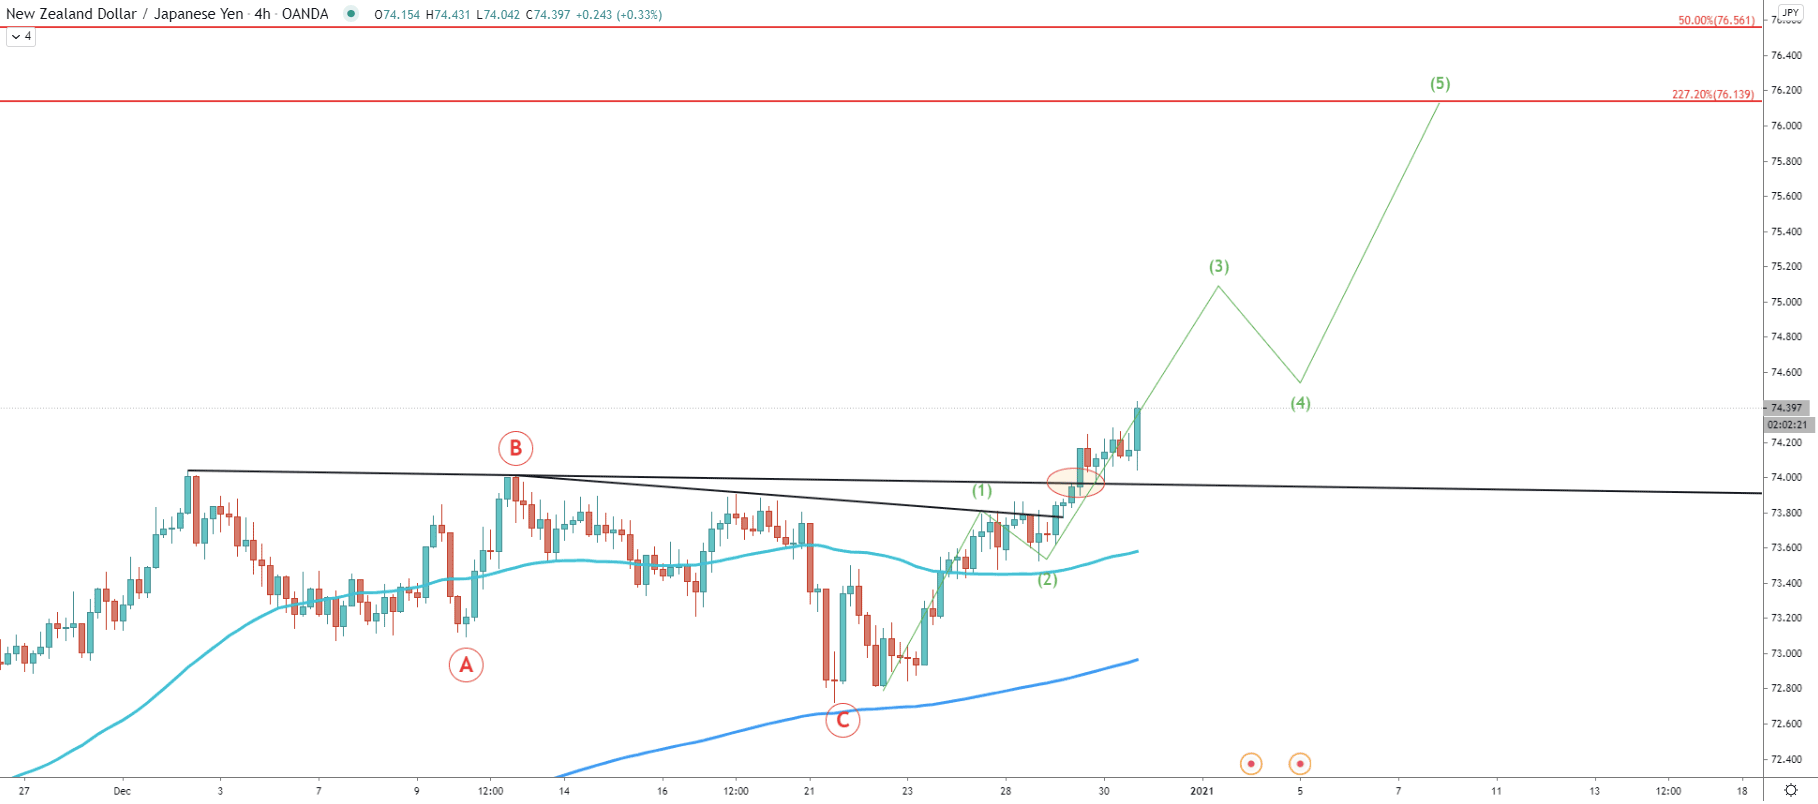
On the 4-hour chart, NZD/JPY has accompanied an ABC downside correction and rejected the 200 EMA. After that price broke above the 50 EMA and both downtrend trendlines. This strongly implies that the trend is strongly bullish, especially after price found the support of the downtrend trenldine.
Speaking about the Elliot Wave theory, as an ABC correction has ended, now it is the time for a 5-wave upside move. Perhaps right now NZD/JPY is right in the middle of wave 3, which shows that price is yet to move higher, correct down and then finalize the uptrend on the 5th wave.
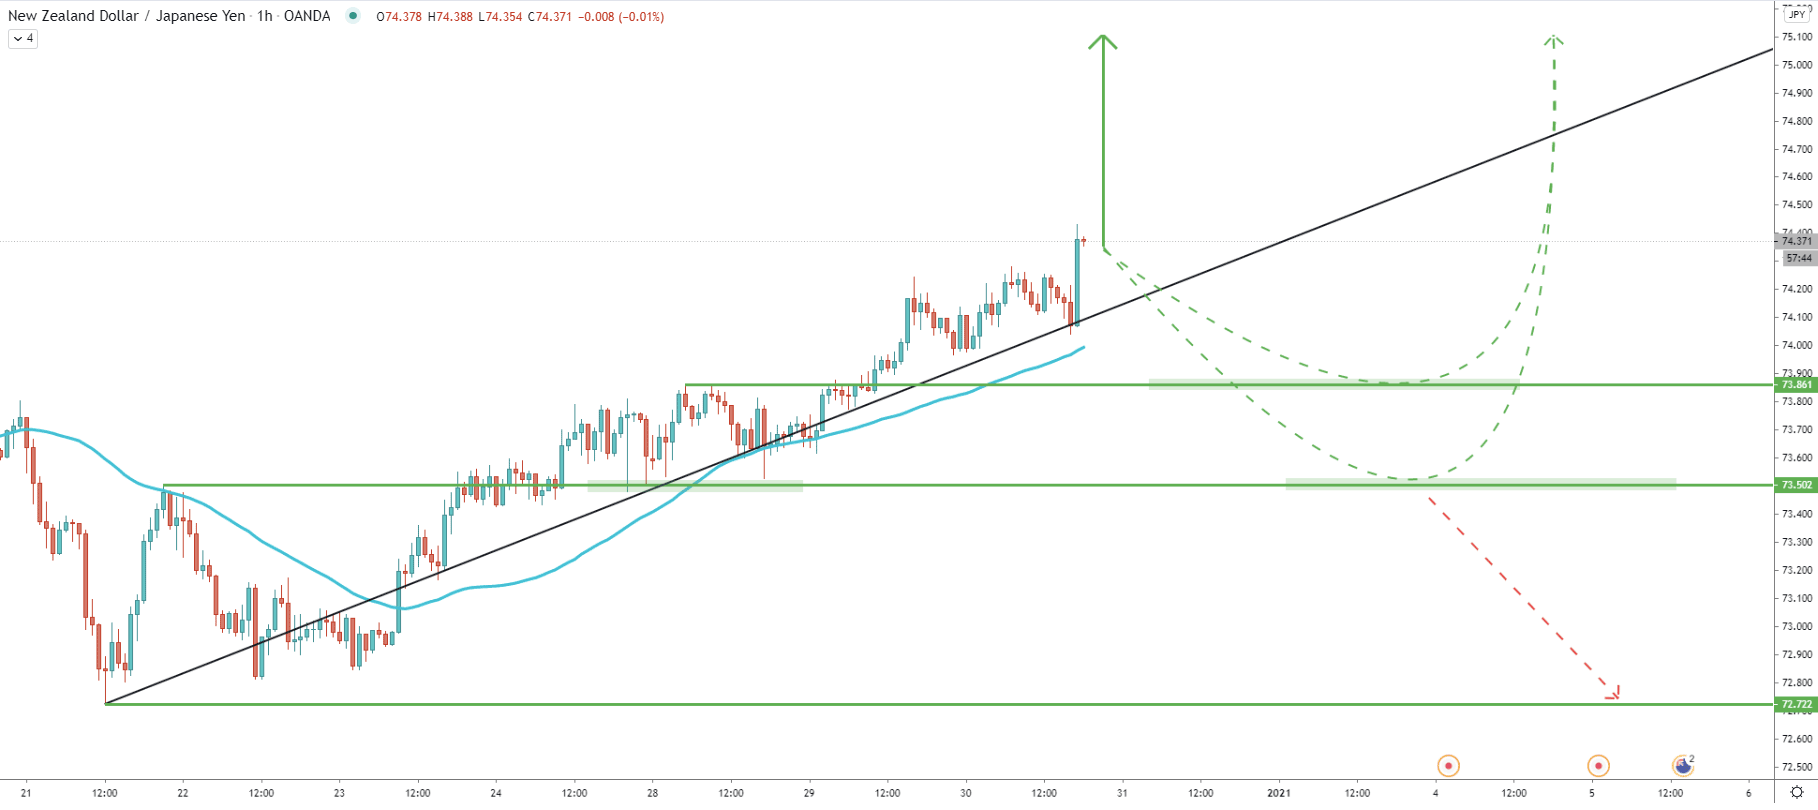
The hourly chart shows several scenarios of an uptrend continuation. The first scenario implies the continuation of the upside move without any major corrections down. This is because the price remains above the 50 EMA and today rejected the uptrend trenldine. The second scenario suggests that there might be a correction towards the 73.86 support, with the third scenario showing that the price could potentially decline towards the 73.50 support before/if the uptrend continues.
NZD/JPY could have confirmed a strong uptrend, which has just started. Overall, a 250 growth potential is wide open and the uptrend could be accelerated throughout this week.
As per the daily chart, the key resistance level and the potential upside target could be located at 76.56, which is confirmed by two Fibonacci retracement levels.
As per the hourly chart, only a break below the 73.50 support will invalidate the bullish outlook. Such price action is likely to result in NZD/JPY moving down, potentially to test the 72.72 level, which is the previously formed support.
Support: 73.84,73.50
Resistance: 76.14, 76.56