
Published: August 6th, 2020
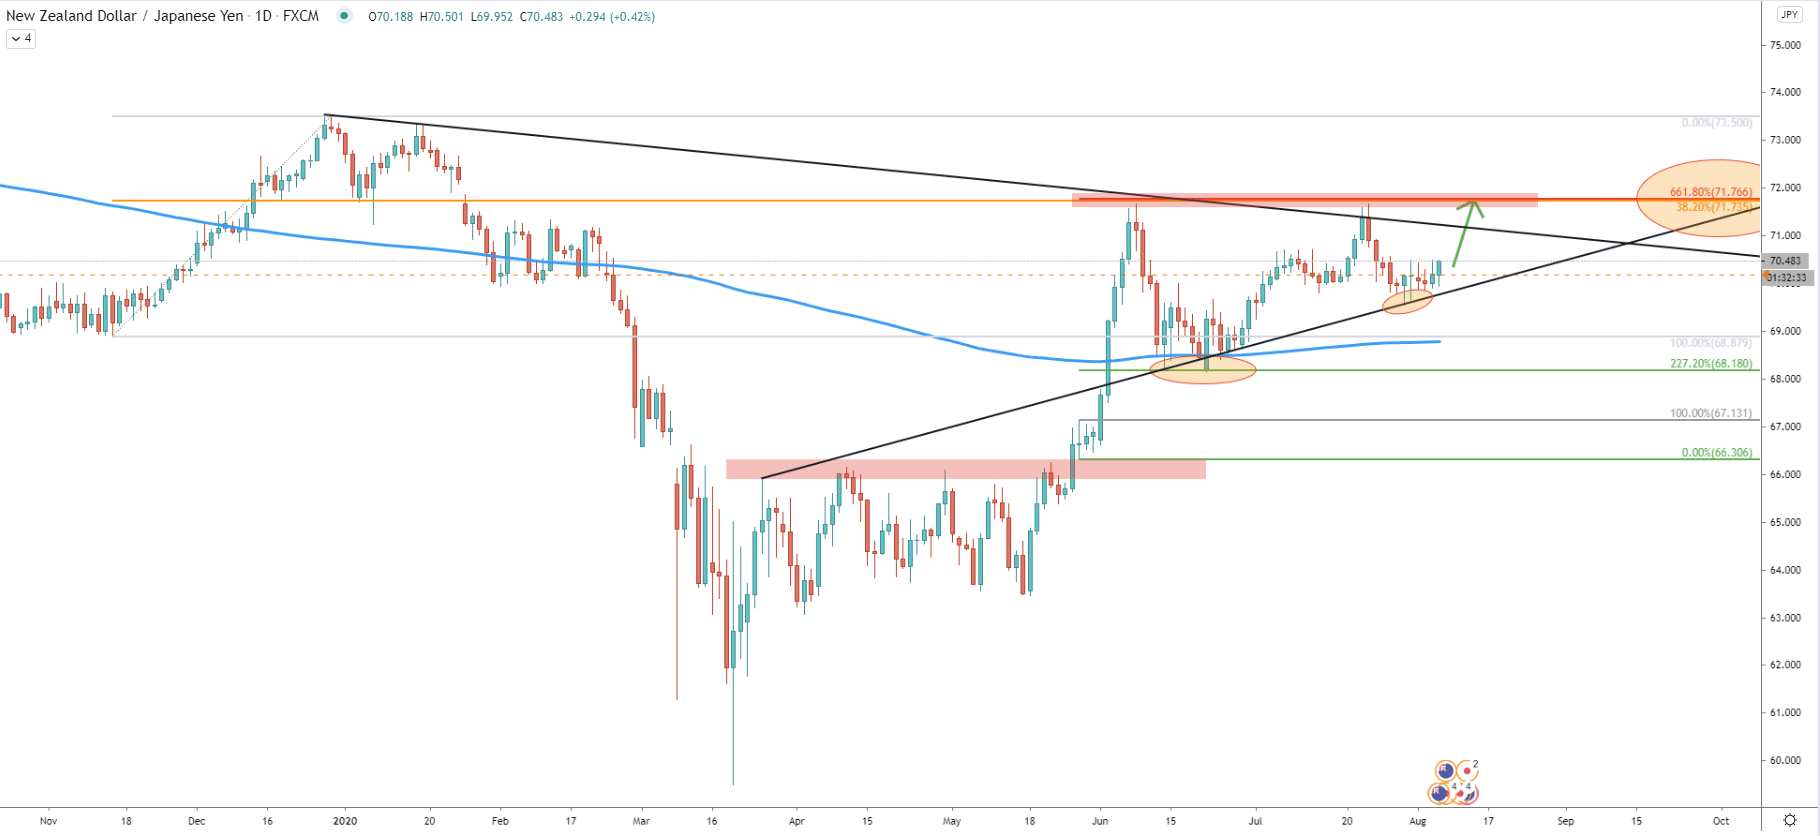
NZD/PY had experienced a huge drop in price during the period between January 01 - March 19, where price has dropped by a huge 1404 pips equals to 19.10%. Then price started to recover, and by the June 8 has increased by 20.14%. Truly a staggering recovery, which is still ongoing based on the lower timeframes price action observed below.
After the price has reached 71.66 high on June 8, correction down followed and the support was found at 227.2% Fibonacci retracement level, which is at 68.18. Fibs were applied to the corrective wave down after the 66.30 resistance area has been broken. This Fibonacci indicator also shows the resistance at 661.8% Fibs. This is the 71.75 level which also corresponds to the 38.2% Fibs applied to the last wave up, prior to the massive downtrend.
On the 8-12 June correction down, along with the 227.2% Fibs support, NZD/JPY also rejected the 200 Exponential Moving Average. The EMA and Fibs rejection resulted in the price increase towards the previous resistance area and yet again, a correction wave down followed. However, pair remains above the 200 EMA and what is more important, the average-price trendline has been rejected cleanly on July 30. This might suggest that the uptrend is far from over and there is at least another wave to the upside prior to a strong correction down.
Nonetheless, we can see that the long term downtrend trendline was rejected, which attempts to show that the upside wave could be in fact the final one with a massive downside move afterward. But this can become the reality only if the daily close will remain below 71.75 when/if this resistance will be reached.
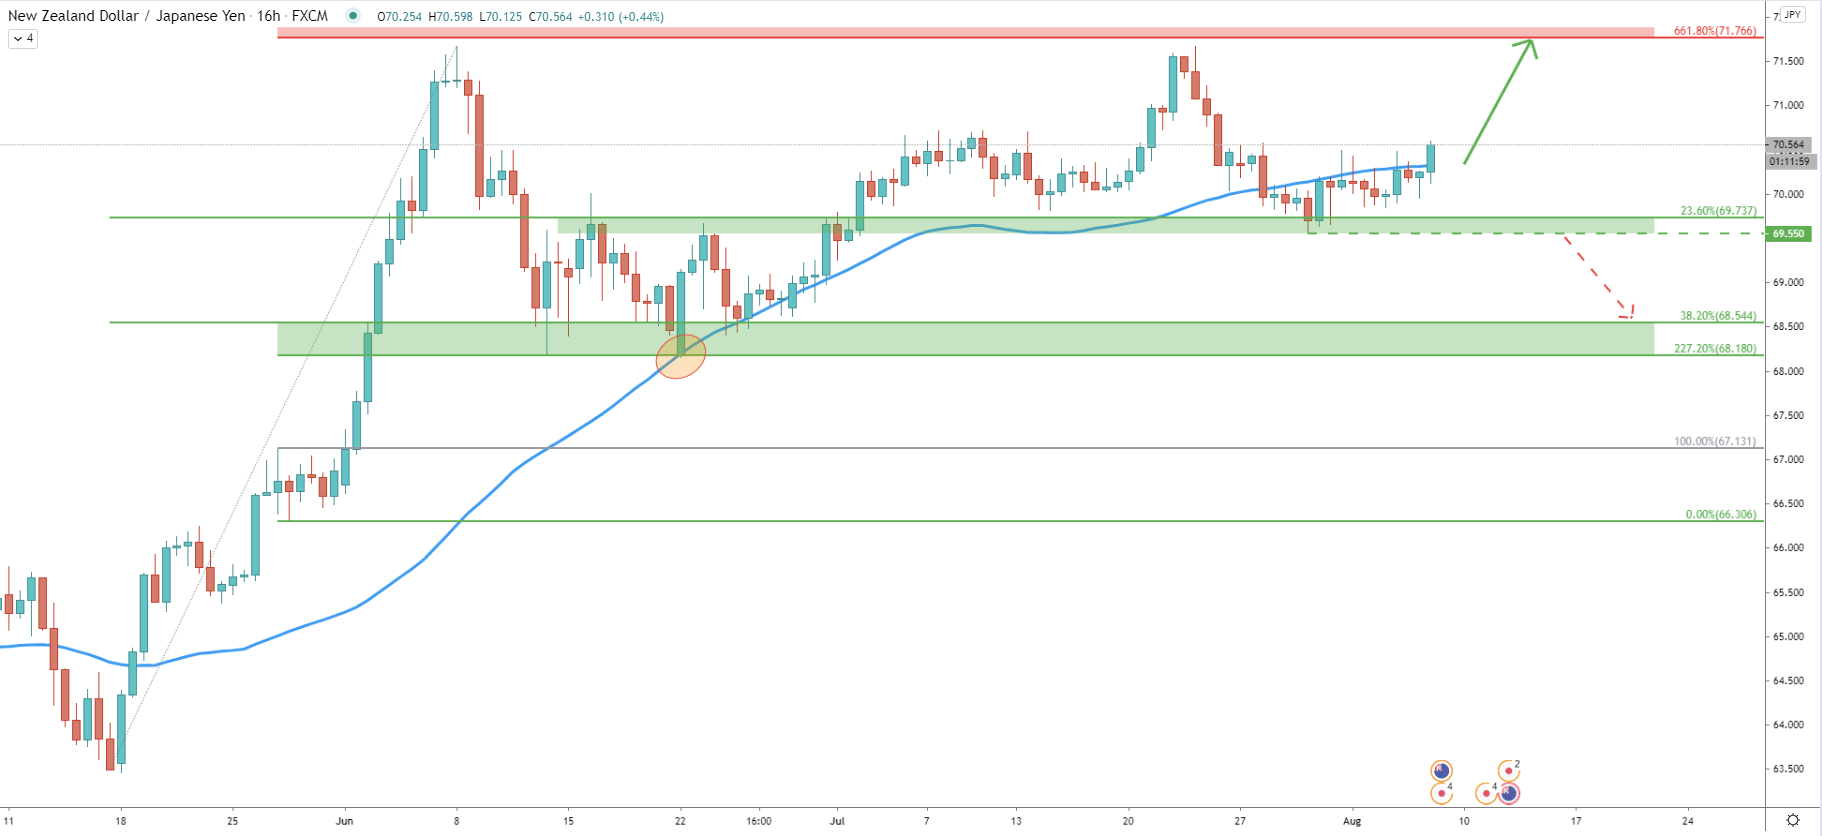
Here we have applied a simple Fibonacci retracement indicator to the overall uptrend. Price has reached and rejected 38.2% Fibs at 68.54 along with the 200 Simple Moving Average and 227.2% Fibs at 68.18 as per the Daily chart. The next and the most recent bounce was from the 23.6% Fibs at 69.73 validating the ongoing uptrend.
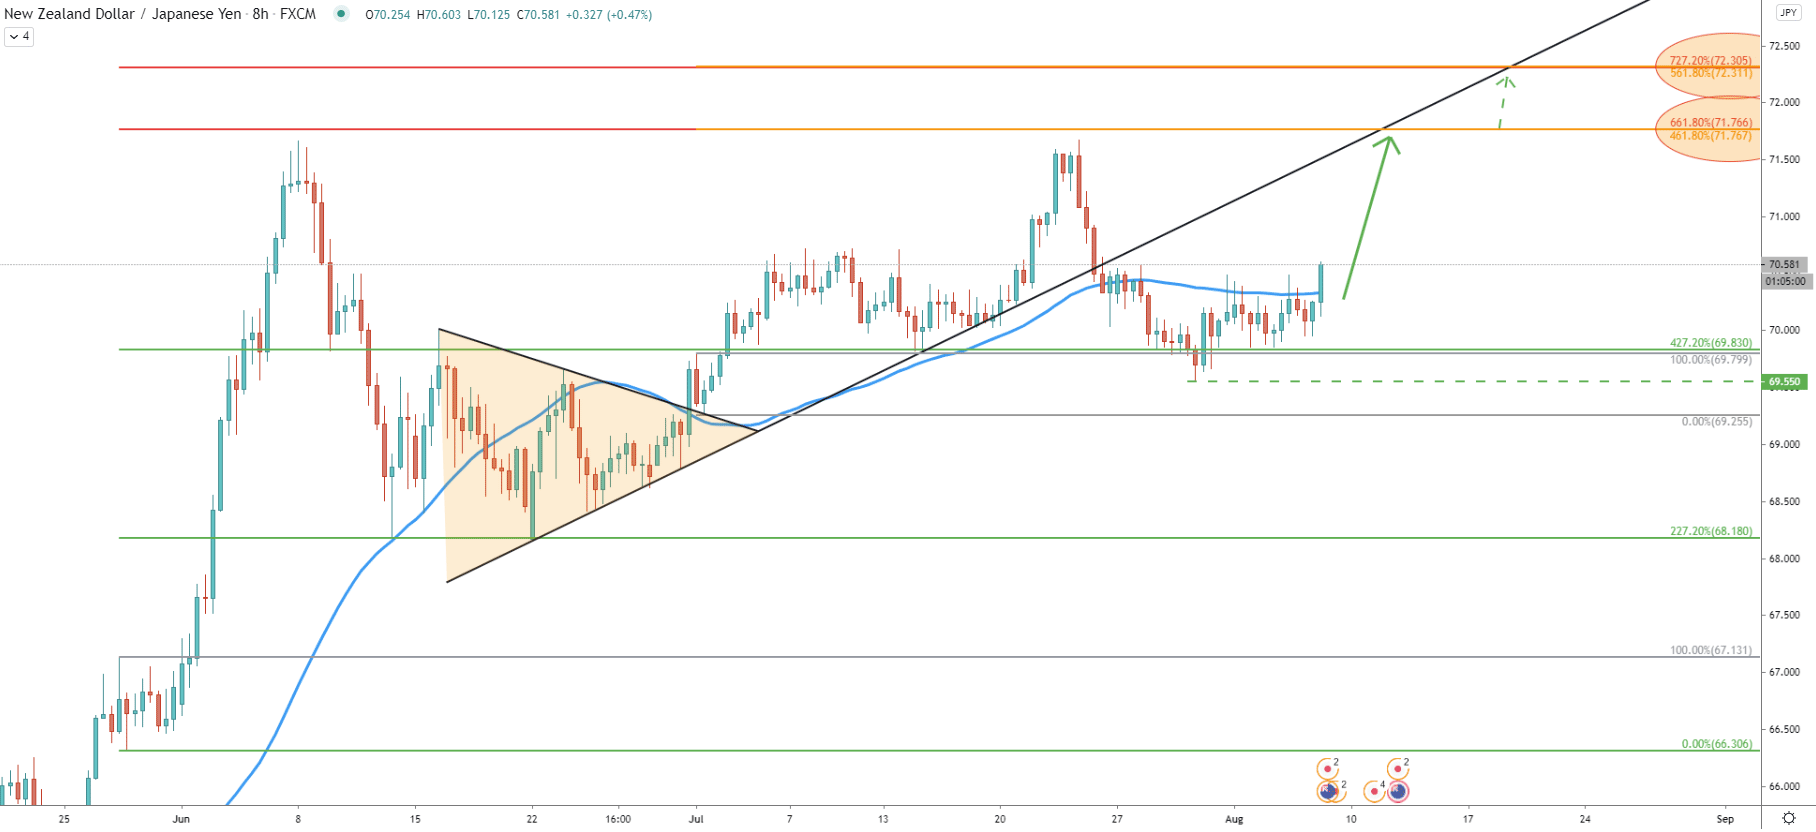
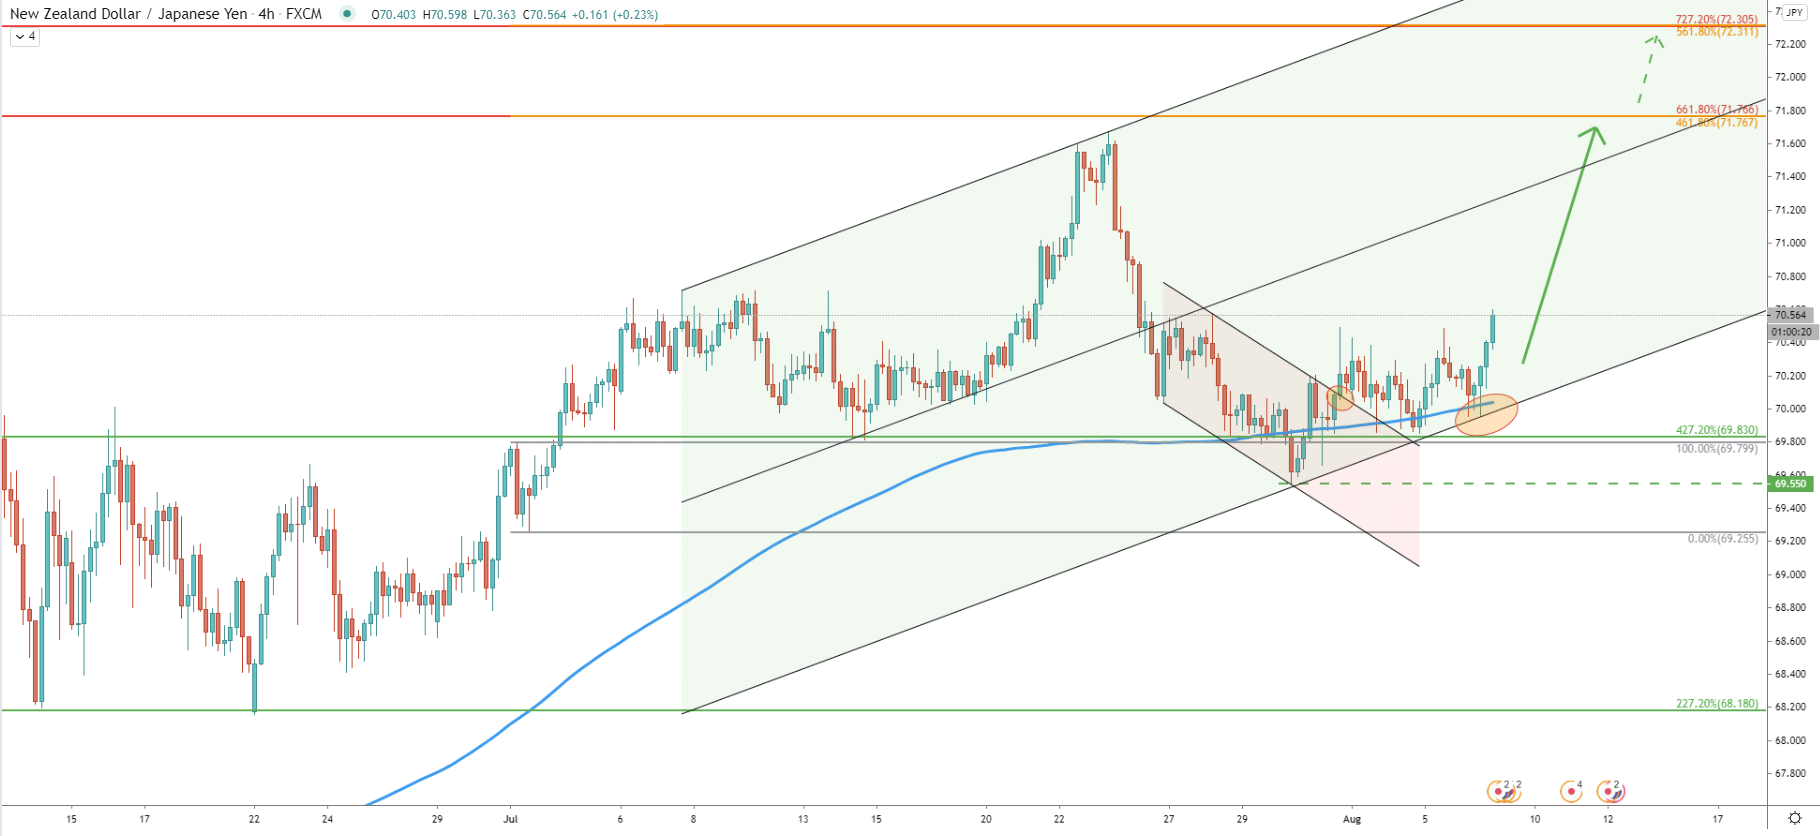
NZD/JPY broke above the triangle and then repeatedly bounced off the 427.2% Fibonacci support at 69.83 as per the daily chart. We have applied other Fibs to the correction down after the triangle pattern breakout. Both of these Fibs are pointing out two key resistance levels and potential upside targets. The first is 71.76, confirmed by 461.8% and 661.8% retracement levels. Second is the 72.30 confirmed by 561.8% and 727.2% Fibs. The first and the second resistances are corresponding to the uptrend trendline, which might also act as the resistance. This means that price can reach the first target on the 11 and second target on the 18 of August.
After producing the 69.55 low, the price has broken above the 200 EMA as well as the descending channel. Then price has consolidated for a short period of time, but today NZD/JPY has cleanly rejected the lower trendline of the extended descending channel as well as 200 EMA. After the rejection, a new higher high has been produced, strongly suggesting further increase in price.
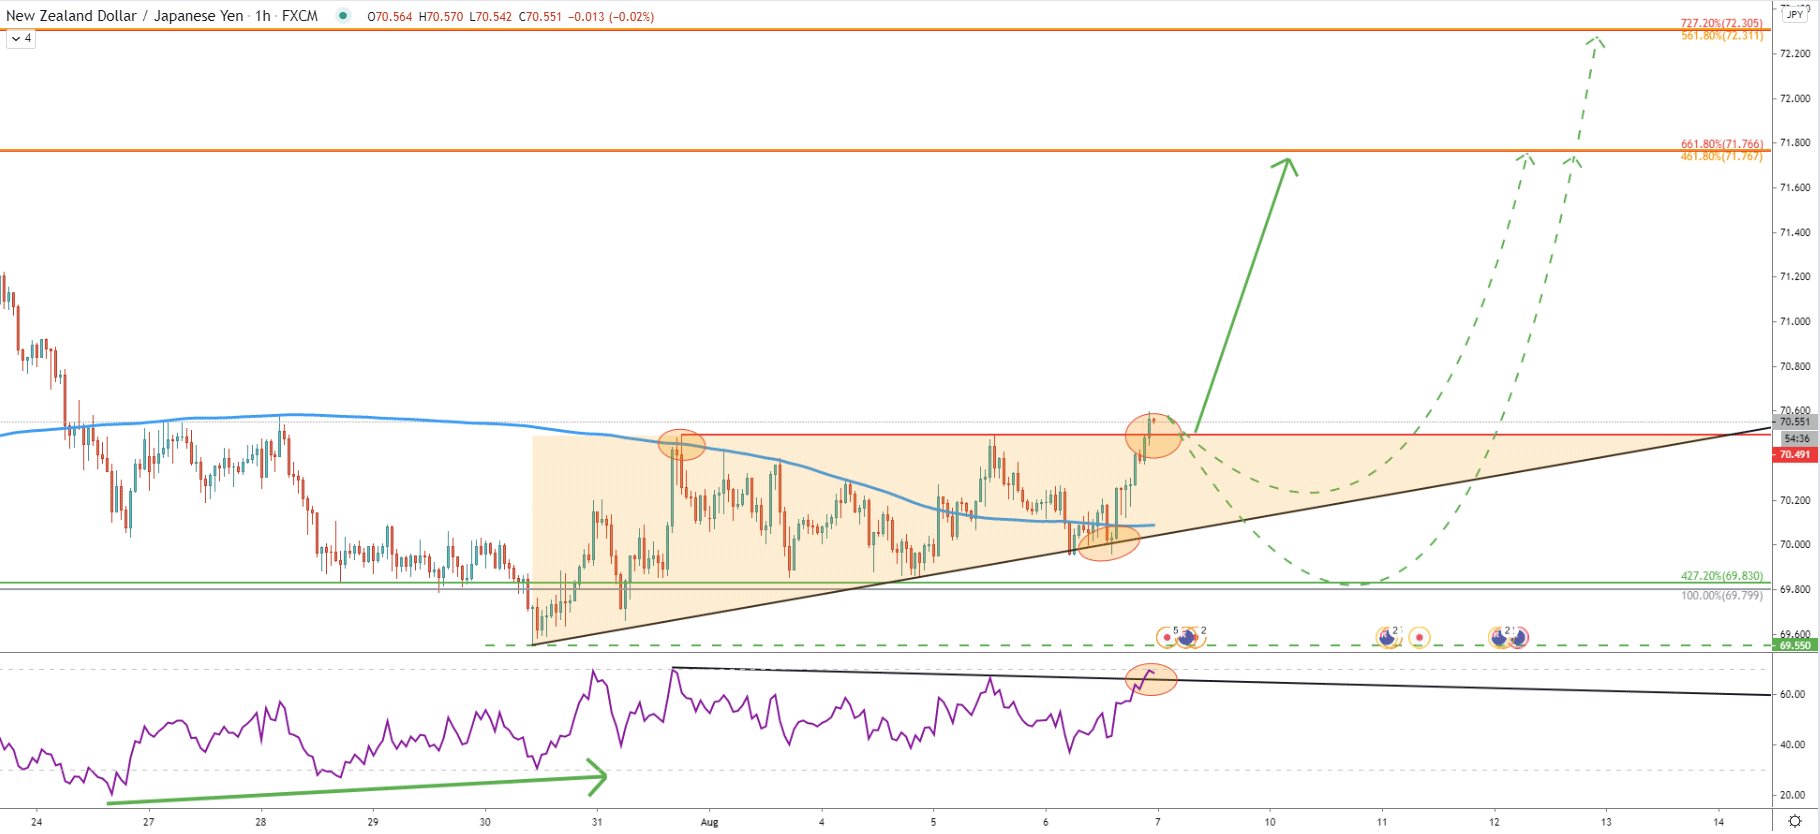
On the 1-hour chart, we can witness a short term consolidation phase, during which RSI oscillator has formed a bullish divergence while NZD/JPY formed a triangle pattern. Today price broke and closed above the triangle and RSI broke above the downtrend trendline. This is indeed a very bullish price action which might confirm the incoming NZD/JPY rally.
However, right now, the price might also correct down strongly before the rally begins. It might re-test either the uptrend trendline or even go as low as 69.83, which is 427.2% Fibonacci support.
NZD/JPY showing multiple confirmations of a strong uptrend, which could have just started. This might be a long term uptrend continuation, but considering the rejection of the downtrend trendline on the daily chart, at least one strong wave to the upside can be expected. In this scenario, price is expected to produce a triple top near the previously formed resistance area.
Based on three different Fibonacci retracement levels, the first key resistance is seen at 71.76, which goes in line with the uptrend trendline resistance as per the 8-hour chart. If the first resistance will get broken, next upside target is seen at 72.30 confirmed by 2 Fibs.
As per the 16-hour chart, the key support level is seen at 69.55. Daily break and close below will immediately invalidate bullish outlook and most likely NZD/JPY will confirm the trend reversal to the downside. The next and the nearest support is seen between 68.18 and 68.54 as per two Fibonacci support levels.
Support: 96.55, 68.18
Resistance: 71.76, 72.30