
Published: May 21th, 2020
In our previous analysis we have looked at the EUR/NZD currency pair, which is highly correlated to the NZD/CHF. The main point is that NZD is getting strong, against both, the Euro and the Swiss Frank. Right now, there seems to be a very interesting timing to act, as NZD/CHF is confirming a potential trend reversal from a downtrend to an uptrend.
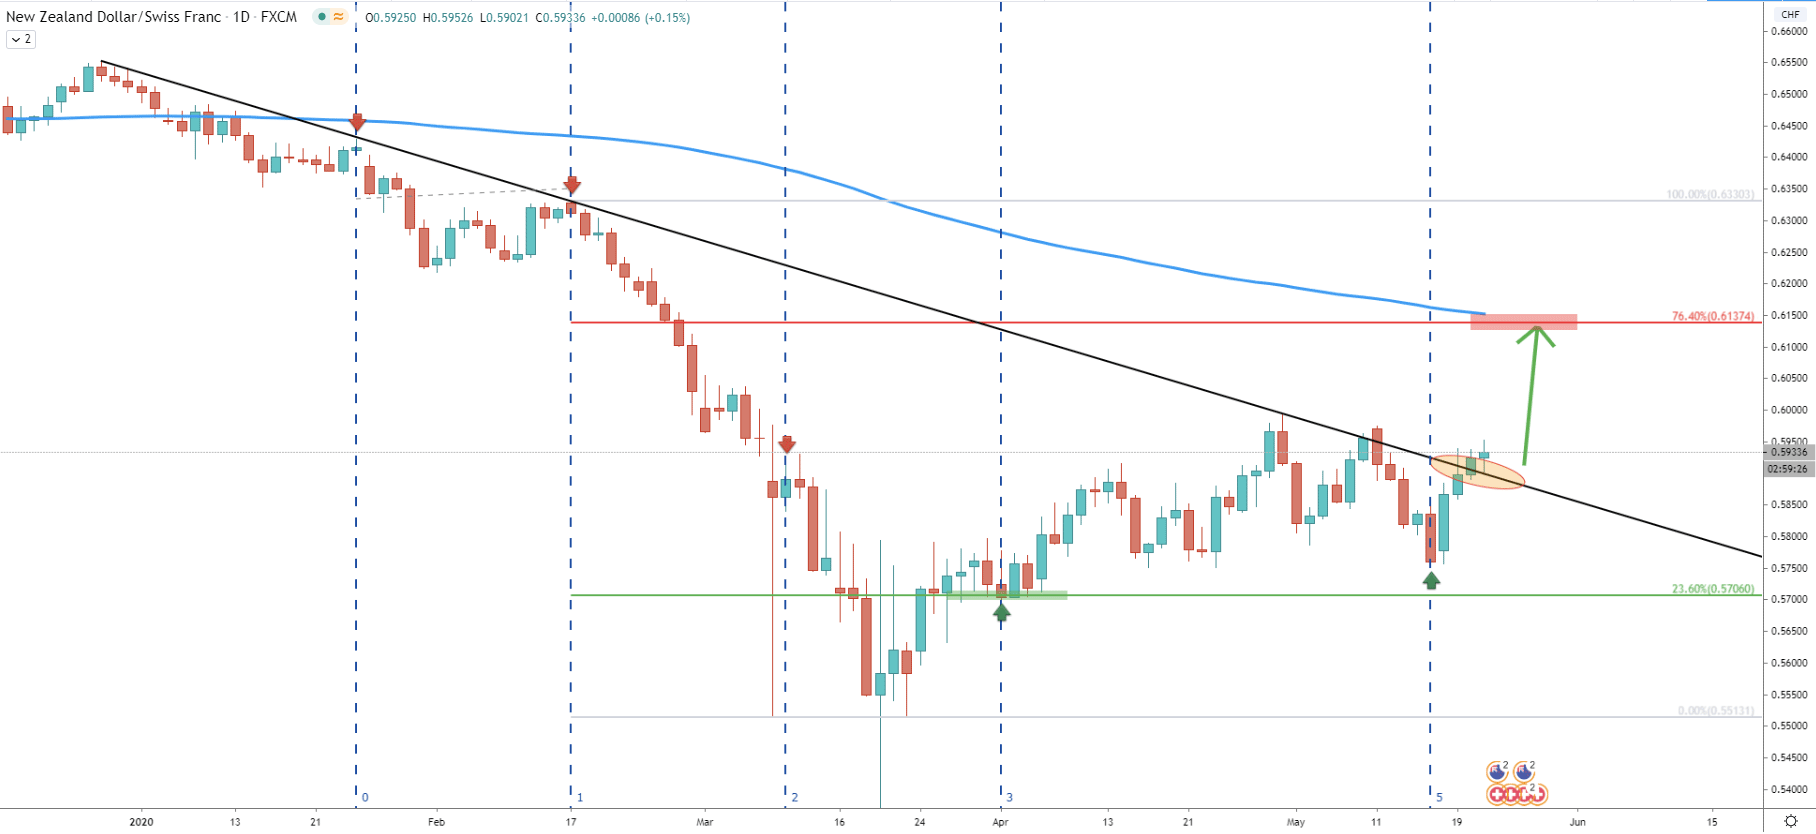
On the Daily chart we can observe the downtrend trendline breakout, which happened just yesterday. We have applied the Fibonacci cycles indicator through the last two bounces off the trendline. It shows that previous cycle has started on April 1, after the rejection of the 23.6% Fibonacci retracement level at 0.5706. The current cycle, which has followed, has started just 4 days ago when NZD/CHF reached 0.5757 low. It certainly looks that the news cycle could have triggered the beginning of a strong growth, which might push the price up to 0.6137. This is a resistance level confirmed by 76.4% Fibonacci retracement level as well as the 200 Exponential Moving Average.
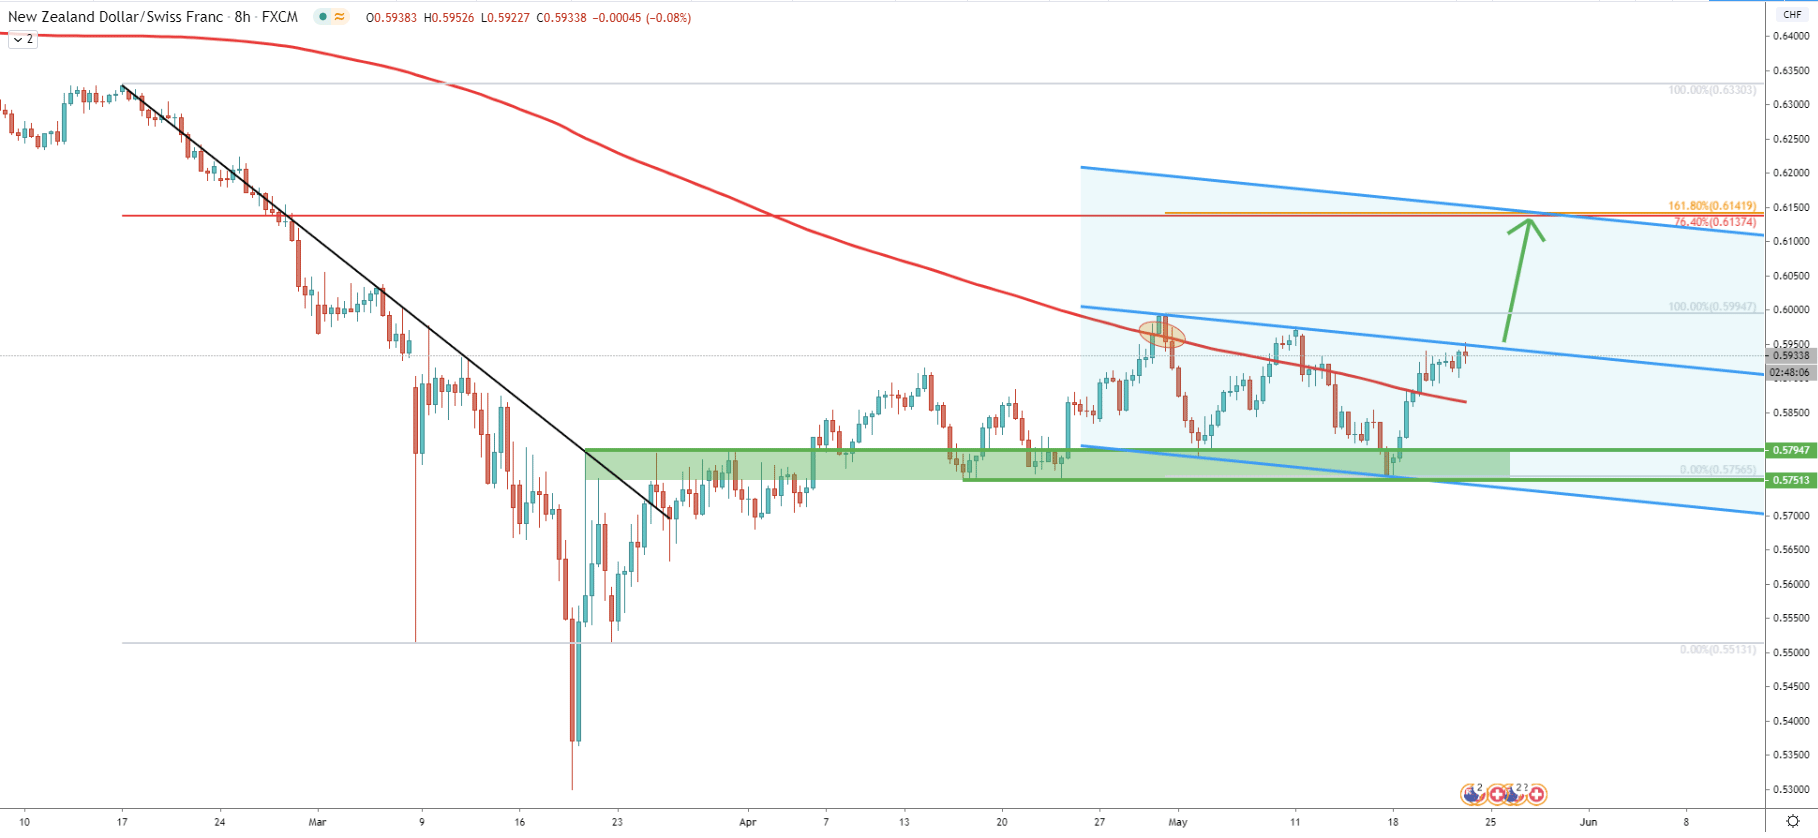
On the 8-hour chart another downtrend trendline was applied, and yet again we see a break above. The breakout point has been spotted at 0.5795, which was the last bounce off the trendline. After the breakout, the consolidation phase has been initiated and the price moved sideways for over a month. Clearly, the support area has been found between the 0.5750 and 0.5795, from where the price was bouncing off systematically. However, while range-trading was ongoing, NZD/CHF managed to break and close above the 200 Simple Moving Average, which can be interpreted as the beginning of a potential bull run. Nevertheless, NZD/CHF continued to consolidate, this time within the descending channel. Right now, the price has approached the top of the descending channel, and 8H break and close above should finally confirm the uptrend.
Upon the breakout, NZD/CHF is expected to move towards 0.6140 area, which corresponds to two Fibonacci levels, first being 76.4% as per the Daily chart, and second, being 161.8% retracement level. This is the retracement of the Fibs applied to the corrective wave down, after breaking the 200 EMA. What we can see, is that the upside target also corresponds to the upper trendline of the extended descending channel, adding more importance to this upside target.
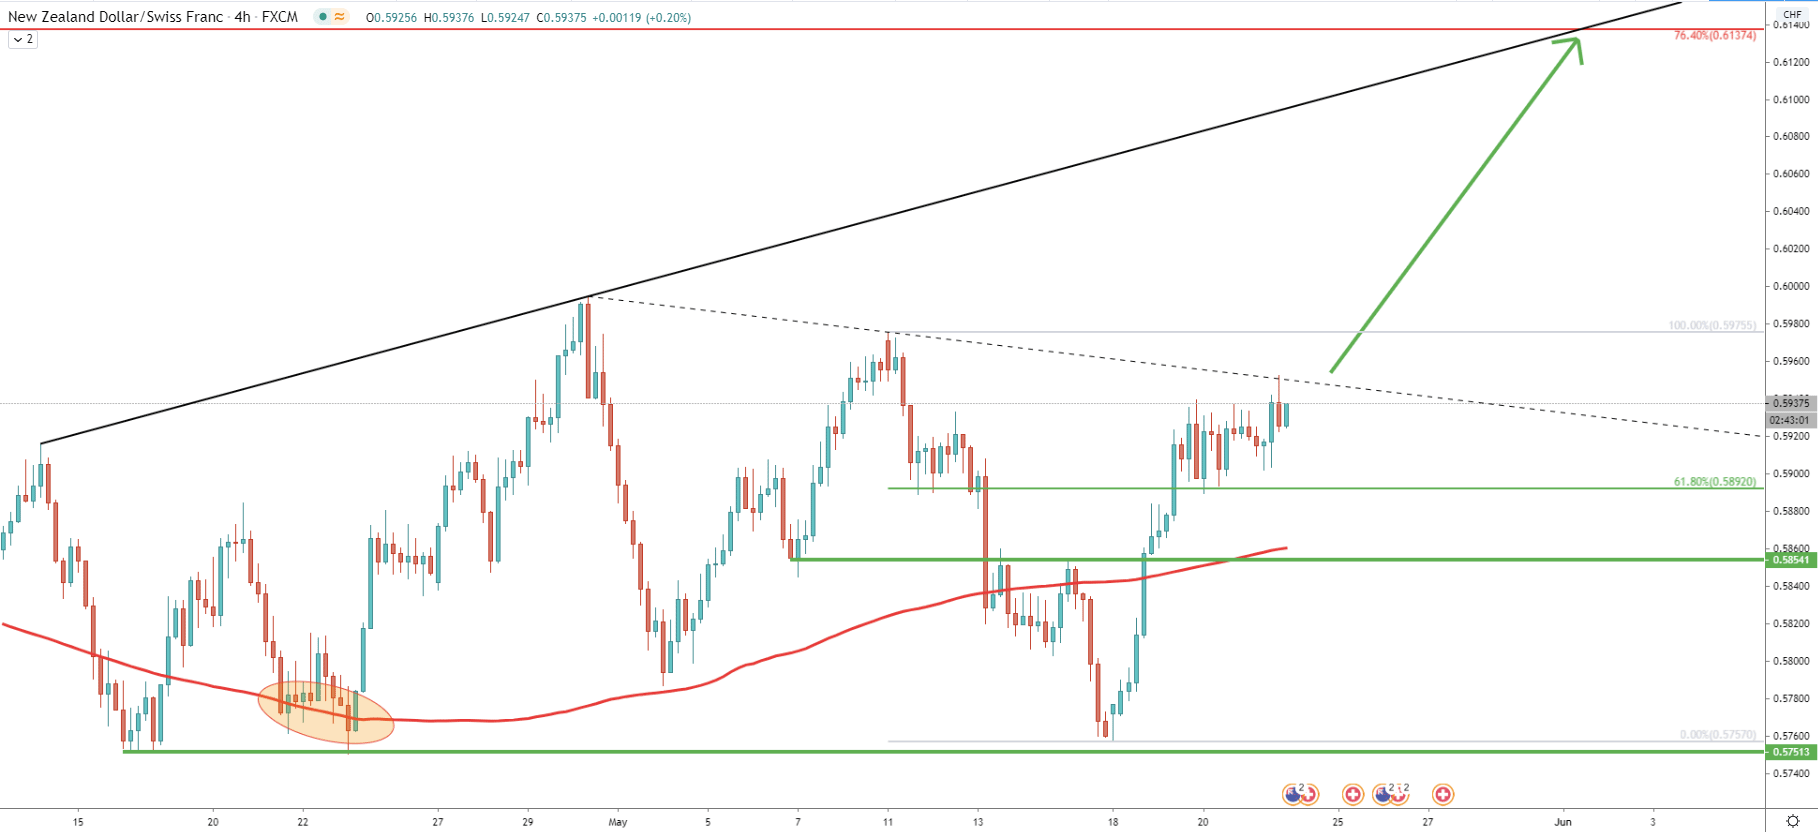
On the 4 hour chart the support at 0.5750 area is very obvious, we can also see the rejection of the 200 SMA back in April. Fibs applied to the last wave down show that 61.8% resistance level at 0.5892 has been taken out, and during the past few days it has acted as the support. On the other hand, we have the downtrend trendline which is being rejected, and as with the descending channel, there must be a break below the trendline to initiate the upside move. Perhaps this will happen within the shortest period of time, potentially today or tomorrow. When/if this occurs, NZD/CHF should rise by 200 pips, towards 0.6137, which on this chart corresponds to the resistance uptrend trendline.
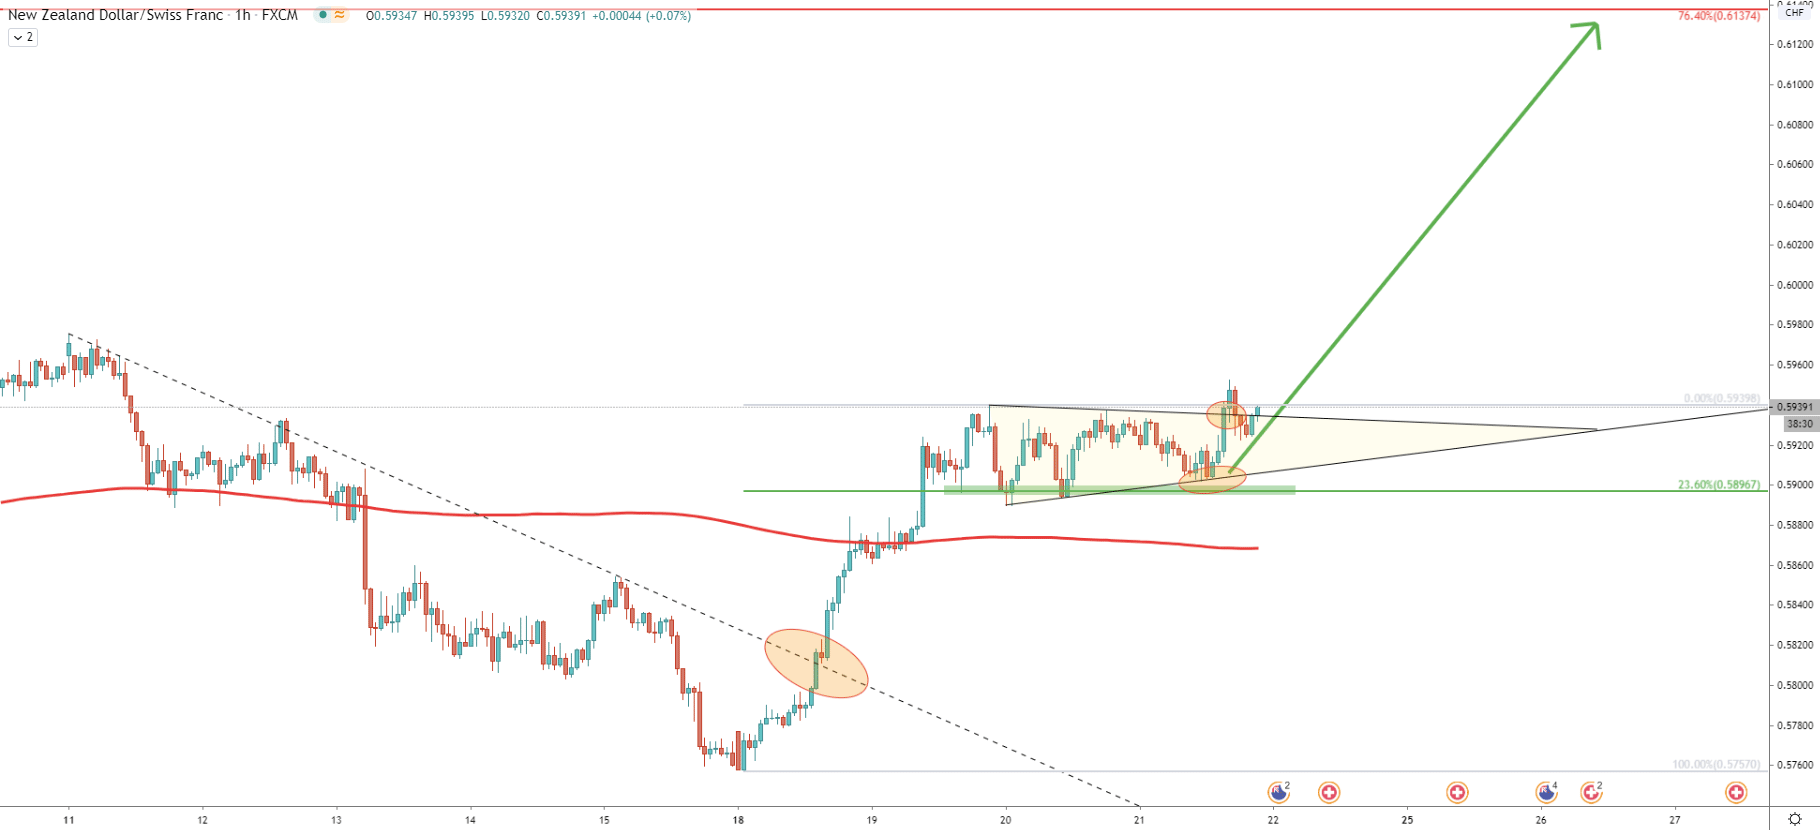
Disregarding the resistance seen at the 8H and 4H charts, on the 1H chart NZD/CHF already broke above the downtrend trendline. In fact, it broke above the triangle pattern, which by many, could be considered as a buy signal. Therefore, the price can start rising at any point as long as the 0.5897 support holds. On the lower timeframe, this support is confirmed by 23.6% Fibs and it clearly has been respected by all market participants.
Recently NZD/CHF started a new cycle based on the Fibonacci cycles indicator. After which price has gone up quite strongly. On the lower timeframe, the pair already confirmed the beginning of the uptrend continuation. However on higher timeframes, the price must break and close above the most recent resistance at 0.5953 to confirm strong bullish sentiment.
Based on multiple Fibonacci retracement levels as well as the 200 EMA, the upside target is located at 0.6137, although this is only the nearest point of resistance. If there will be a clean break and close above, on the Daily and Weekly timeframes, NZD/CHF might prove that the long term uptrend has begun.
The nearest support is seen at 23.6% Fibs, which is 0.5896. Break and close below this price on the 1H chart will invalidate bullish outlook and NZD/CHF should be exected to re-test 0.5757 support.
Support: 0.5897, 0.5706
Resistance: 0.5953, 0.6137