Published: April 3rd, 2020
Since the beginning of the “Financial Crysis”, NZD/CHF has been very weak and during the past 3.5 months lost nearly 20%. This is a huge drop in price when it comes to fiat currencies. Many are wondering whether such volatility and sharp price movement will continue. For now, it seems like the correctional phase has been initiated across the forex market. Let’s have a look at NZD/CHF on 4 timeframes to see what can happen in the coming weeks.
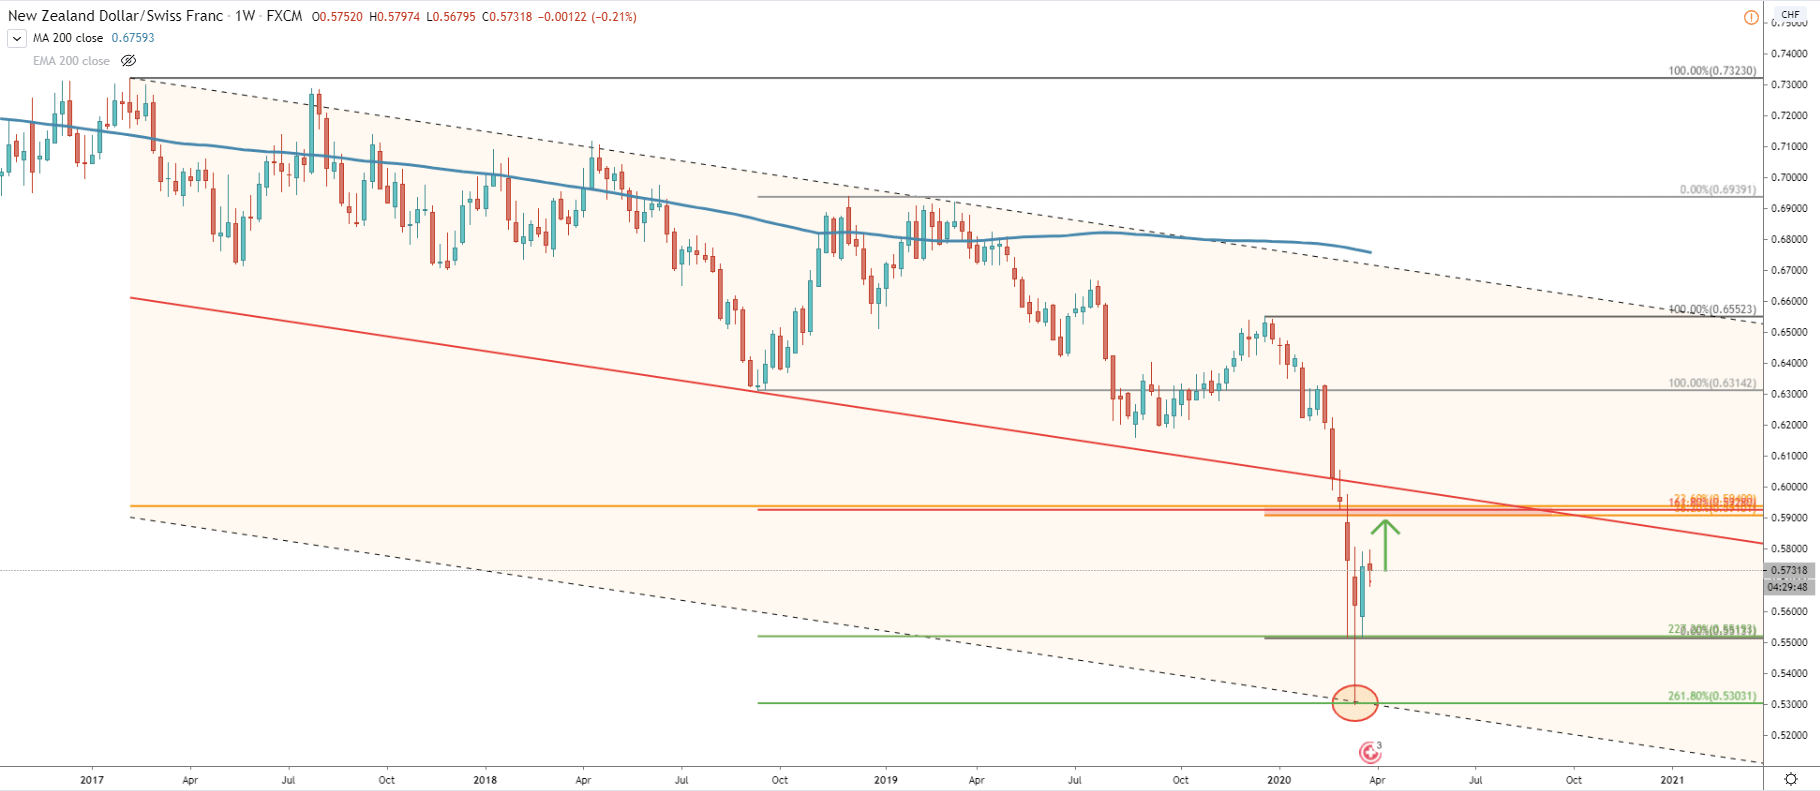
On the Weekly chart price has reached the bottom of the extended descending channel and at the same time 261.8% Fibonacci retracement level. The Fibonacci level was rejected cleanly while prie produced a huge spike down on a weekly chart. At the same time, the 227.2% retracement level was also rejected, although price produced a spike down, where it tested a 261.8% level. Such price actions suggest that there a strong pullback can be expected.
You can see 3 different Fibonacci retracement level pointing to the 0.5900-0.5940 price area. This could be the key resistance level for NZD/CHF and if/when reached must be watched closely for either rejection of a break above.
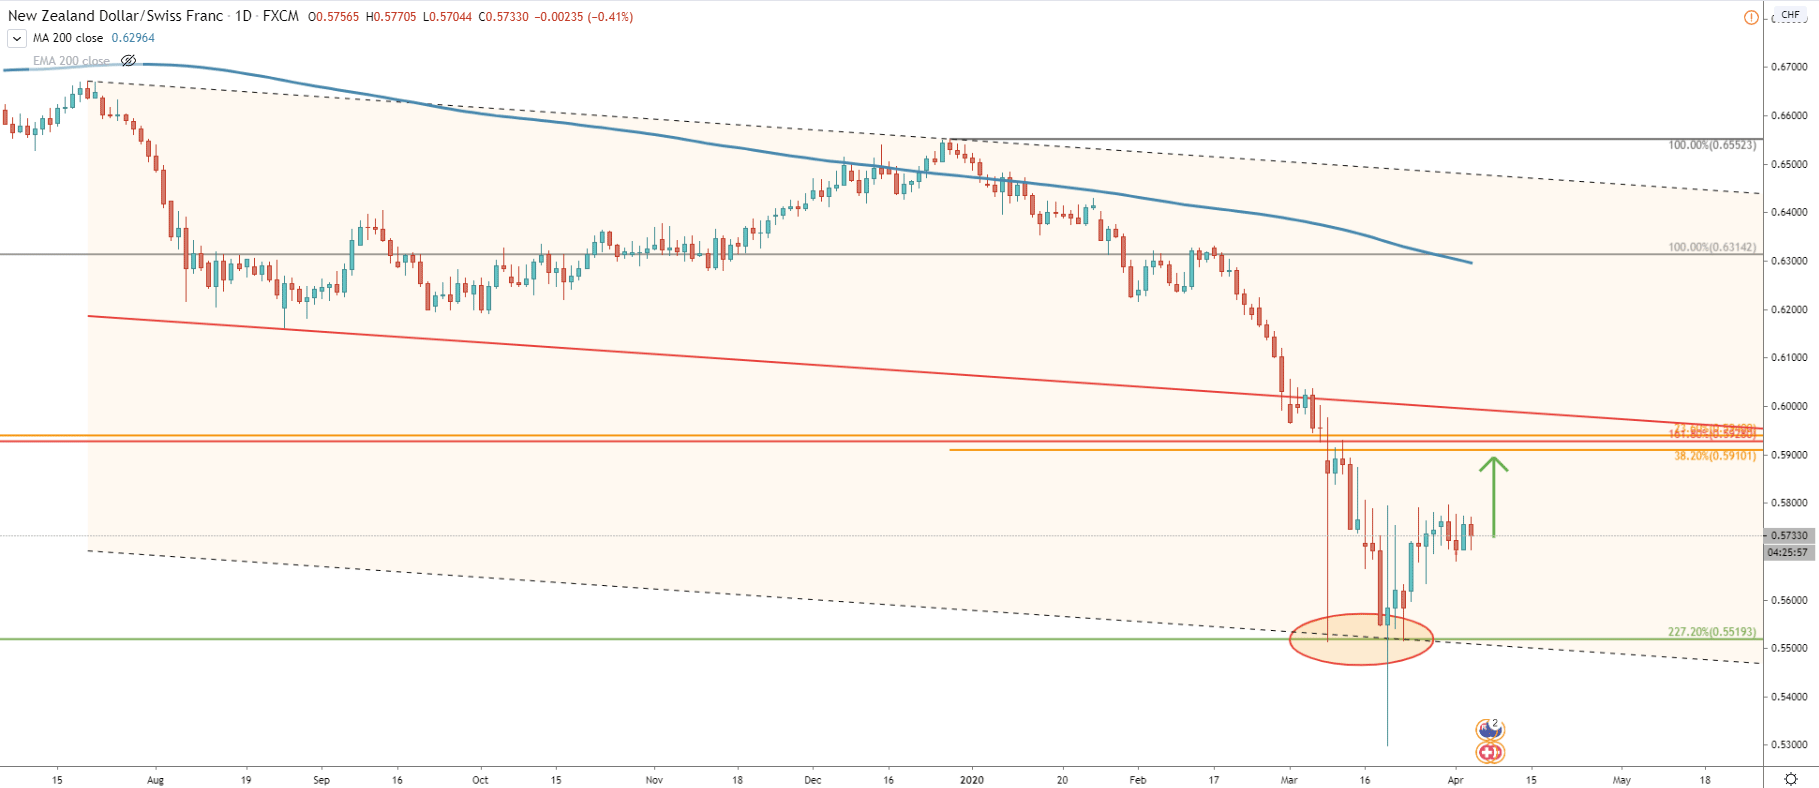
On the Daily chart, we have applied another descending channel. Yet again price has reached and rejected to lower trendline of the extended channel. We can also see a clean bounce off the 227.2% Fibs, occurred on March 23.
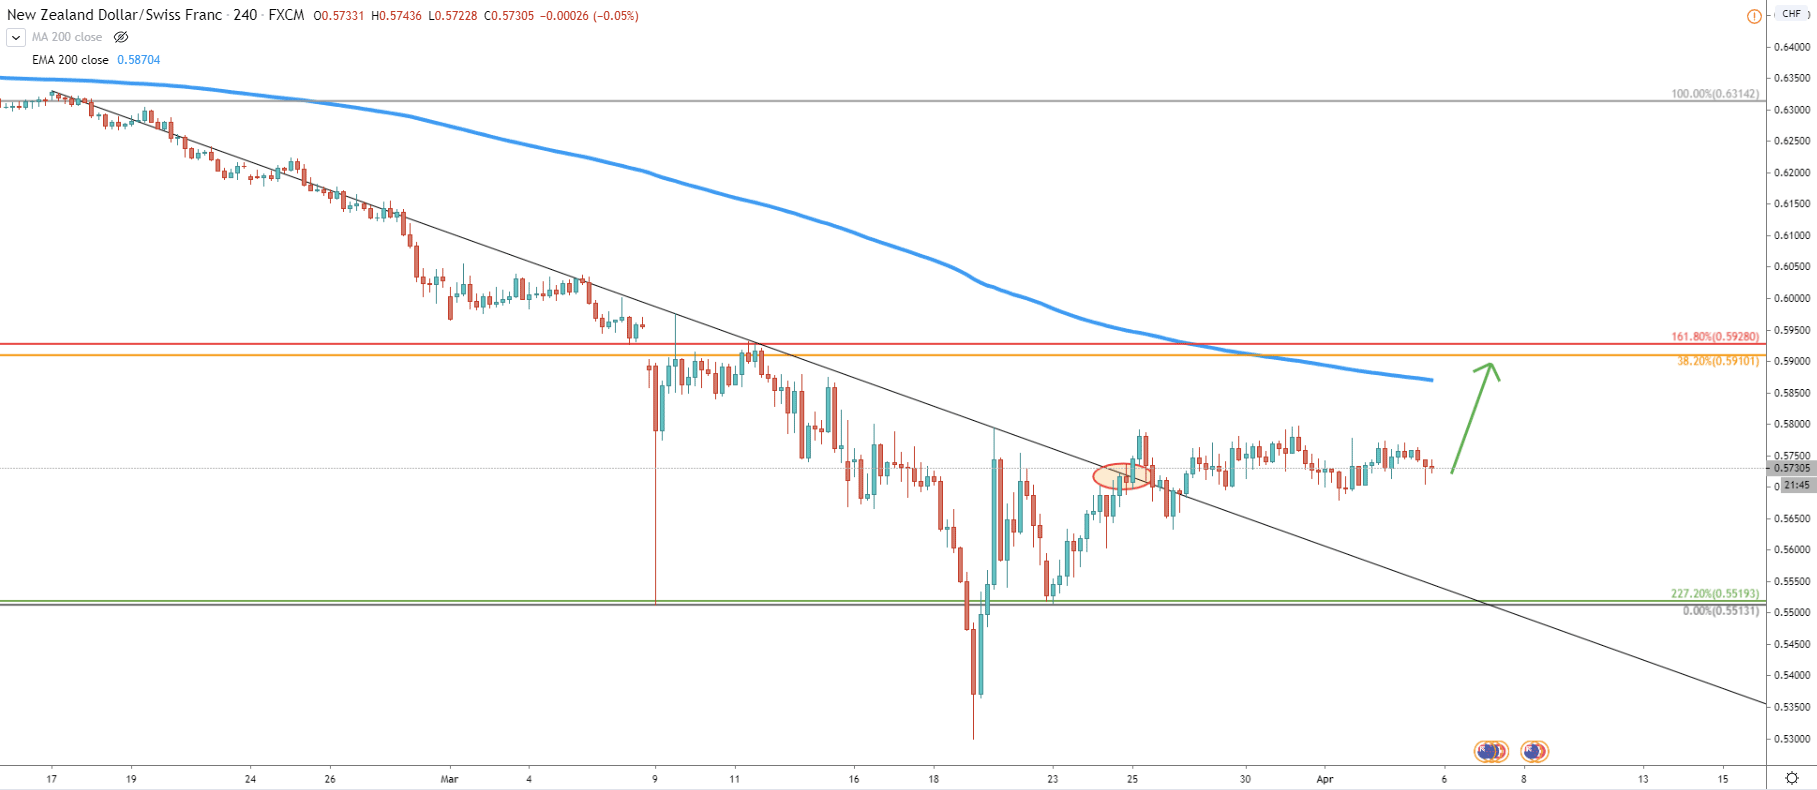
The 4H chart shows that the downtrend trendline has been broken after which price has been consolidating between 0.57 - 0.58 price areas for 8 consecutive trading days. While consolidation has been quite long, soon we can expect an impulsive wave and most likely it will be heading north. The Fibonacci targets also correspond to the 200 Exponential Moving Average and can be reached in a relatively short period of time.
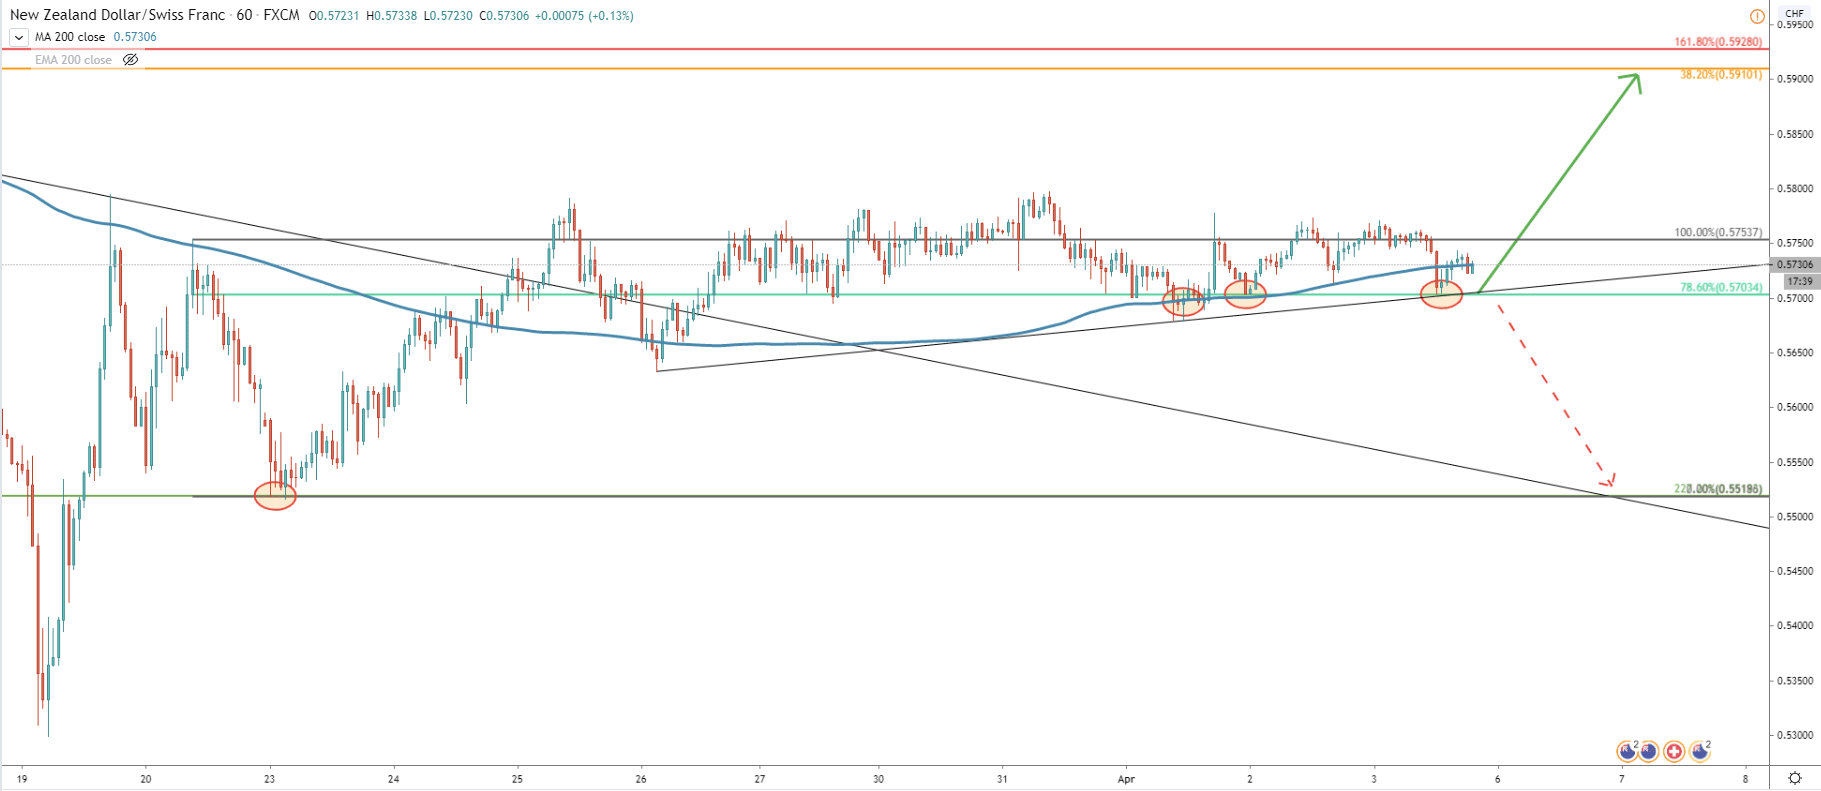
Perhaps the 1H chart holds the most information on the upcoming price action. We can see that price rejected 78.6% Fibonacci support level (previously a resistance). In fact, it has been rejected cleanly twice along with the 200 Exponential Moving Average. It makes 0.5700 a key support level, not only technical, but also a psychological. Finally, the uptrend trendline was also rejected cleanly today, and this might be the very beginning of the coming swing up for NZD/CHF. Our previously observed upside target area, also corresponds to 161.8% Fibonacci retracement level, applied to the corrective wave down when 227.2% Fibs were rejected.
NZD/CHF has reached the support level in the form of rejection of the lower trendline of two descending channels and 2 Fibonacci retracement levels. This can result in further correction to the upside.
While there is no clean resistance level, there is certainly a resistance area confirmed by multiple Fibonacci levels. As has been mentioned already, this area is located between 0.5900 and 0.5940
We should also consider the major trend, which remains extremely bearish. Therefore, going against the trend can be quite tricky and very risky at the same time. The first sign of the potential downtrend continuation would be a break and close below the uptrend trendline as well as 0.5700 support level. If 1h and 4h candles will manage to close below both of these indicators, risk of the downtrend will become very high. In this case, NZD/CHF price weakness might continue and even produce a new lower low on the weekly chart.
Support: 0.5700, 0.5518
Resistance: 0.5810, 0.5900, 0.5930, 0.5940