
Published: September 1st, 2020
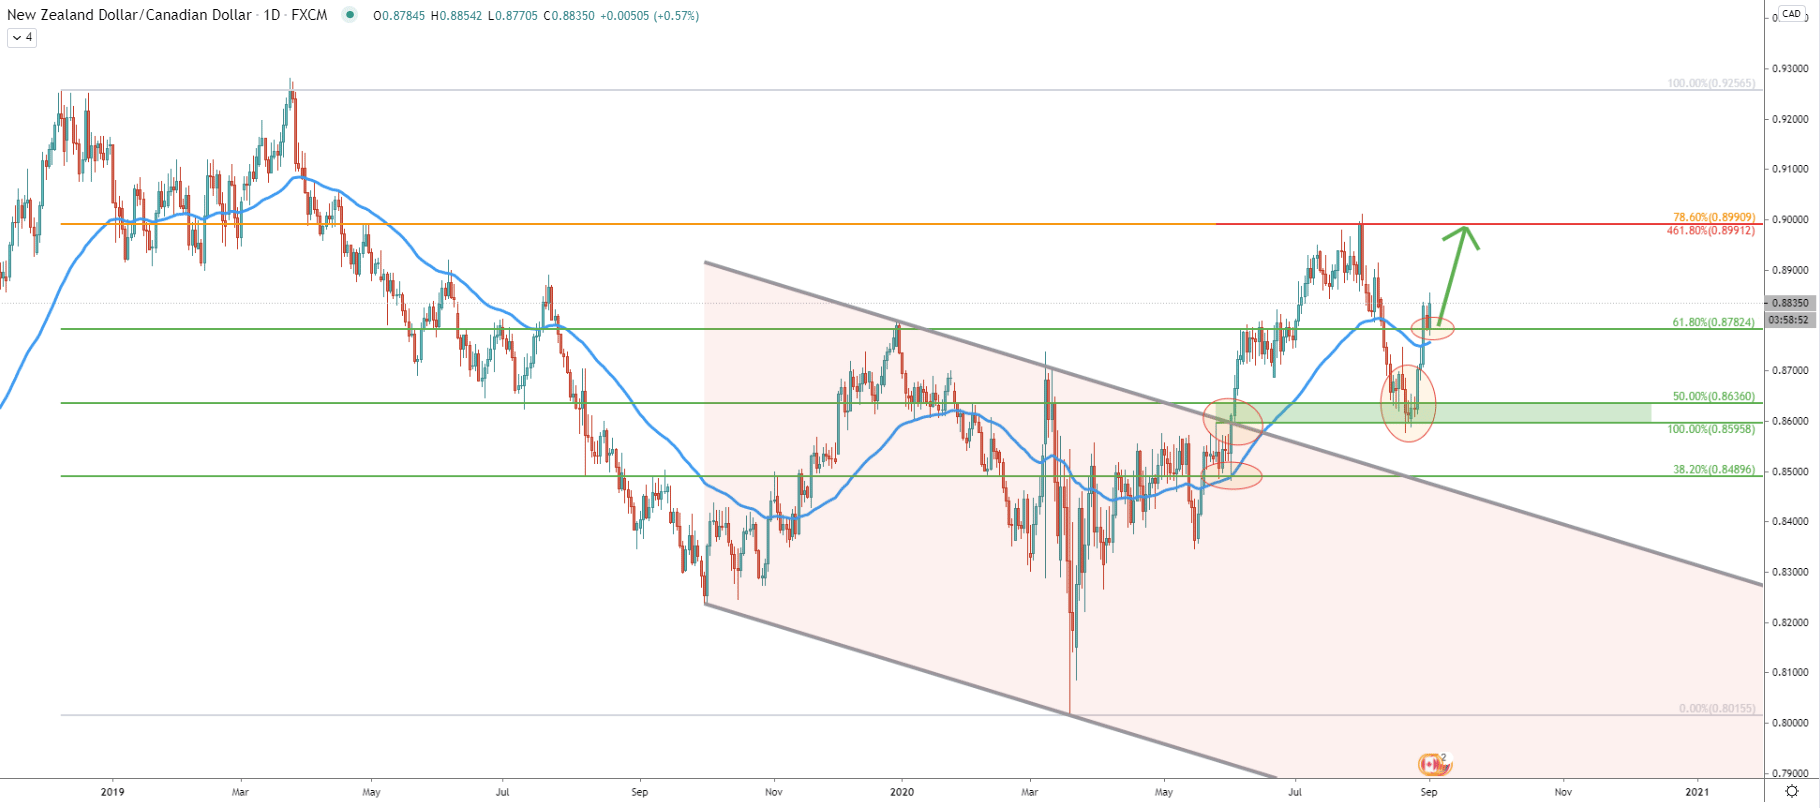
By looking at the NZD/CAD Daily chart, we can witness how the downtrend is turning into a bullish trend. After testing the 0.8015 low back in March, the price has been consistently rising rejecting multiple Fibonacci support levels. The very first rejection was of the 0.8489, which is 38.2% Fibs applied to the overall downtrend. Not only price bounced off the Fibs support but also the 50 Exponential Moving Average, after which price went up and broke above the descending channel.
This has resulted in a strong upside move where NZD/CAD rejected the 0.8990 resistance confirmed by two Fibs. First is the 78.6% Fibs applied to the overall downtrend, and second is the 461.8% Fibs applied to the corrective wave down where 0.8489 support was rejected.
Then price corrected down and found the support at 0.8636 area, where the 50% retracement level is located. After, the price went up and broke above the 50 EMA, and today formed the support at 0.8782, which is a 61.8% Fibonacci support level. As long as this support holds, NZD/CAD is highly likely to re-test the 0.8990 resistance within several trading days, or perhaps sometime next week.
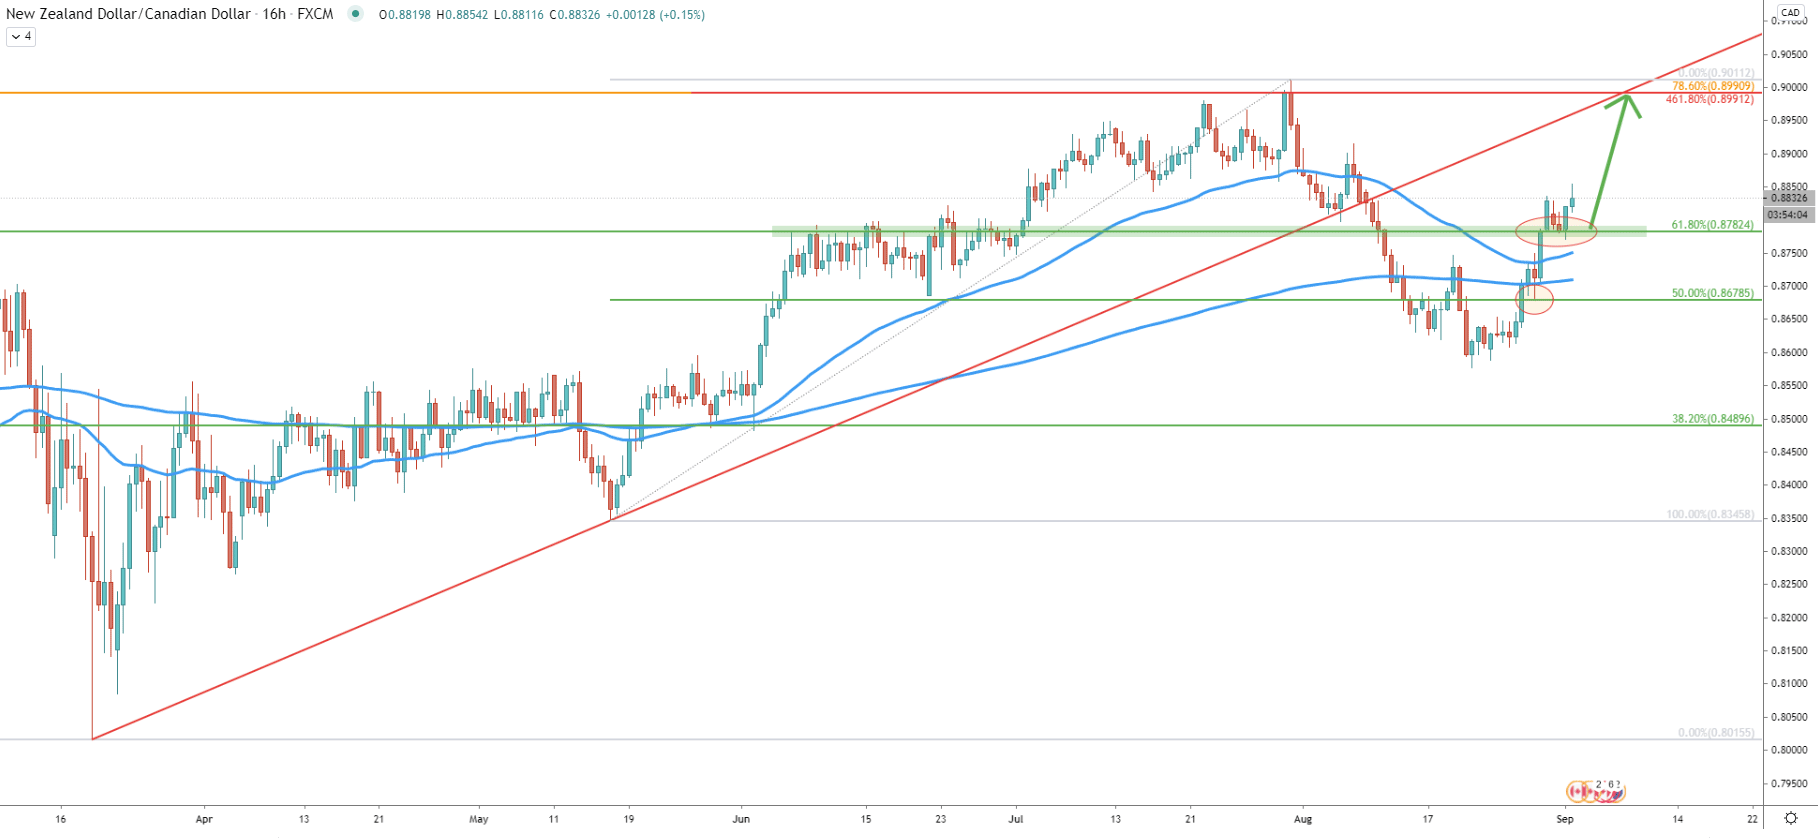
Fibonacci retracement indicator was applied to the last upside move, which occurred between May and August. The 50% Fibs at 0.8678 has been rejected cleanly prior to the price breaking above 50 and 200 Exponential Moving Average. Currently, the 0.8782 support is being defended by buyers and this is yet another confirmation of the potential upside move.
The average-price uptrend trendline is crossing the key resistance at 0.8990 on September 7, which means that the upside target could be reached within just 4 trading days.
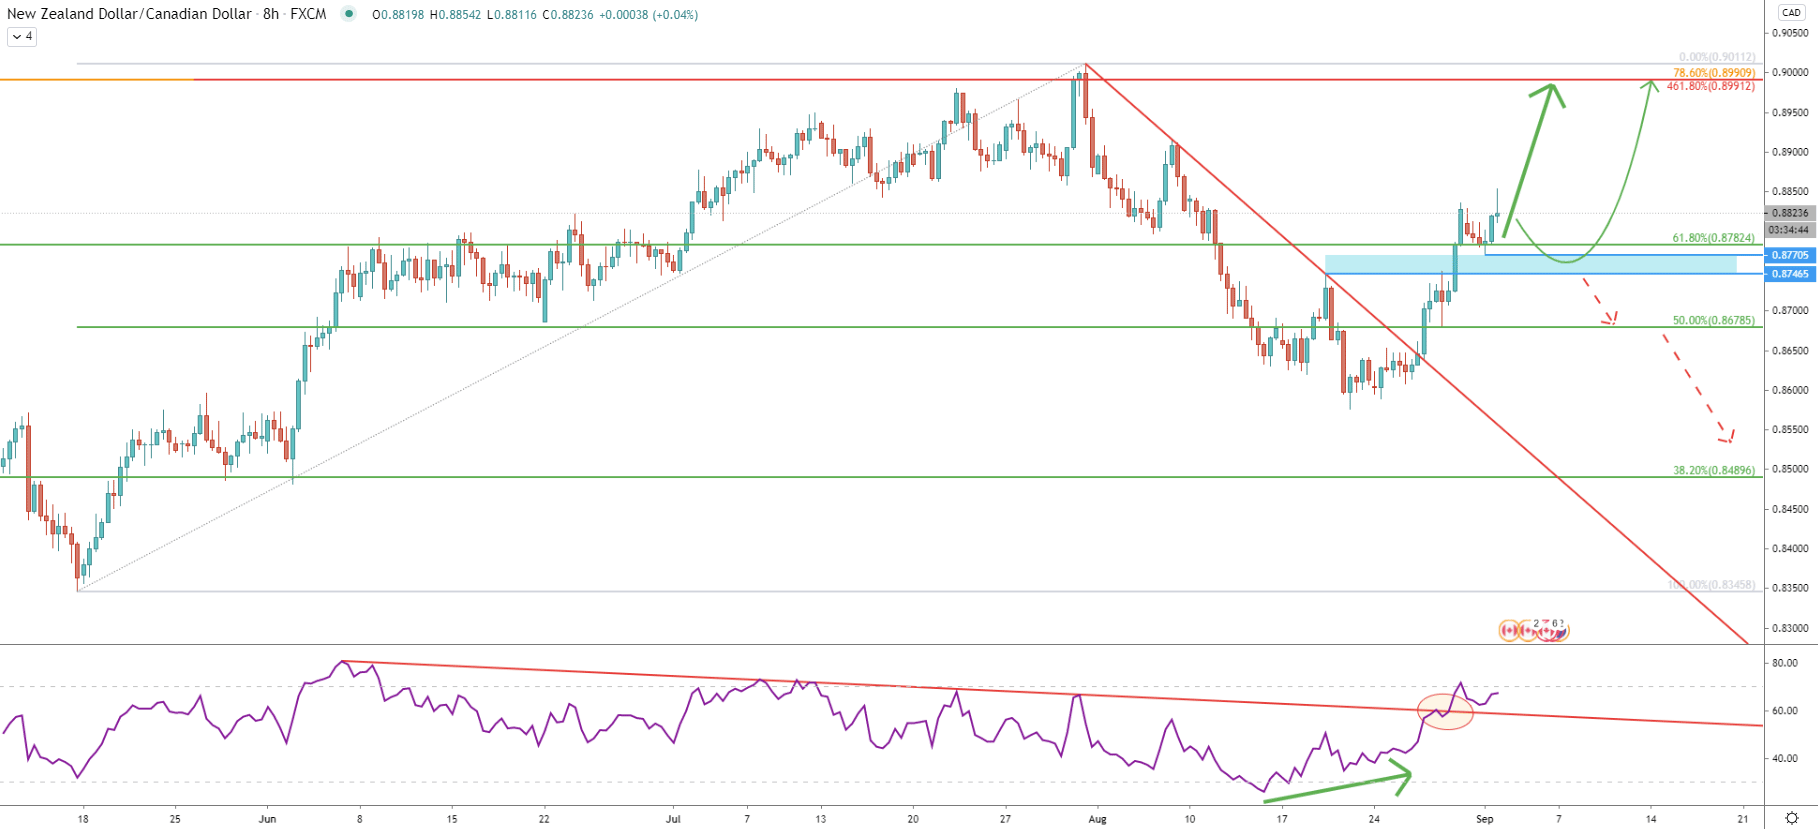
On the most recent corrective move down, the RSI oscillator formed a bullish divergence and then broke below the downtrend trendline. NZD/CAD also went up and broke the downtrend trendline. Currently, the support area is located between 0.8746 and 0.8770, where NZD/CAD price can drop prior to the upside move. However, a daily break and close below 0.8770 will invalidate the bullish outlook and the pair might move towards 0.8678 or 0.8489 support level.
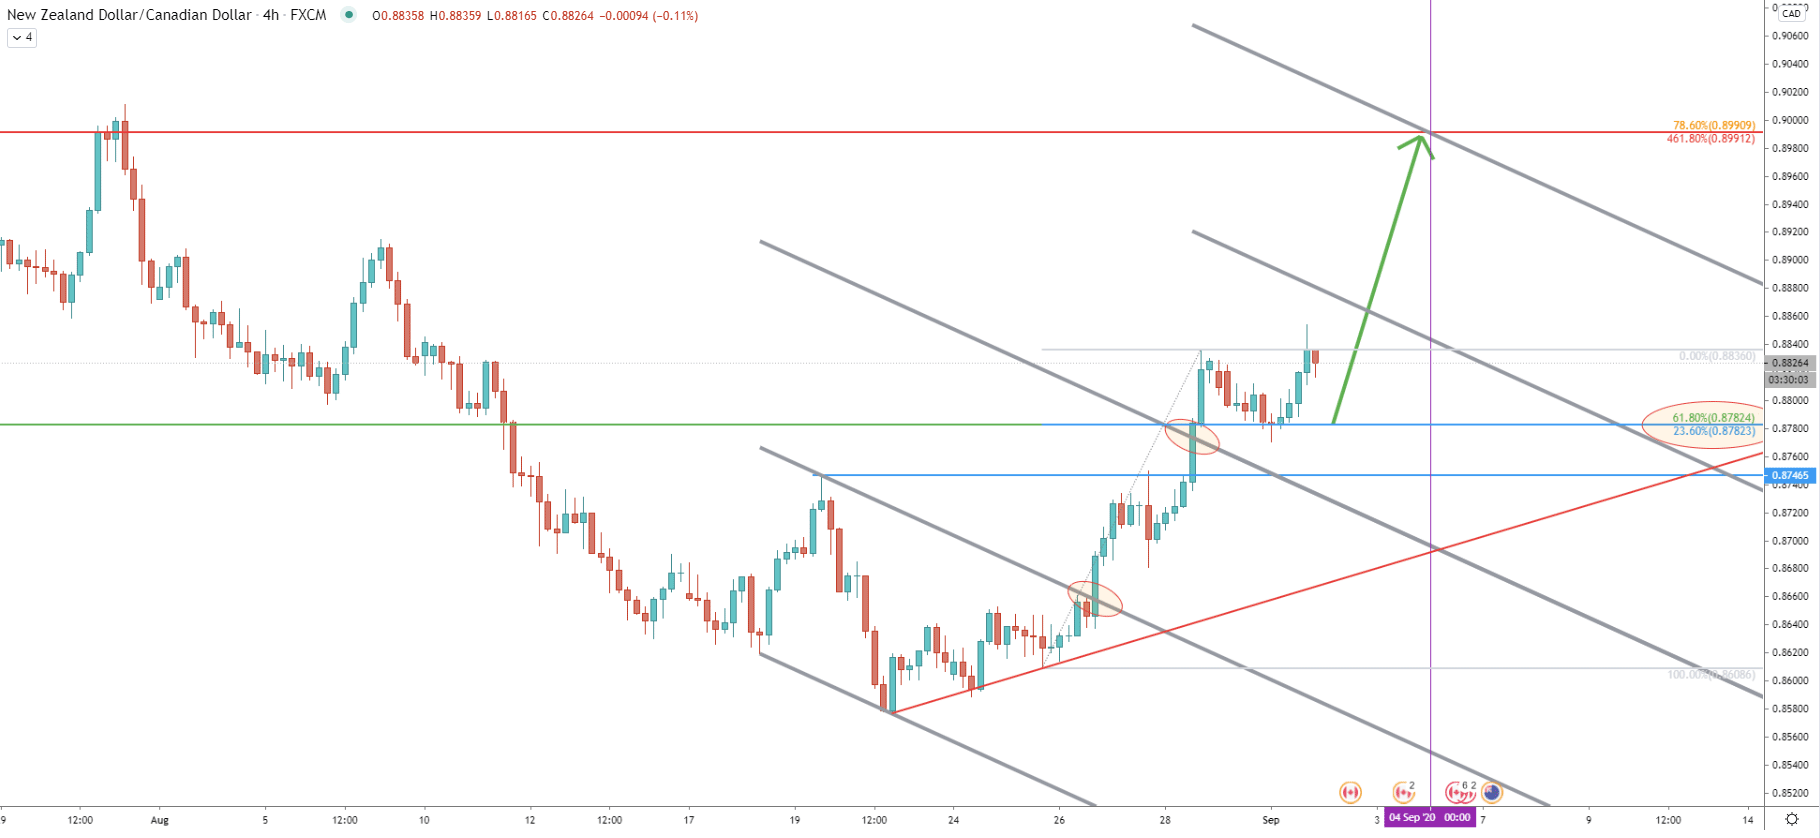
On this chart, the descending channel has been extended four times. The original channel and the first extension of the channel were both broken. Today NZD/CAD has rejected the point of the extended channel breakout along with the 23.6% Fibs applied to the last wave up after rejection of the uptrend trendline. The 23.6% Fibs cleanly corresponds to the previously mentioned 61.8% Fibs and also corresponds to the breakout point of the extended descending channel. Clearly, there is massive support near 0.8770 and as long as the daily close remains above, uptrend continuation is imminent.
While on the previous chart the expected time till the end of the uptrend was 4 trading days, on this just it is only 3 trading days. This is because of the upper trendline of the extended descending channel crossing with the upside target on September 4. It would be reasonable to assume, that price might rise by over 100 within just 3 to 4 trading days.
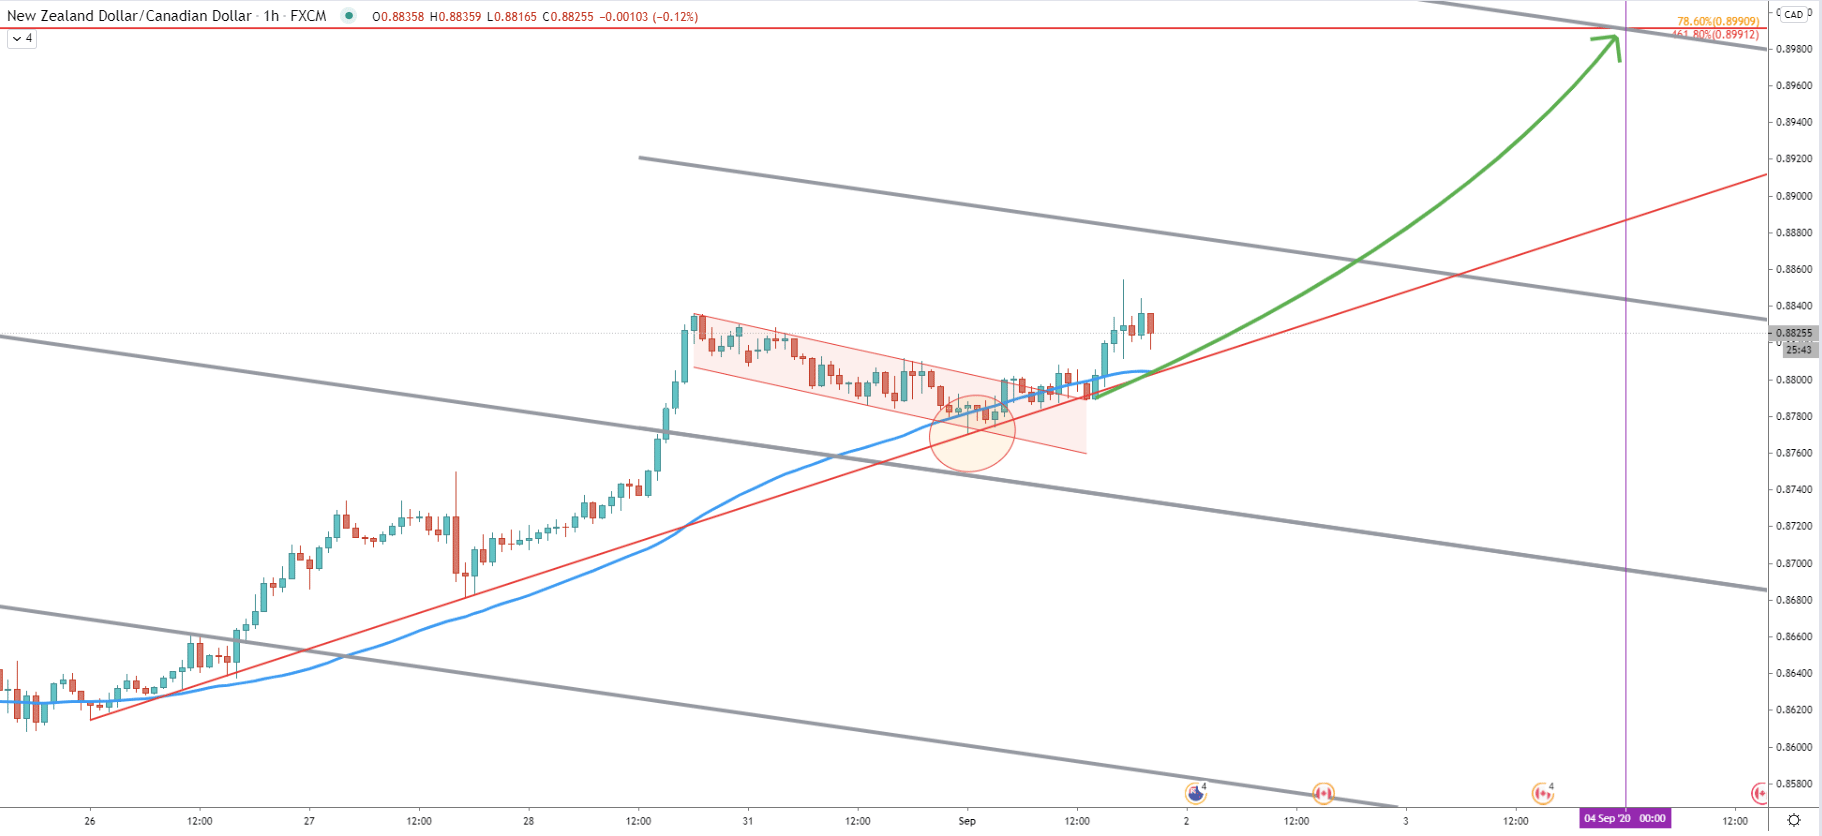
On the hourly chart, the price rejected the uptrend trendline along with the 200 Exponential Moving Average. Prior to that, NZD/CAD was forming a potential bull flag formation. Finally, it broke above the downtrend trendline of the flag, confirming strong bullish intentions. Perhaps we are witnessing the beginning of yet another, and perhaps final upside wave.
NZD/CAD long term trend remains bullish. Today pair rejected Fibonacci support, uptrend trendline, and 200 EMA while forming and then breaking above the bull flag pattern on the hourly chart. This is a clear indication of a potential incoming short term uptrend.
As per the daily chart, there is only one key resistance level, which could be considered as the nearest upside target. It is located just over 100 pips away from the current price, at 0.8990, and confirmed by two Fibonacci retracement levels. Based on the trendline and the channel crossing with the resistance level, the target could be tested within just 3-4 trading days.
Daily break and close below 0.8770 will immediately invalidate the bullish forecast and most likely will result in a trend reversal, pushing price down towards one of the support levels as per the 8-hour chart.
Support: 0.8782, 0.8770, 0.8746
Resistance: 0.8836, 0.8990