
Published: September 7th, 2020
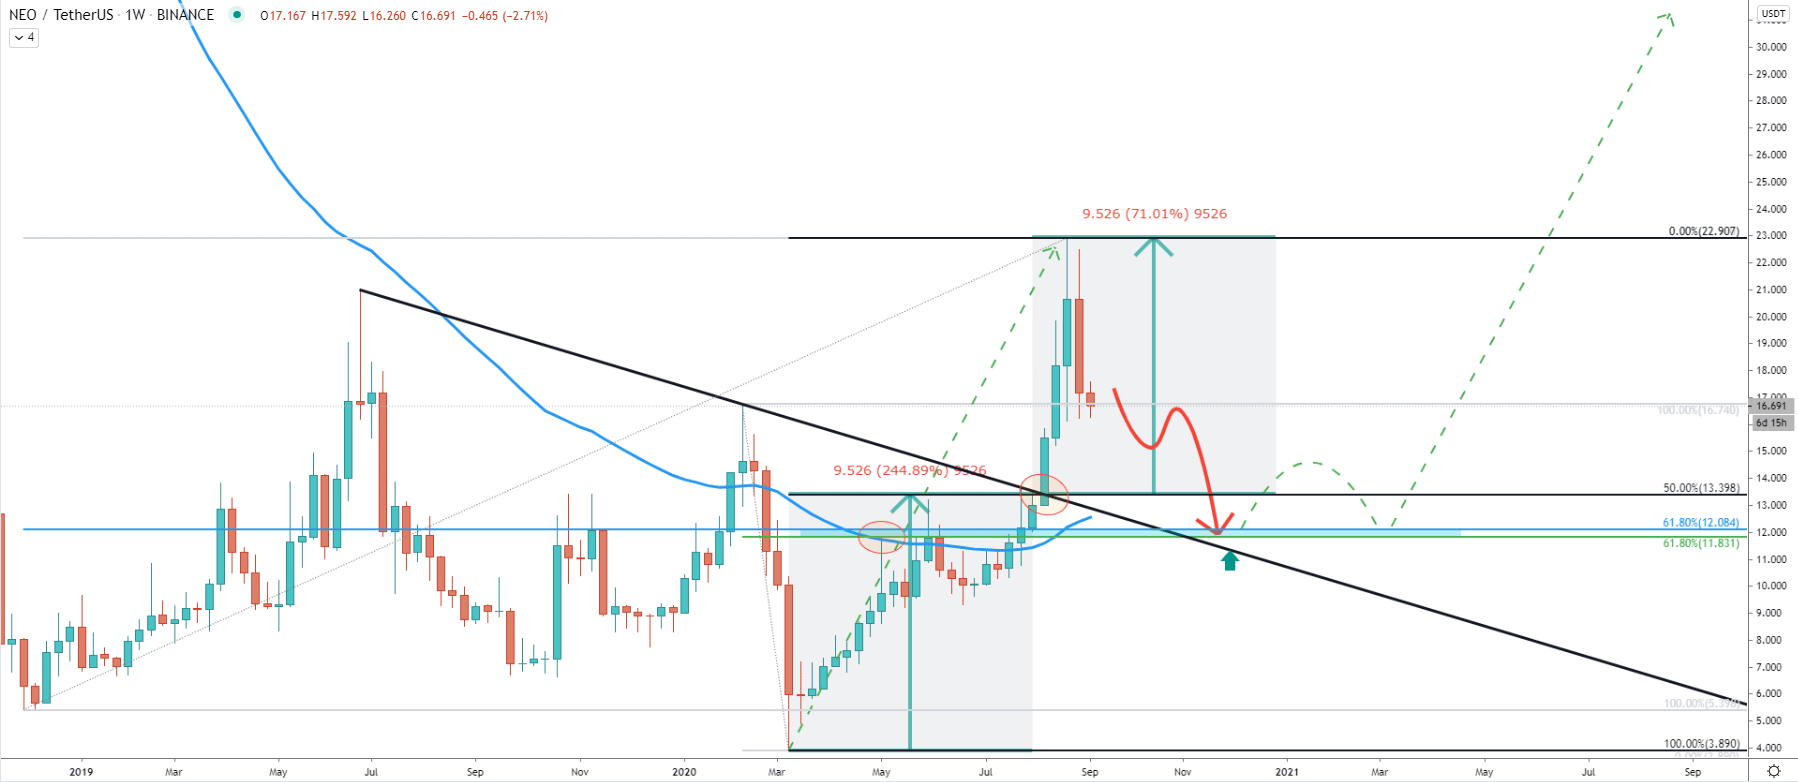
On the weekly chart, we might have witnessed the beginning of a long term uptrend, considering the breakout of the 50 Simple Moving Average along with the downtrend trendline. After the trendline break NEO reached the 22.90 high, while cleanly rejecting the upside target at 0% Fibonacci retracement level. The Fibonacci was applied to the trendline breakout point to show that the uptrend distance between the bottom at 3.90 and the breakout point at 13.40 equal to the distance from the breakout to the top.
This might suggest that the 22.90 was the top of the uptrend and currently NEO/USDT has entered the downside correctinoal phase. This might result in the pride drop towards the 12.00 phycological support, which is confirmed by two Fibonacci retracement levels. Both are 61.8% Fibs, where the first was applied to the overall uptrend, and the second to the last wave down, where price bottomed out. Besides, this support area corresponds to the point where previously NEO rejected the 50 SMA.
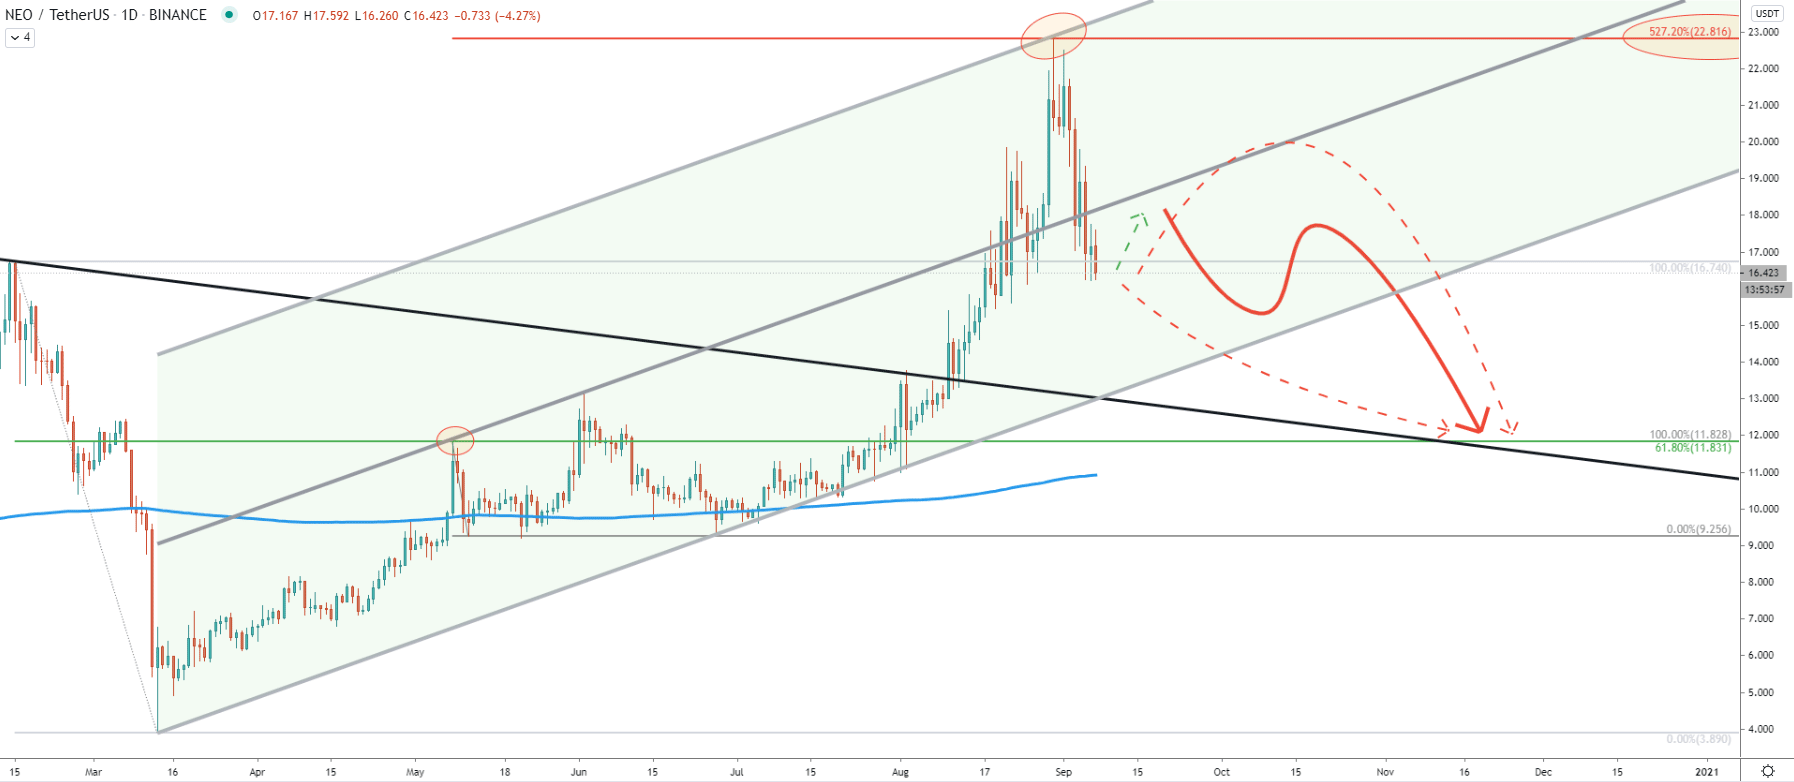
On the Daily chart price has been moving within the ascending channel up until this month. Then price broke above the upper trendline of the channel, hitting and cleanly rejecting the upper trendline of the extended ascending channel. Simultaneously, NEO/USDT bounced off the 527.2% Fibs applied to the corrective wave down after the breakout of the 200 SMA back in May.
This goes to show that 22.90 area was a very strong resistance, which bears defended perfectly. Such price action is suggesting that the correctional phase has been initiated and is likely to continue. However, there are multiple scenarios as to how the price might be going through the downside correctional phase. The least probable scenario is if NEO will continue moving down without any pullbacks. The second scenario suggests a small correctional move to the upside during this week, and only then the downtrend. And the third scenario is suggesting a strong pullback up, where NEO might re-test the middle trendline of the extended ascending channel.
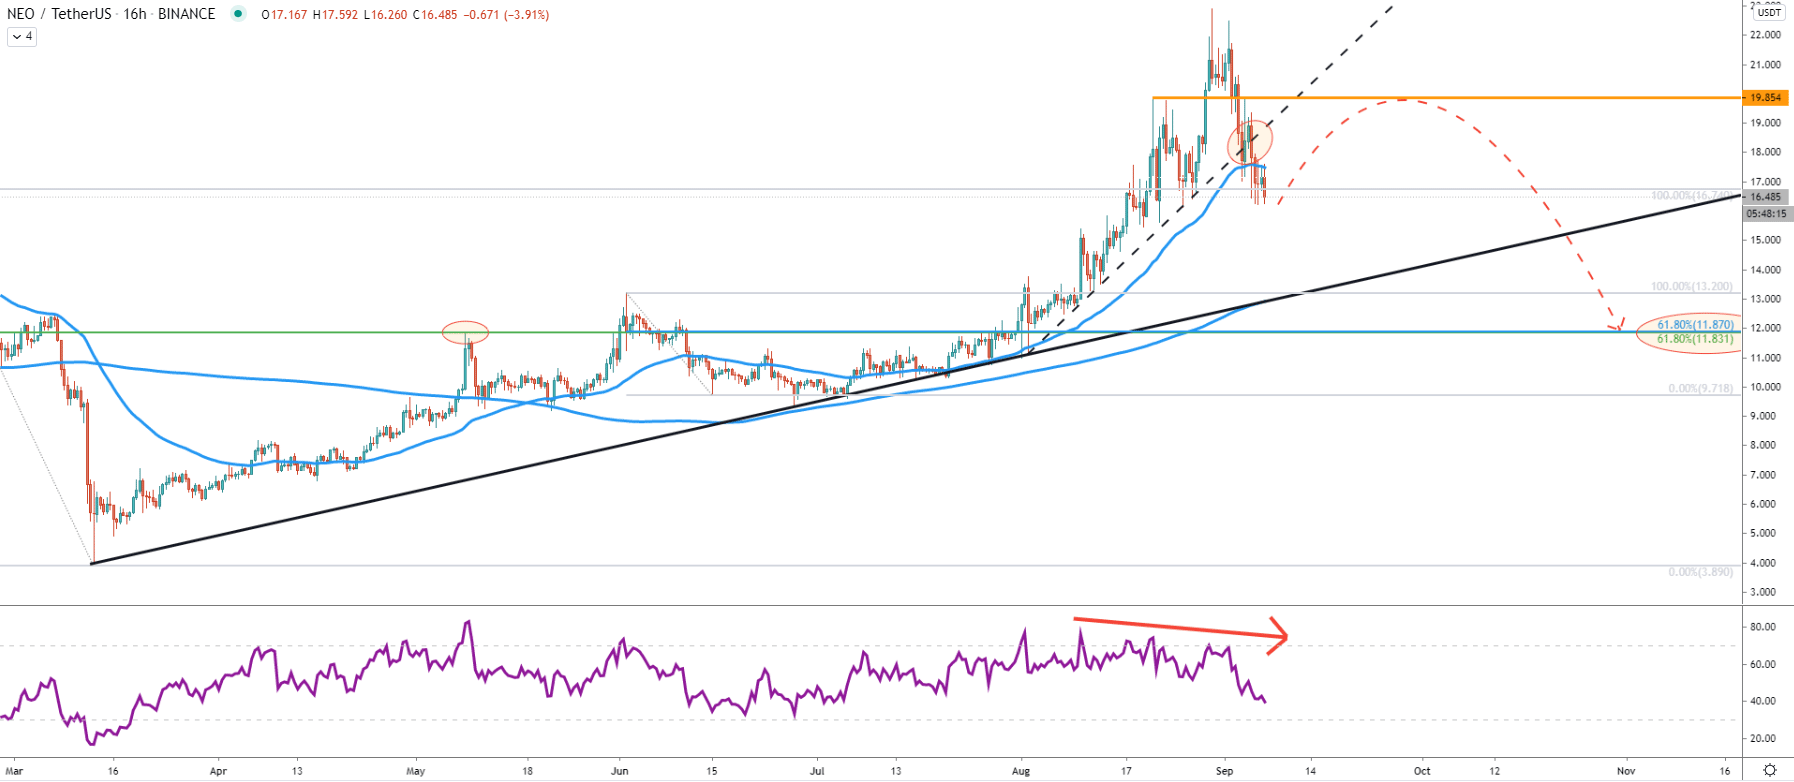
When price topped out, the RSI oscillator formed a bearish divergence after that NEO attempted but failed to break below the uptrend trendline and the 50 SMA. Bulls are defending the current support area, which should send price up, resulting in either a small or a strong pullback up. An extremely strong supply/demand zone was formed near 19.85, which is a potential upside resistance level where NEO/USDT could retrace. If/when the price will reach this resistance, the most important factor should be the daily close above this level, because it will completely invalidate bearish outlook, and the uptrend continuation could take place.
But as long as daily closes remain below 19.85, the downside correction will continue. On this chart previously shown support at 11.90 area is now confirmed by two Fibs, 61.8% as per the Weekly chart, and 61.8% Fibs applied to the last corrective wave down, prior to the August rally.
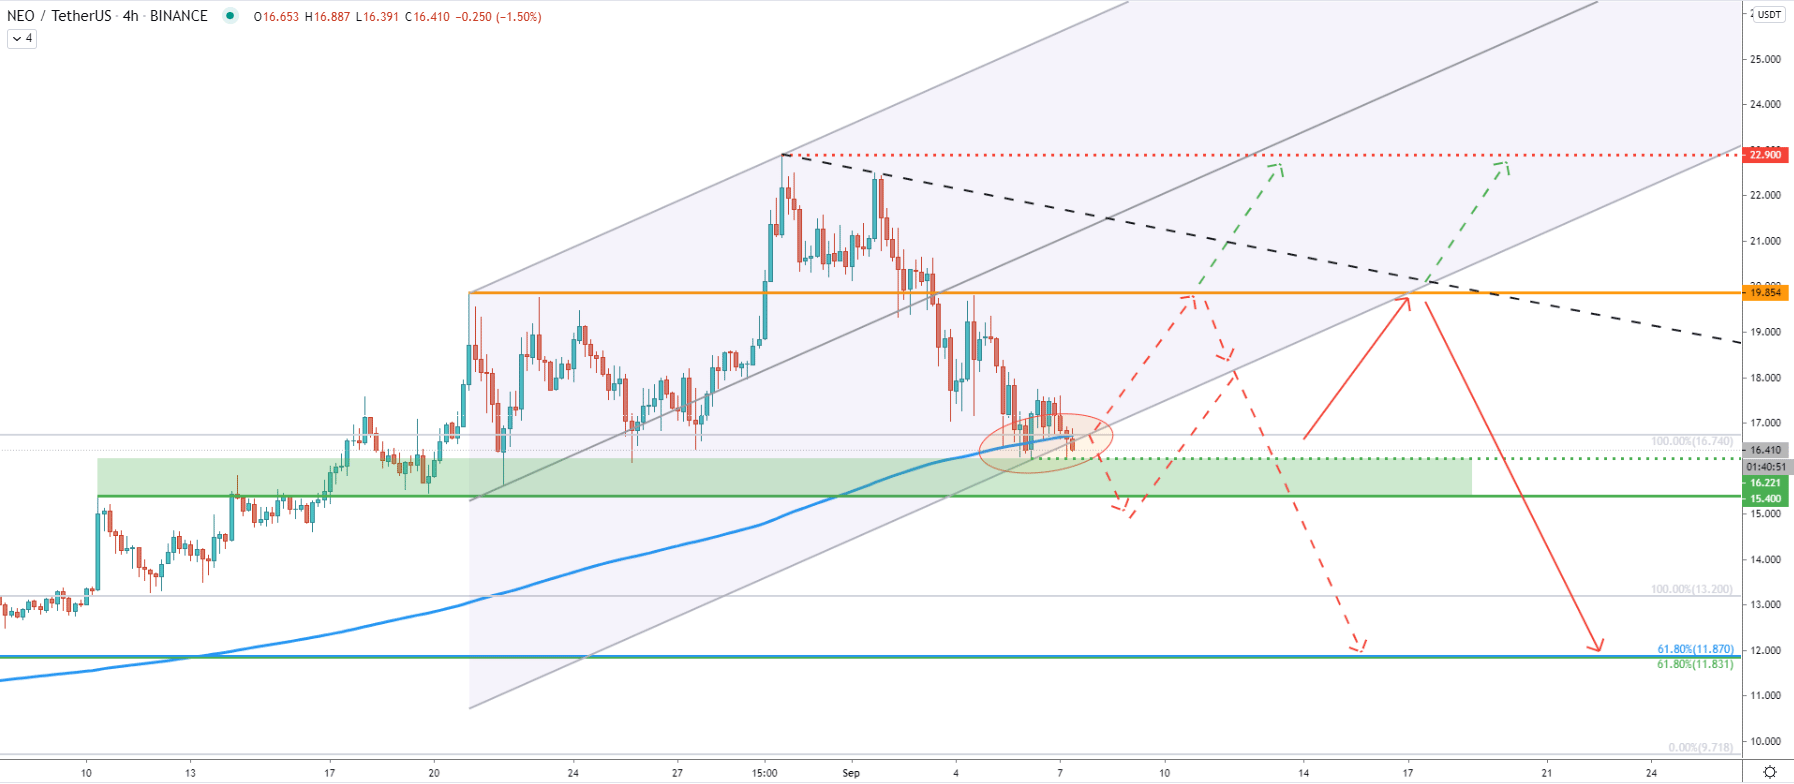
On the 4-hour timeframe, NEO has reached and currently is rejecting the lower trendline of the extended ascending channel along with the 200 Simple Moving Average. Now the support area becomes more clear, which is located between 15.40 and 16.20. As long as the price is above this support area, NEO will most likely consolidate, and could be re-testing 19.85 resistance.
But at the same time, it is possible that today or sometime this week NEO will break and close below the 15.40, which should invite more sellers. Bears will most likely wait for an upside move, in order to capture the highest possible market price. Therefore, the best selling opportunity is likely to be presented after NEO will break below the 15.40 support and then rises towards the 19.00 resistance area. Based on the crossing of the downtrend trendline and the lower trendline of the channel, the selling opportunity could be presented in about 10 days, approximately after September 17.
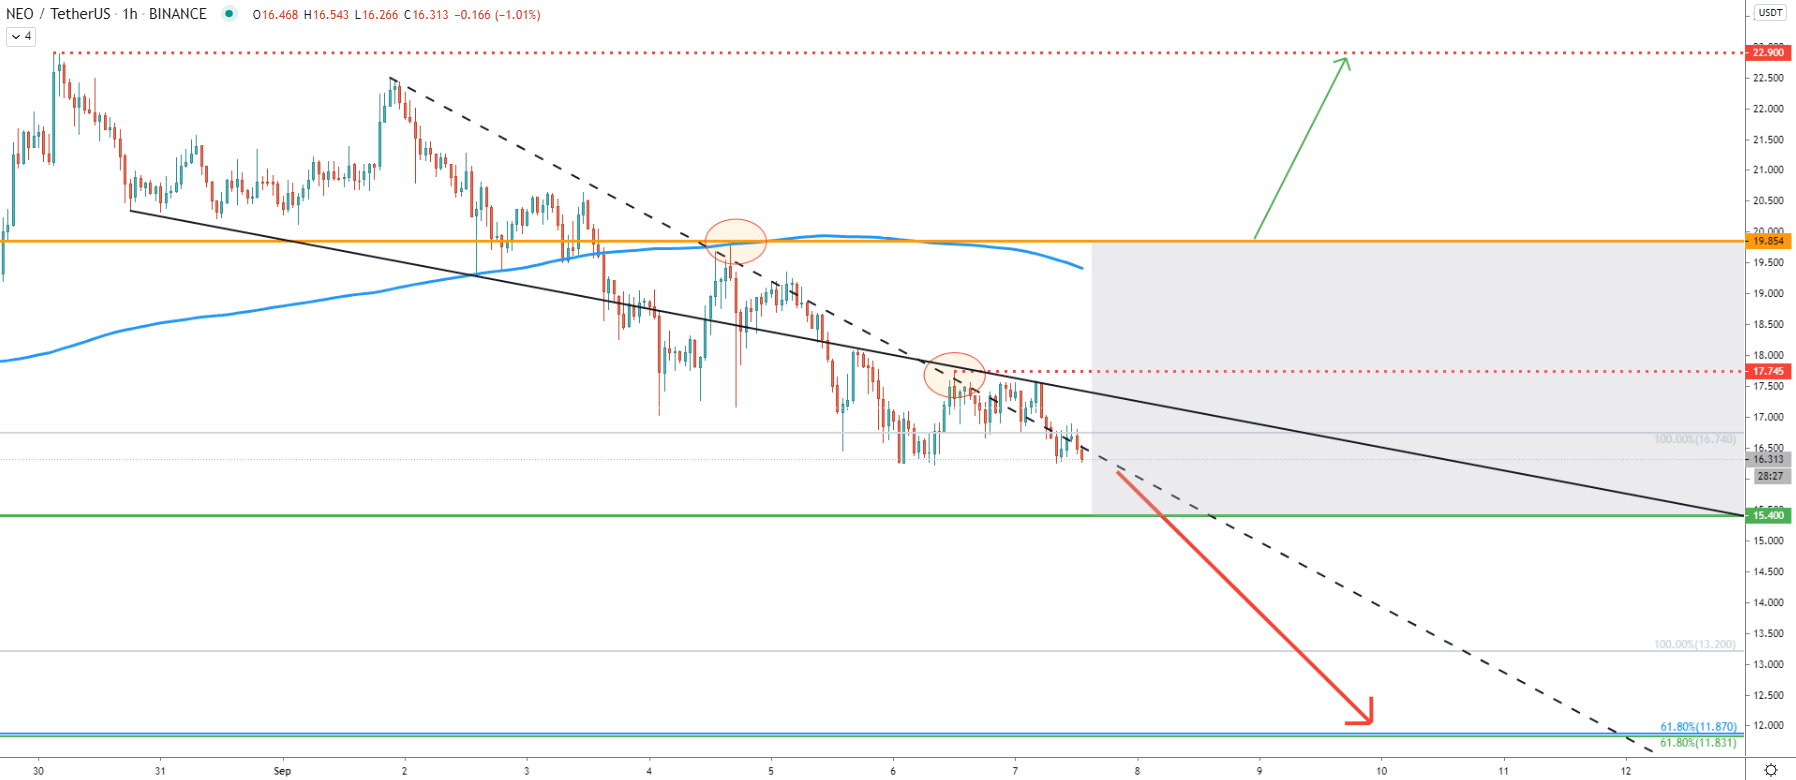
On the hourly chart, we can see that the strong resistance is formed at 17.75, where the downtrend trendline along with the average-price downtrend trendline was rejected. This might suggest that the price will continue moving down without any correction. In the worst-case scenario, 17.75 or even 19.85 resistance will be re-test and then downside correction will continue.
All-in-all, the downside correction is ongoing, although the price is currently stuck in the grey zone as per the hourly chart, where short to medium-term consolidation phase will take place. But in any case, currently, there are more sellers than the buyers, and at some point, where selling price will be most attractive, the long-term downside correction can be expected to continue.
As per the weekly and 16-hour charts, the key long term support is located near 12.00 psychological level. It might take weeks and even months before/if this level will be tested. But should NEO/USDT hit this support, it will most likely provide a long-term buying opportunity and will invite long term investors as well as short term buyers.
It is clear that the long term trend remains bullish, and therefore uptrend continuation could take place at any time. If NEO will be able to stay above 16.00 for an extended period of time, the probability of an uptrend continuation will increase substantially. However, only a daily break and close above 19.85 will completely invalidate bearish forecast and NEO might aim for a new higher high.
Support: 15.40, 13.40, 11.83
Resistance: 16.72, 17.75, 19.85, 22.90