Published: January 8th, 2021
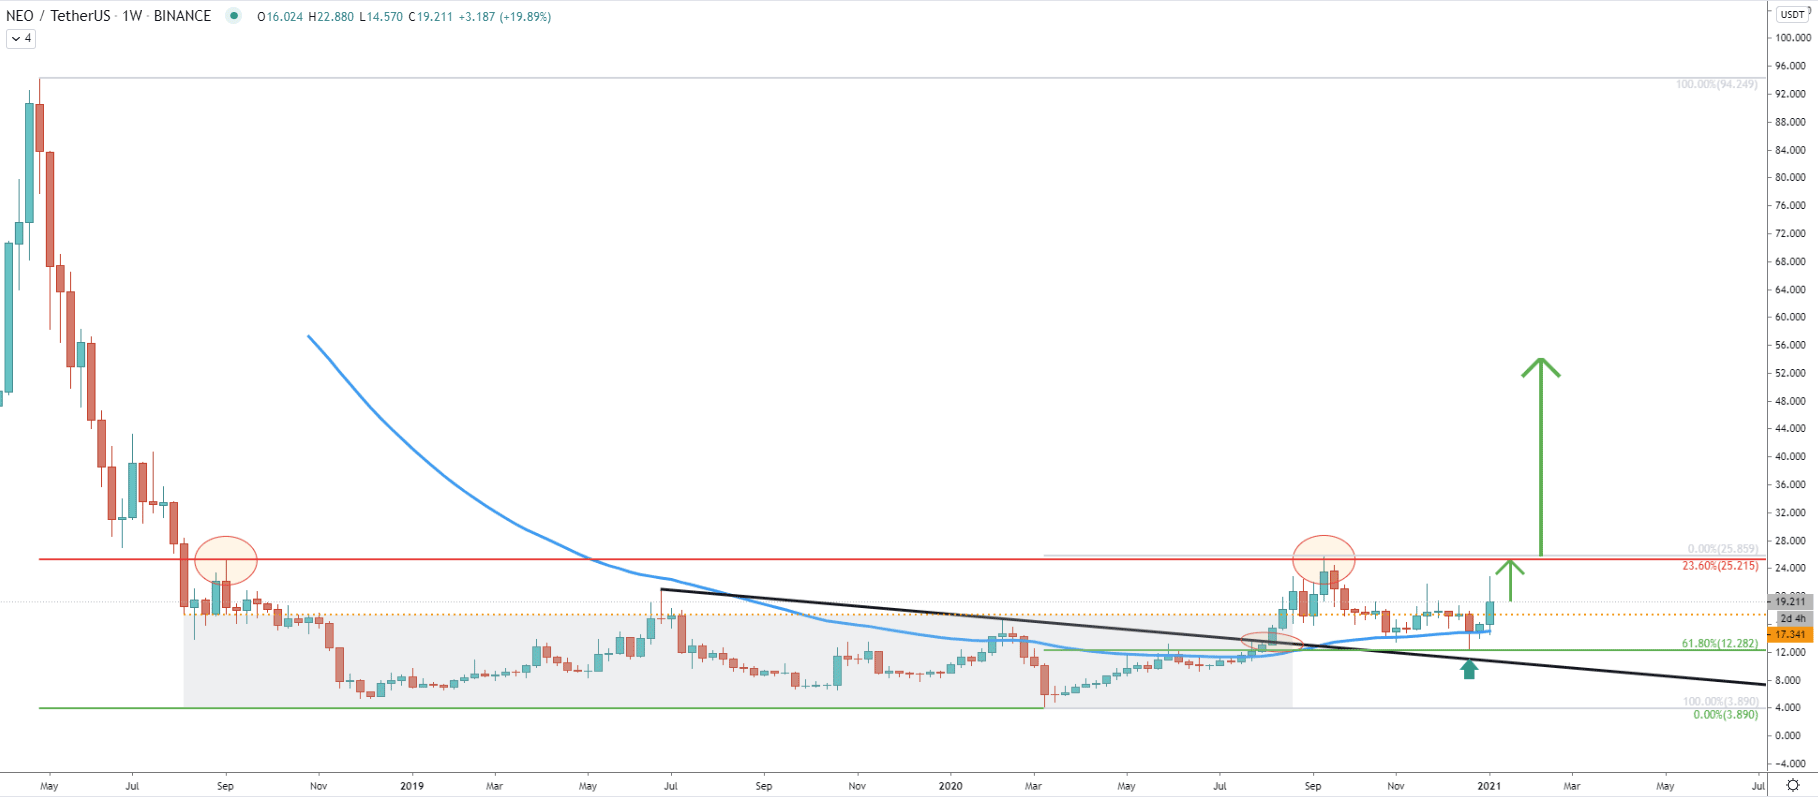
On the weekly chart, NEO/USDT has formed a range trading zone, located between 3.90 support and 17.30 resistance. NEO has been ranging within that area during the past few years, up until September 2020, when the price finally broke above the range. While breaking above, the resistance, the price also broke above the 50 Exponential Moving Average as well as the downtrend trenldine. After the breakout, the price has topped out at 25.85, and then a correction down followed.
On the correction, the price has reached and rejected cleanly the 61.8% Fibonacci retracement level at 12.28, It has also bounced off the 50 EMA, not once, but twice. This might imply a growing interest in the NEO cryptocurrency, which is likely to result in more buying pressure in the coming weeks. The previous resistance has been formed near 25.01, which is the 23.6% Fibonacci retracement level. Perhaps this level once again will act as the strong resistance with a potential break-even higher.
If NEO will break and close above the 25.85 level on the daily and/or weekly timeframe, the long term uptrend could be confirmed. In this case, the price might skyrocket, potentially moving towards the 100.00 area or above.
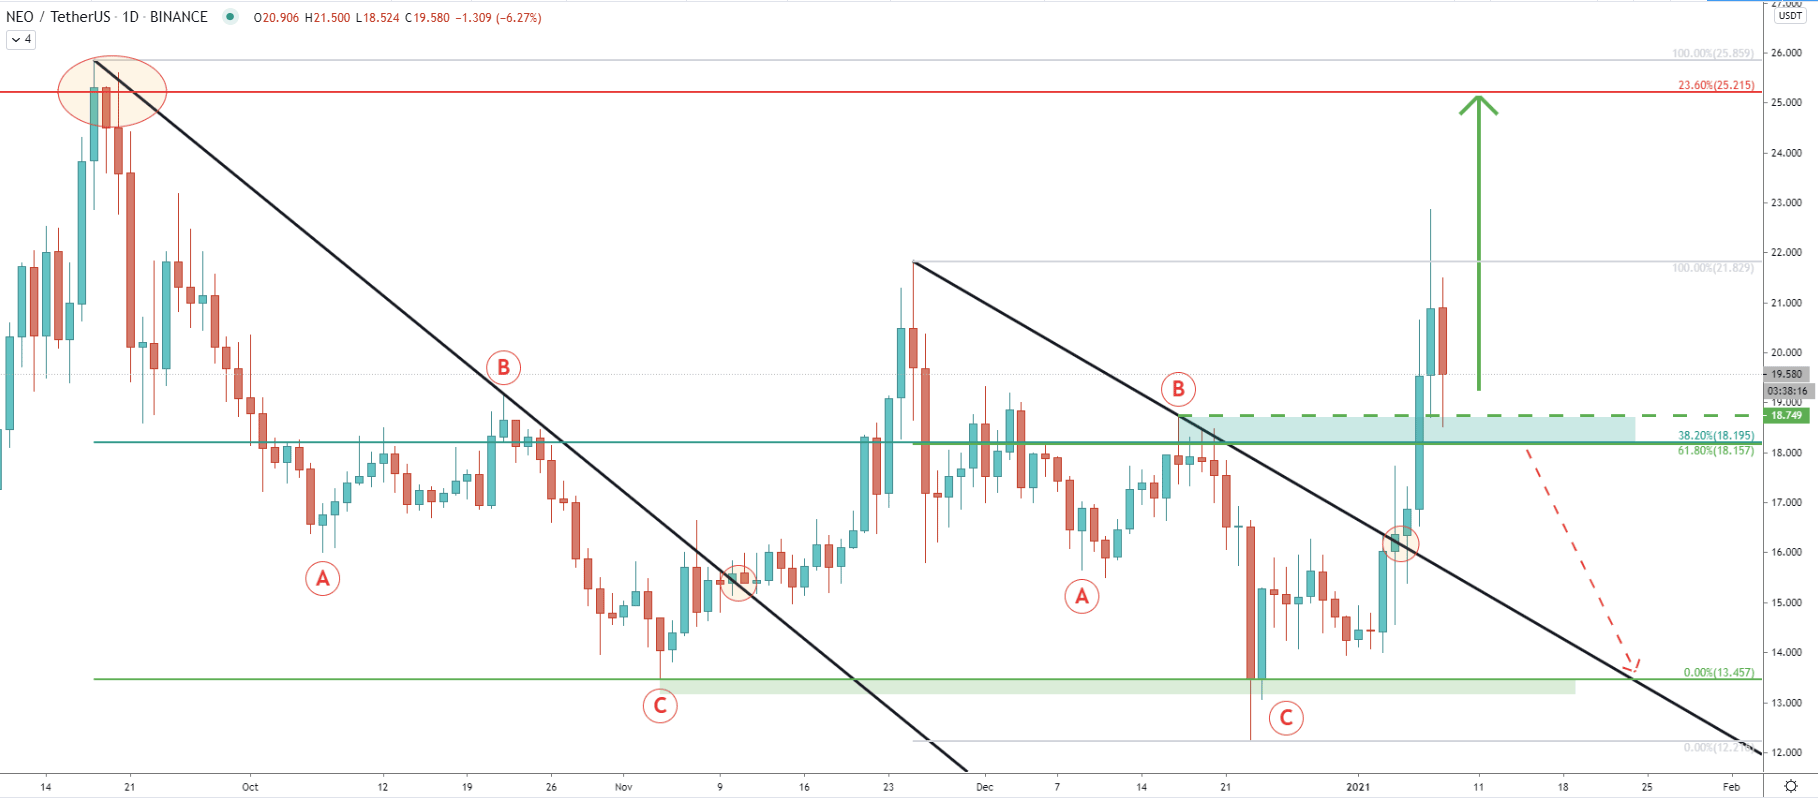
On the daily timeframe, the price continues to break above the downtrend trendline. Prior to each breakout, we can observe an ABC correction pattern based on the Elliot Wave theory. The most recent breakout sent the price to a new higher high after which a pullback followed. The current correction seems to be stopped near the 18.00 support area, which previously was the resistance.
This support is also confirmed by two Fibonacci retracement levels, 38.2%, and 61.8% Fibs as can be seen on the chart. This makes 18.15 - 18.75 a key demand area, which is most likely be of great interest to buyers. It will be very important for NEO/USDT to remain above this zone, especially not to have a daily close below 18.15. As long as this is the case, the price is likely to continue rising towards the 25.00 resistance area.
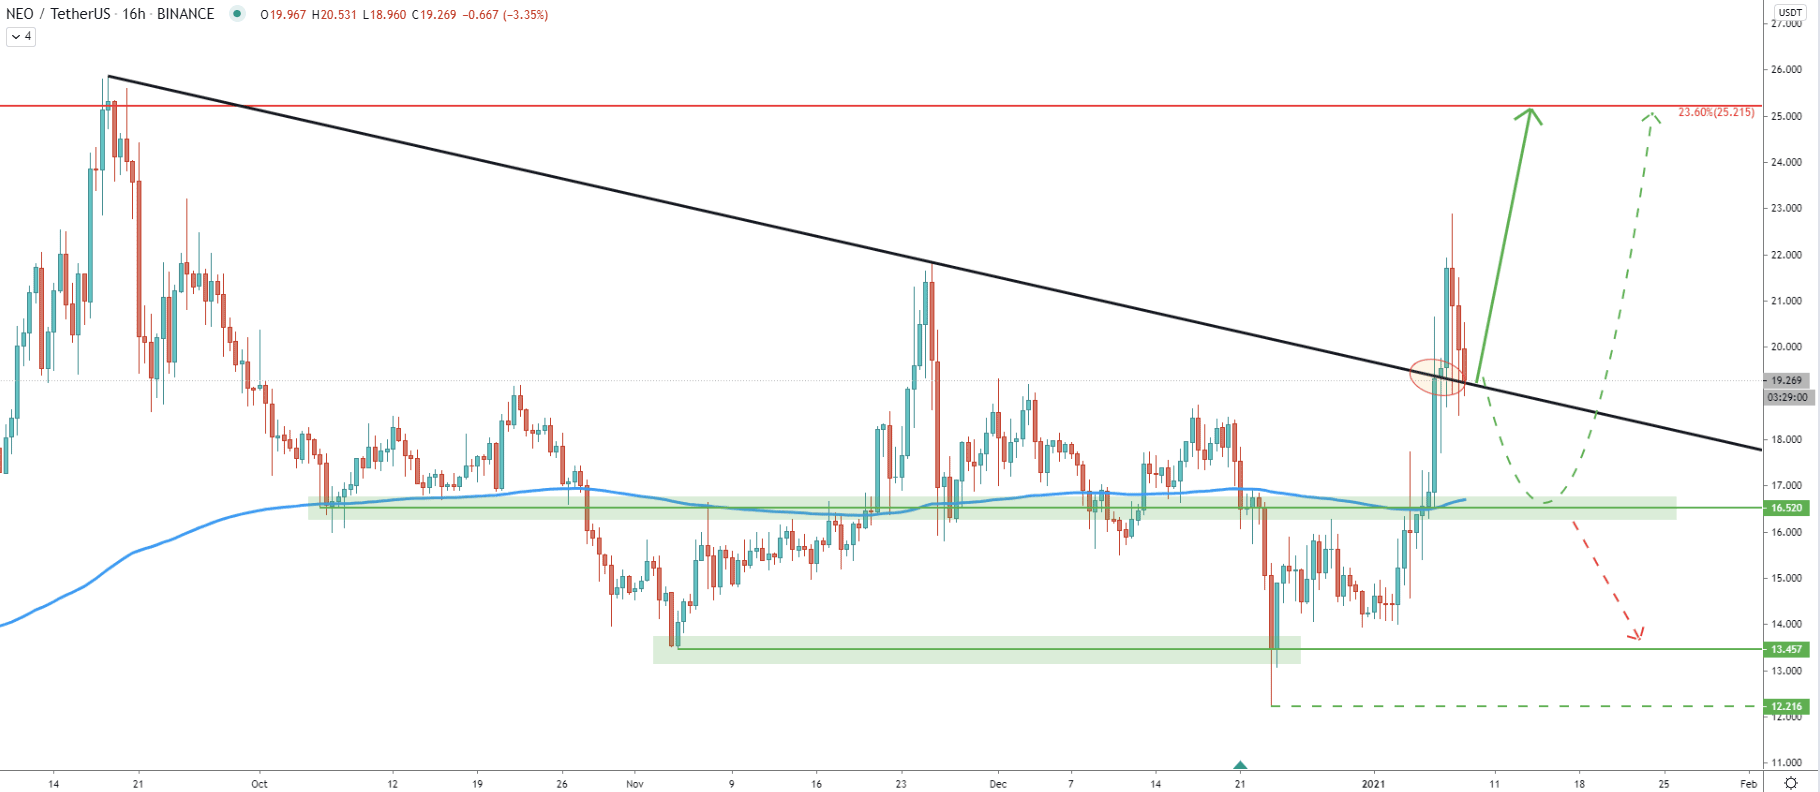
Yet another downtrend trendline was broken, this time on the 1-hour chart. We can see that all the obstacles on the NEO way down are being penetrated, suggesting the validity of strong bullish pressure. Right now the price has corrected down to the trendline, which is now acting a the support and being rejected. Maybe this is the point where the next upside wave will begin because it is also a zone of the previous resistance. Nonetheless, if there will be a continuation of the correction, the price can decline towards the 16.50 support, to test the 200 Exponential Moving Average, before/if an uptrend continues.
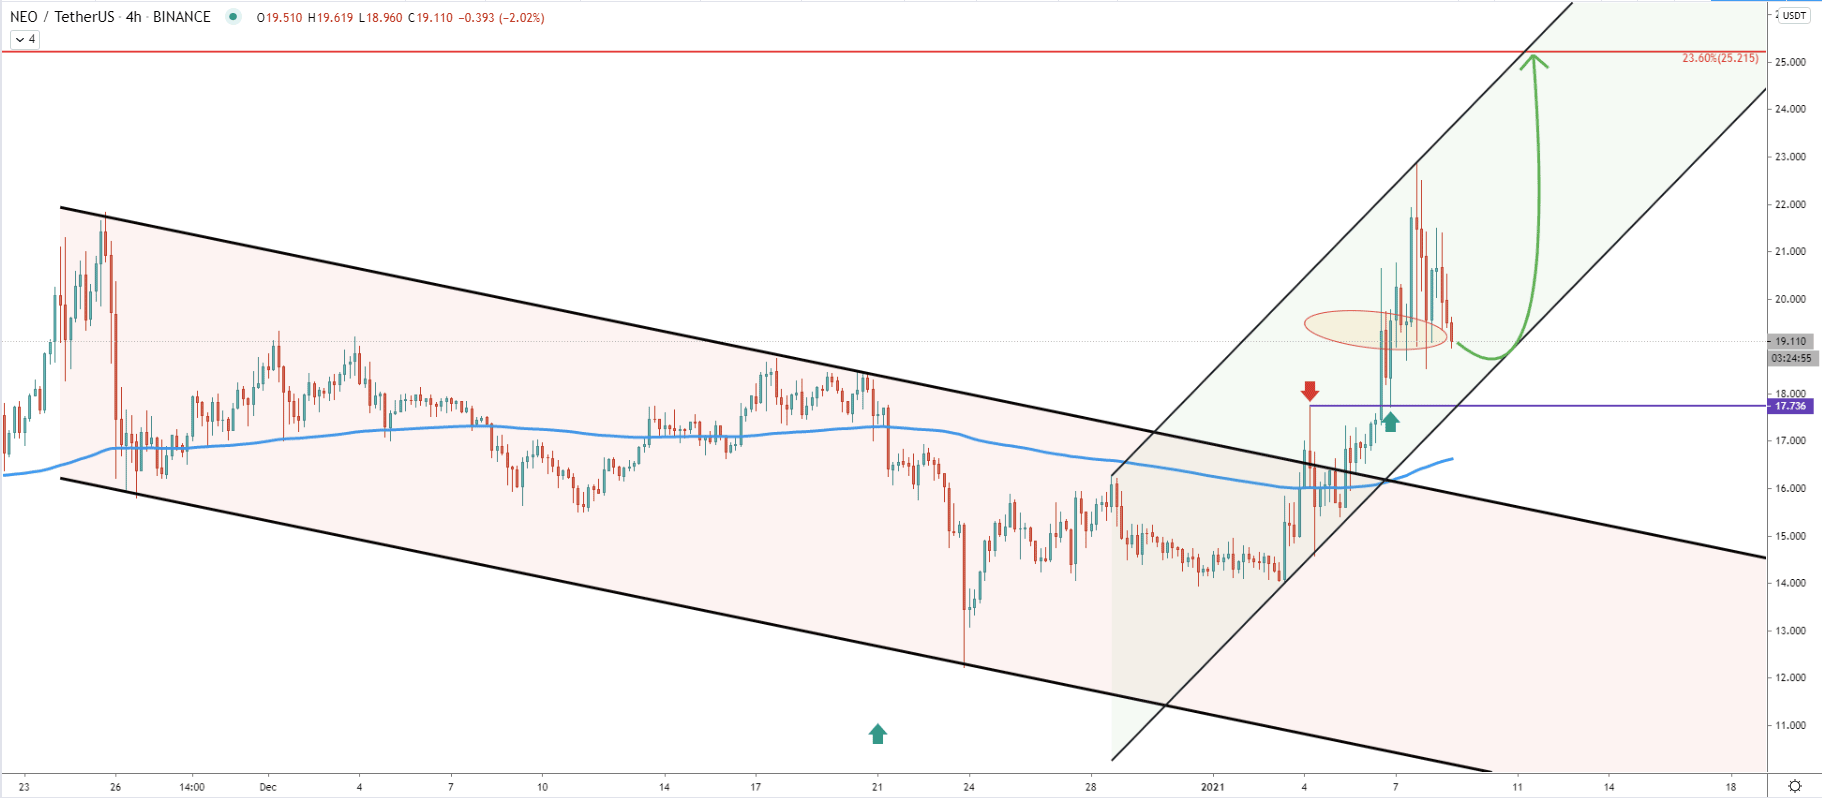
The descending channel got broken on December 7, when the price went above the 17.73 resistance level. Following the breakout, a correction down followed and NEO bounced off the 17.73 precisely, which clearly acted as the support. Currently, NEO/USDT is trading within the ascending channel and is likely to test the bottom of the channel prior to the uptrend continuation.
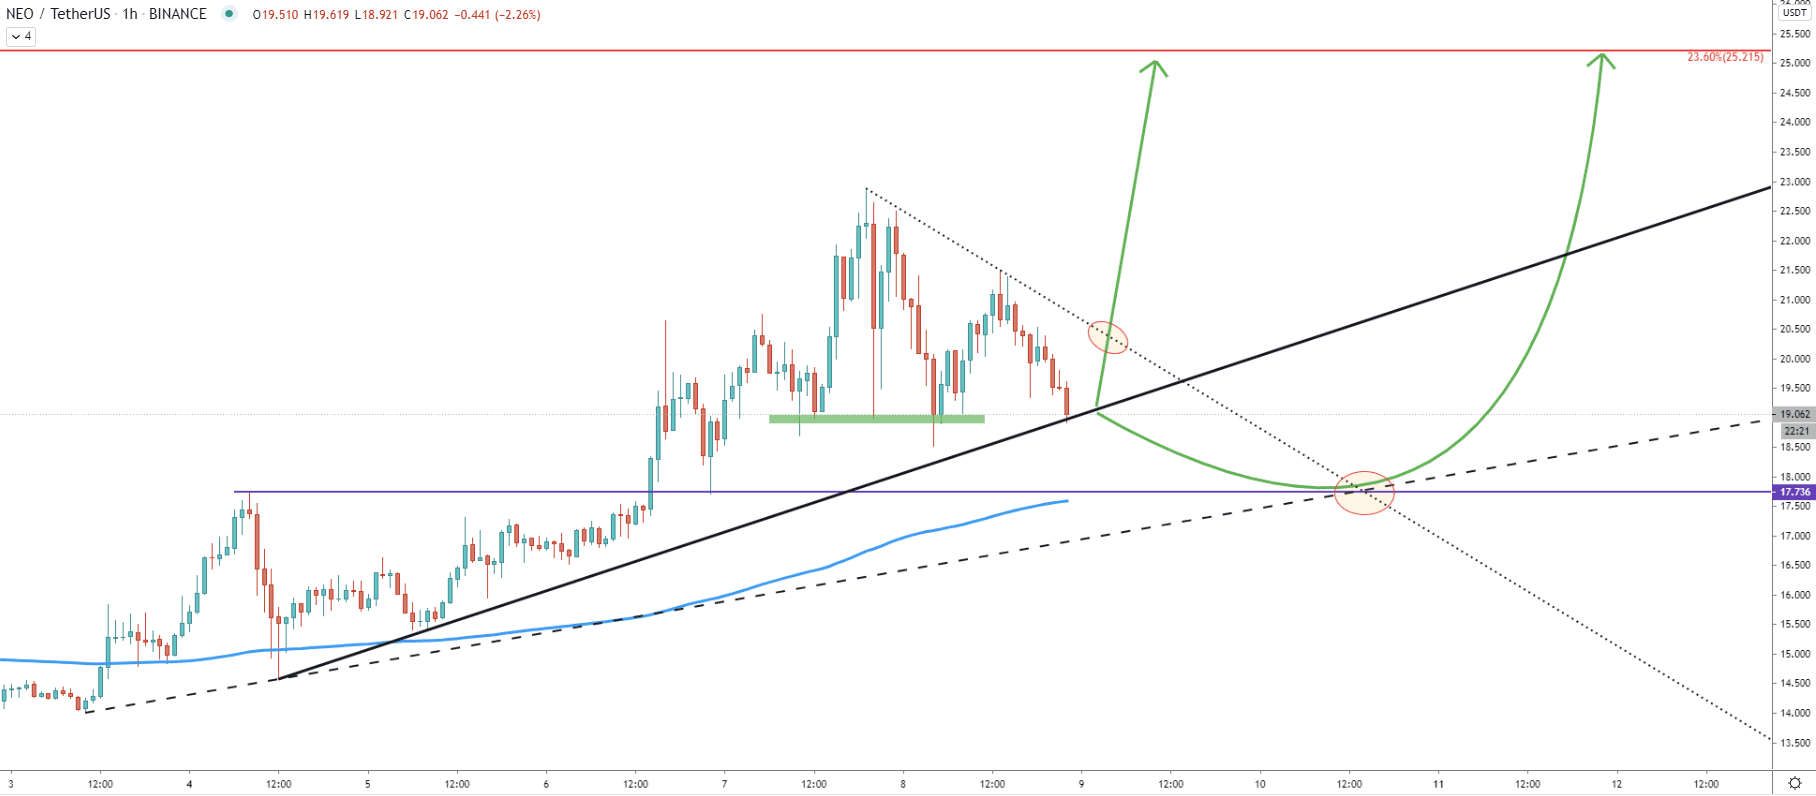
On the hourly chart, right now NEO is testing the simple uptrend trenldine, which corresponds to the previously formed support. At the same time price remains below the downtrend trendline, and could be stuck between the uptrend and the downtrend trendlines for a short period of time. It seems there are two scenarios in case of an uptrend continuation. The first, is the break below the downtrend trendline, to test the 17.73 support along with the 200 EMA once again. The second is the break above the downtrend trendline, which should confirm the continuation of the bullish trend, potentially resulting in a fast price increase towards the 25.00 resistance area or even much higher.
NEO is showing signs of an emerging long-term bullish trend, which might begin from this point onwards. Although for this scenario the current support must remain to be respected. In this case, buyers are likely to step in with a new power, where price might increase substantially over the coming weeks.
As per the weekly chart, the nearest and the key resistance can be located at 25.21, which corresponds to the 23.6% Fibonacci retracement level and can be tested in a relatively short period of time as long as the current support holds.
As per the daily chart, the key support level is located at 18.15, which is confirmed by two Fibonacci retracement levels and corresponds to the previous resistance area. If the price will manage to break and close below this level on the daily chart, selling pressure is likely to increase. However, this will not invalidate the uptrend, but can only initiate a consolidation phase. Only a break below the 12.00 support area will completely invalidate the bullish scenario, where NEO/USDT should be expected to decline further. But this scenario at this point in time is highly unlikely considering all the price action shows in this analysis.
Support: 18.75, 18.15, 17.73, 13.45
Resistance: 21.82, 25.21