
Published: April 20th, 2021
The NASDAQ 100 fell quite a bit as bears are active below the 14,000 levels. Currently, the price may show some correction towards the downside that might help to continue the bullish pressure. After the weekly open, S&P 500 was also negative, but the NASDAQ 100 was the worst.
NASDAQ 100 managed to show a bearish daily close below the 14,000 levels, but the market is likely to see buyers from any deep. Among NASDAQ components, tech stocks do better when the interest rate is lower or stable. Therefore, in this market condition, investors should find some levels that could be interesting.
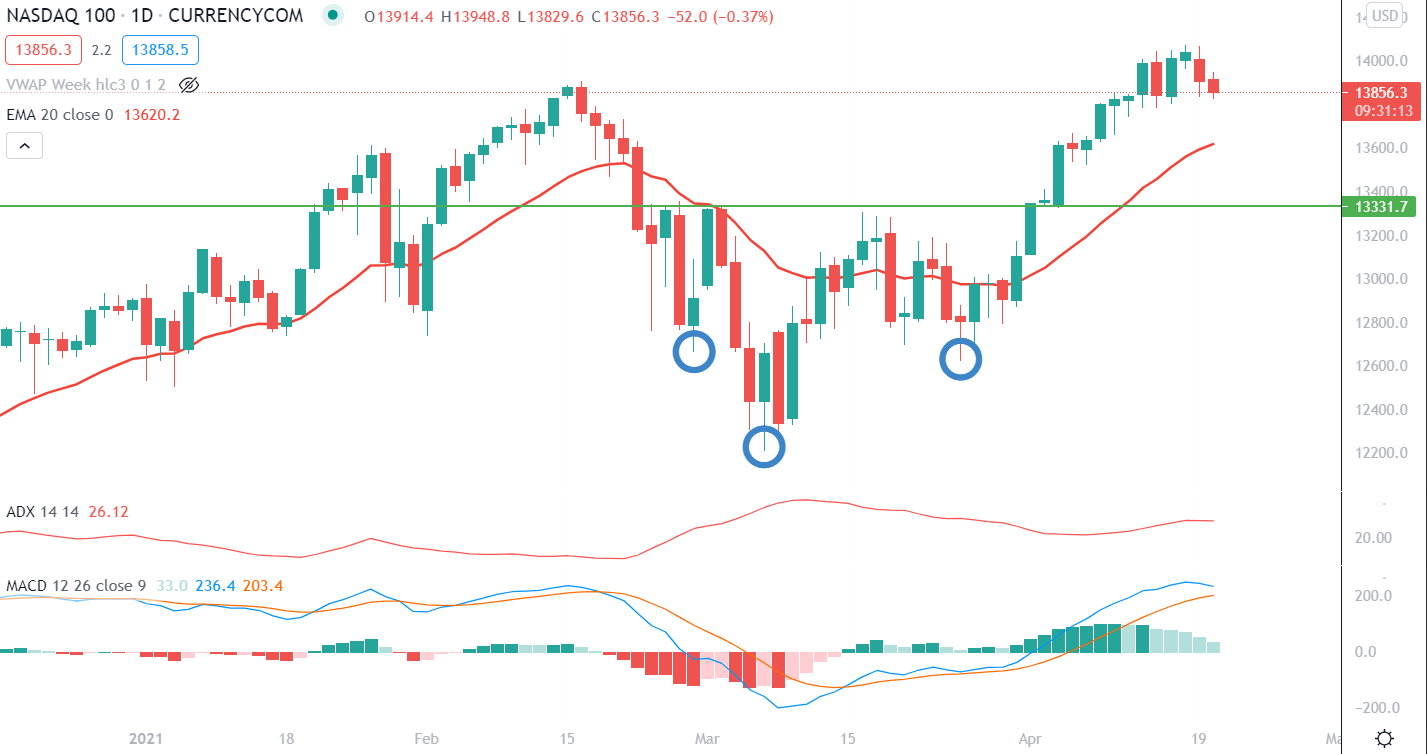
For NASDAQ 100 bulls, the price is still above the neckline of an inverted head and shoulder pattern at the 13,333 level. Moreover, the breakout speed above the Neckline was very impulsive, indicating that bulls were very strong at this level.
In the above image, we can see the daily chart of NASDAQ 100 where the price managed to create a new high above the 13,888 level. Therefore, as long as the price is trading above the neckline of the H&S pattern, we may consider the major trend as bullish.
Moreover, the price is trading above the dynamic level of 20 EMA, pointing out that short-term market sentiment is bullish. However, as the price became volatile above the 13,888 level, following a bearish daily close below the 14,000 level, we may expect a short-term bearish pressure where the primary target would be the 13,624 area. Below this level, the 13,333 level would work as a major support level, and any bounce from these levels would be potential for buyers.
Conversely, if the price moves above the 14,000 level and has a daily close, we may see another leg upside with the primary target of 15,000.
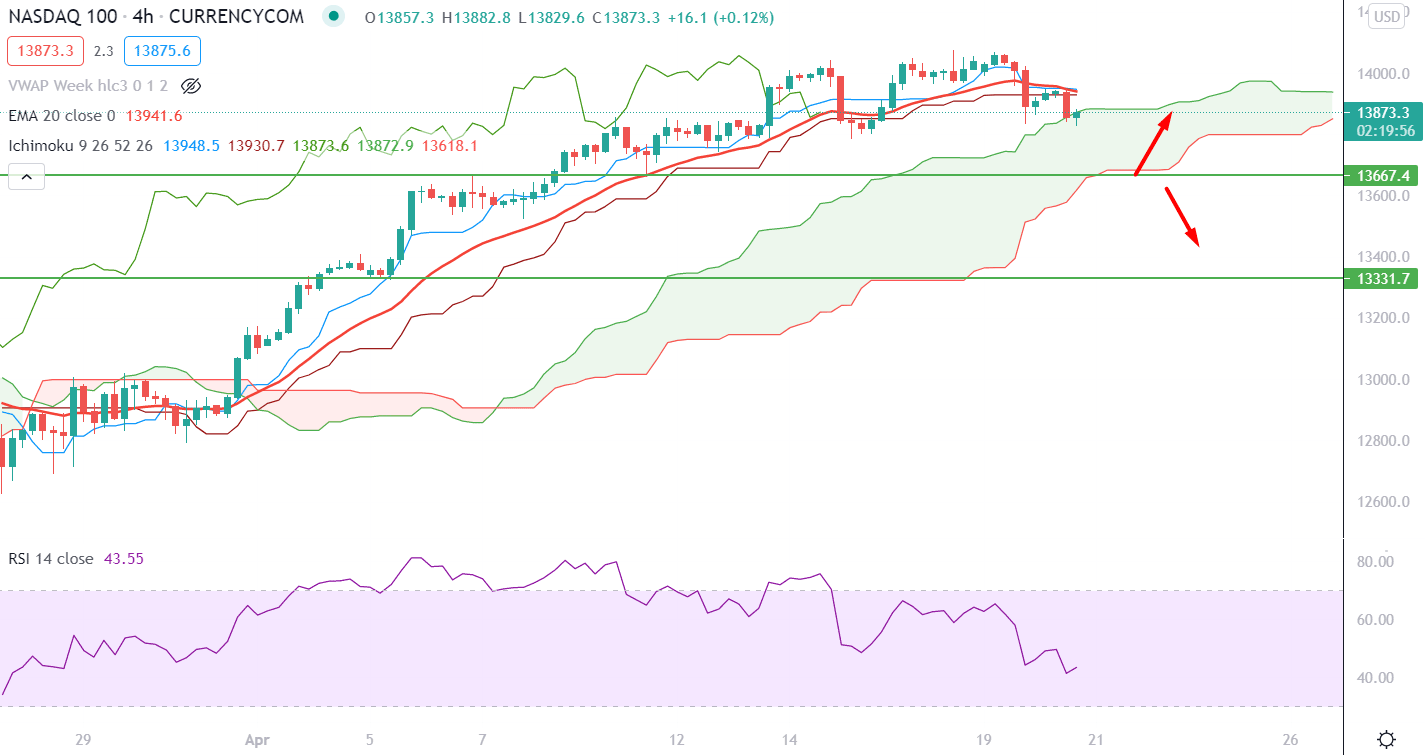
Based on the H4 chart, the price is currently facing support from the Ichimoku Kumo Cloud. Therefore, investors should see how the price reacts from the Kumo Support.
Here, we can see the price broke below the Dynamic 20 EMA and made a new low after some correction. Moreover, the H4 price closed below the Tenkan Sen and Kijun Sen line, indicating that both short-term and medium-term market sentiment is bearish.
However, Senkou Span A is above Senkou Span B while Senkou Span B is pointing upside in the future cloud. The market sentiment is still bullish based on the future cloud’s sentiment.
As the price moved below dynamic levels, there is a higher possibility of testing the Senkou Span B as the next support. Therefore, any bearish rejection with a bullish H4 close to the 13,667 level would create a bullish movement in the price. In the meantime, if the RSI starts to move higher from the 20 levels, the bullish possibility will be boosted.
Conversely, if the price came down below the 13,667 level with an H4 close, the price may come down towards the 13,333 level, the Neckline of the Inverse H&S pattern.
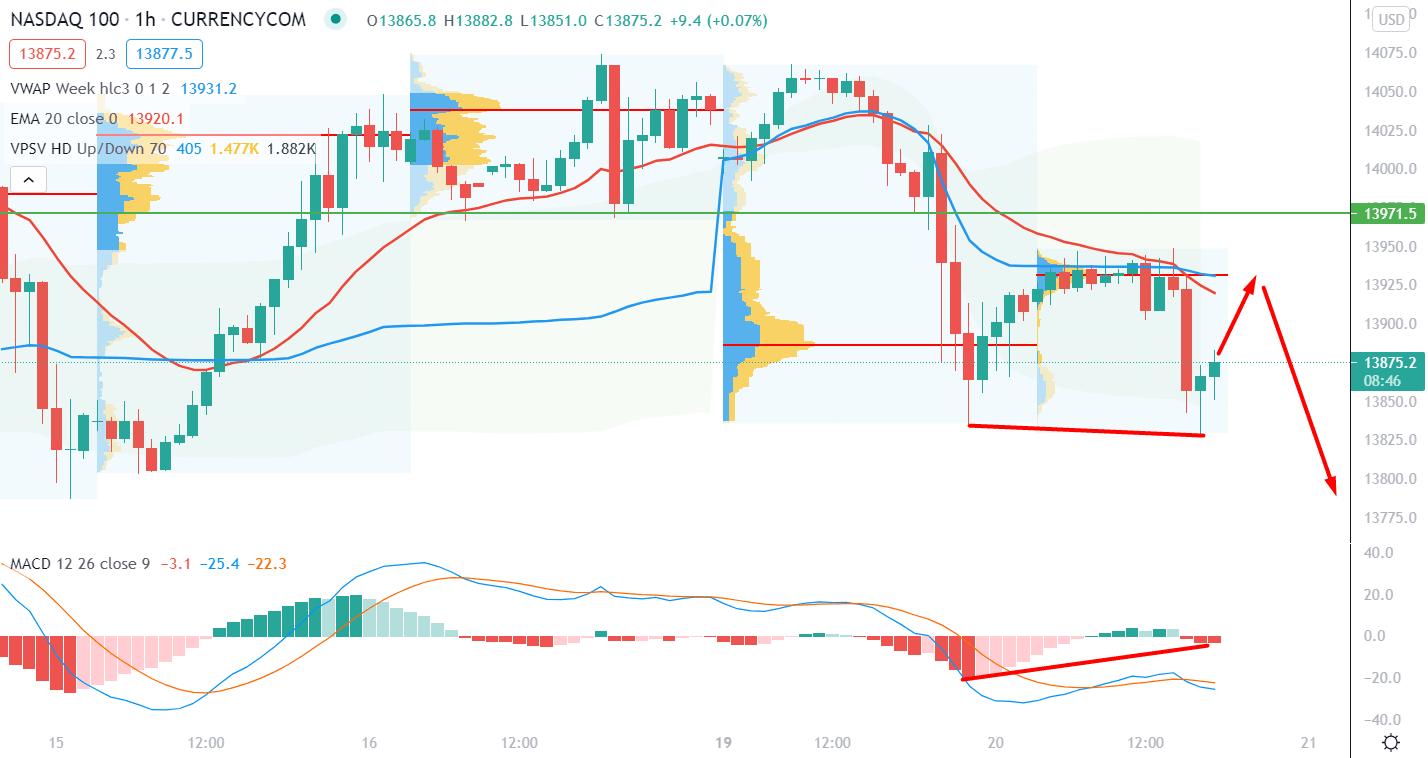
Based on the h1 timeframe, the price is trading below the current session’s high volume area at 13,932 level, followed by a potential hidden divergence with the MACD.
In the above image, we can see the H1 chart of the NASDAQ 100, where the price moved below the 13,971 event-level with an impulsive bearish pressure. Therefore, there is a possibility of a minor bullish correction due to the hidden divergence with the MACD. However, as long as the price is trading below the 13,932 high volume area, it may make another move downside below the 13,805 low.
On the other hand, if the price move above the 13971 event level with an impulsive bullish pressure, the bearish possibility would be invalidated. In that case, the price may test the 14,000 level in the coming session.
As of the above discussion, we can say that the overall market context is still bullish as long as the price is trading above the 13,333 level.
Based on the short-term price sentiment, NASDAQ 100 bears are active below the 14,000 level, and they may take the price towards a 13,667 support level.
On the other hand, any bearish rejection from the 13,333 level or a bullish daily close above the 14,000 level would create further bullish pressure in the price where the primary target would be towards the 15,000 level.