Published: March 9th, 2020
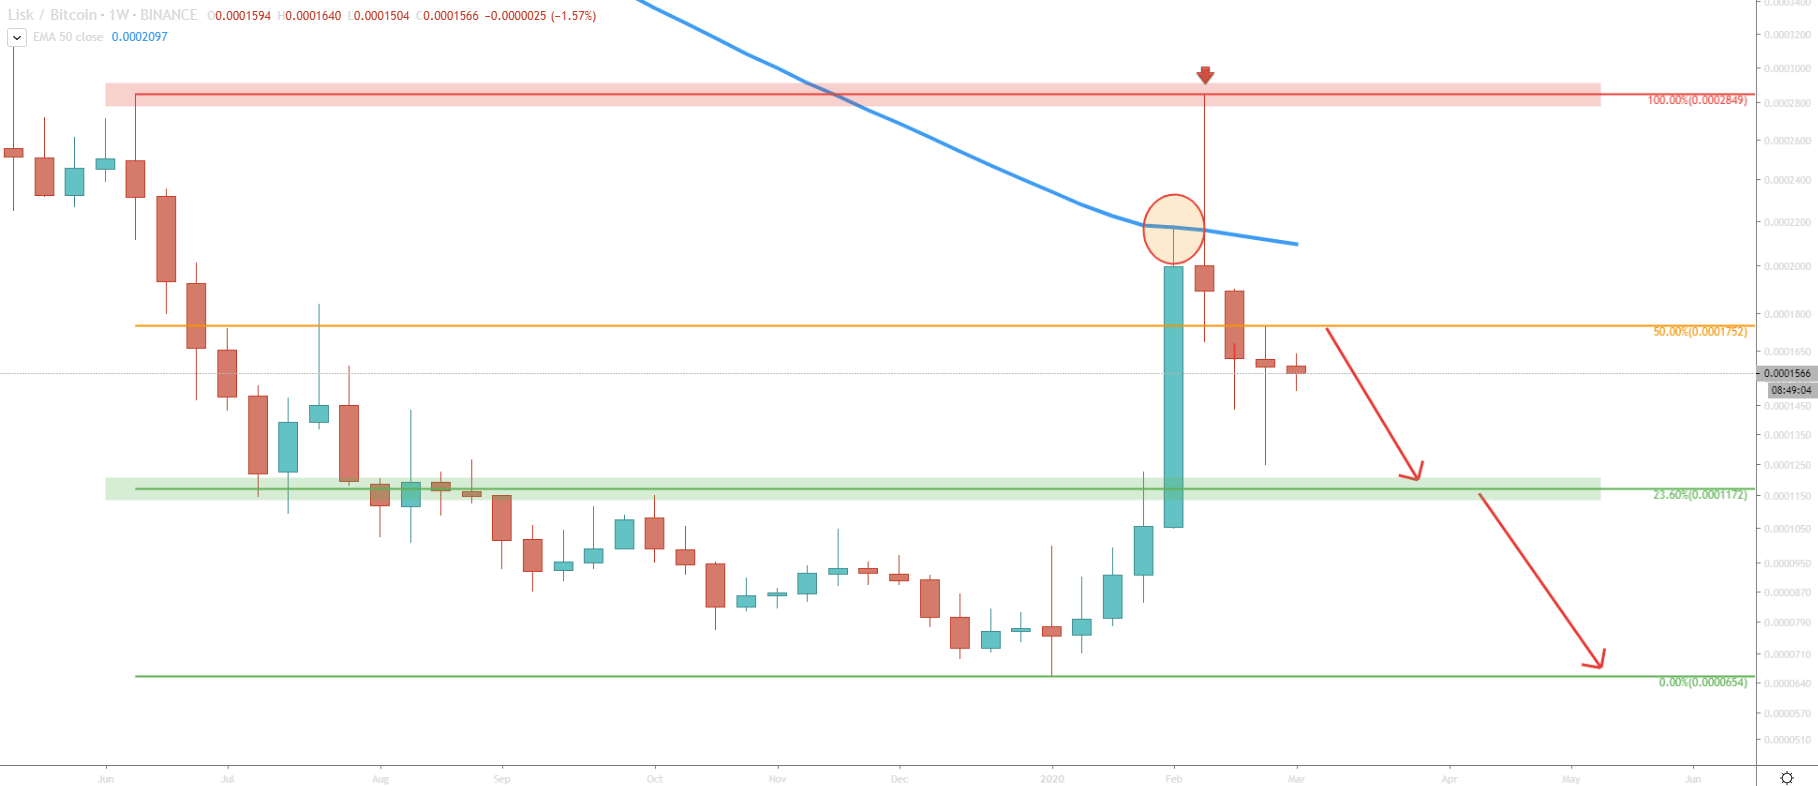
Above is a LSK/BTC weekly chart. And it is very clear that the price rejected the 50 Exponential Moving Average. It was a very clean rejection after which prie spiked higher but failed to close above the EMA. On the spike up, Lisk rejected the previous level of resistance at 0.0002849 BTC, and the bounce was very clean as well. Such price action could turn a recent uptrend into yet another corrective wave up, on the high timeframe. And this means that the long term downtrend could just about to continue.
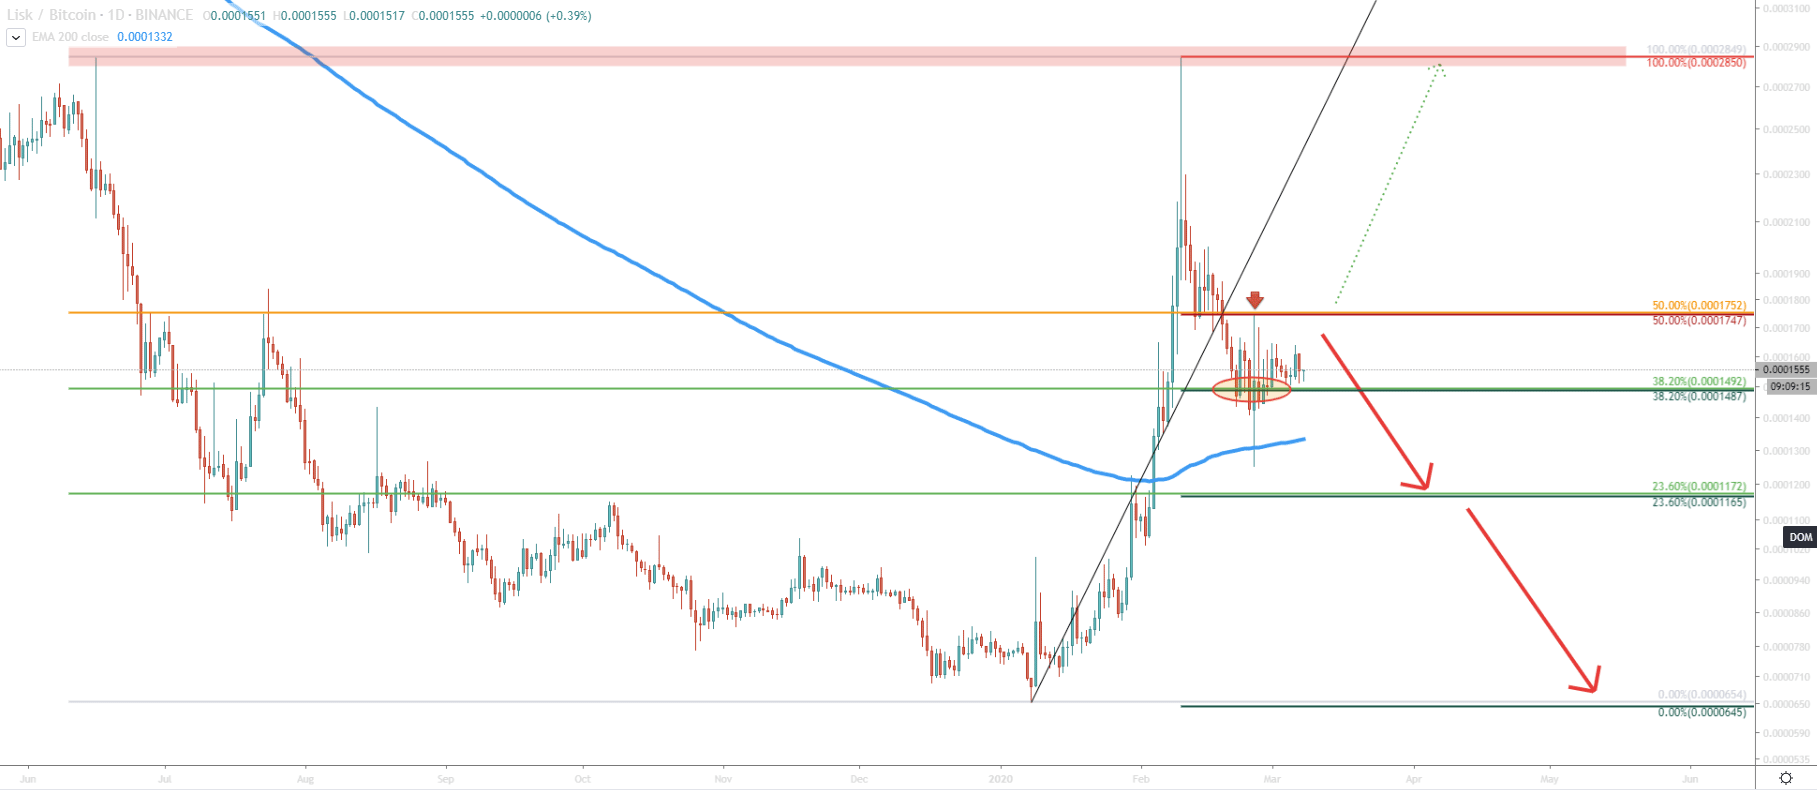
On a Daily chart, we can observe the Fibonacci indicator, applied to the June 2019 - January 2020 downtrend. What is obvious is that the price rejected the 50% Fibonacci retracement level at 0.0001750BTC, prior to which it broke below the 38.2% support at 0.0001490BTC. At the same time, if we apply the Fibonacci indicator to the average uptrend trendline breakout point, we will see that 0.0001450 BTC is a very strong resistances. But also 0.0001490 is very strong support, which was broken.
The next key support is seen at the 23.6% retracement level, which is 0.0001170 BTC. Considering that price rejected 50% resistance, broke below 38.2% support and produced spike below the 200 EMA, we can suggest that there is strong selling pressure accumulating.
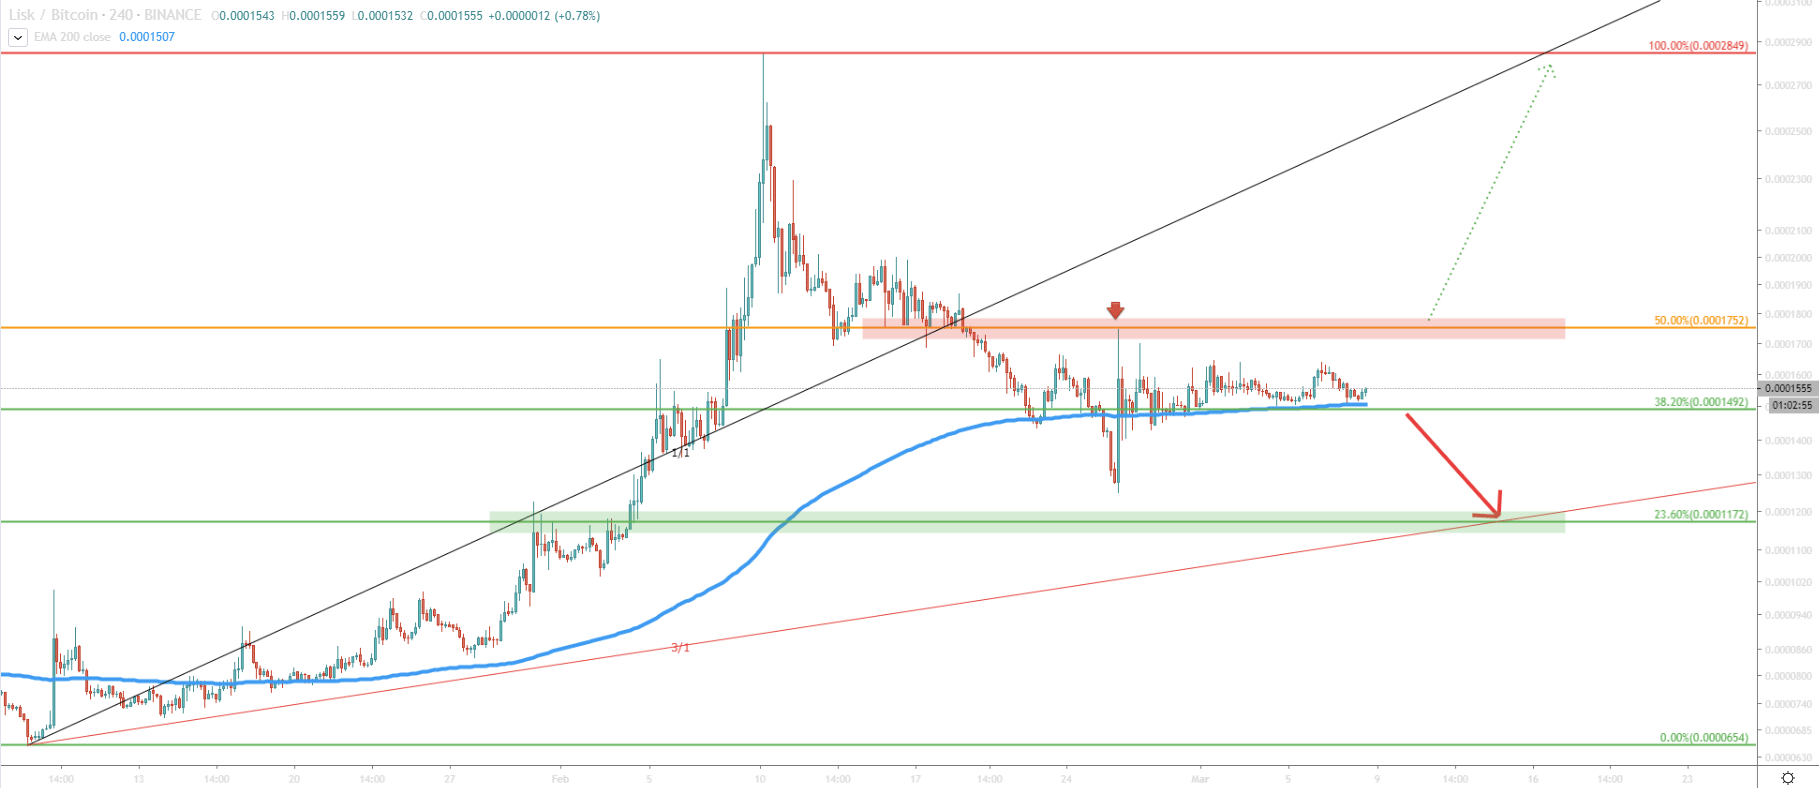
On the 4H chart, the price still remains above the 200 EMA, although we say that price did break and close below it on February 25. Currently, LSK/BTC is consolidating between support and resistance level, and range trading could take some time. Break and close below 0.0001490 BTC should confirm further decline and in this scenario, price is likely to test 23.6% Fibs support level at 0.0001170. This support is also corresponds to the 3/1 Gann Fan trendline. But on the other hand, break and close above 50% resistance would suggest a bullish scenario, where Lisk could test previously made high at 0.0002850BTC.
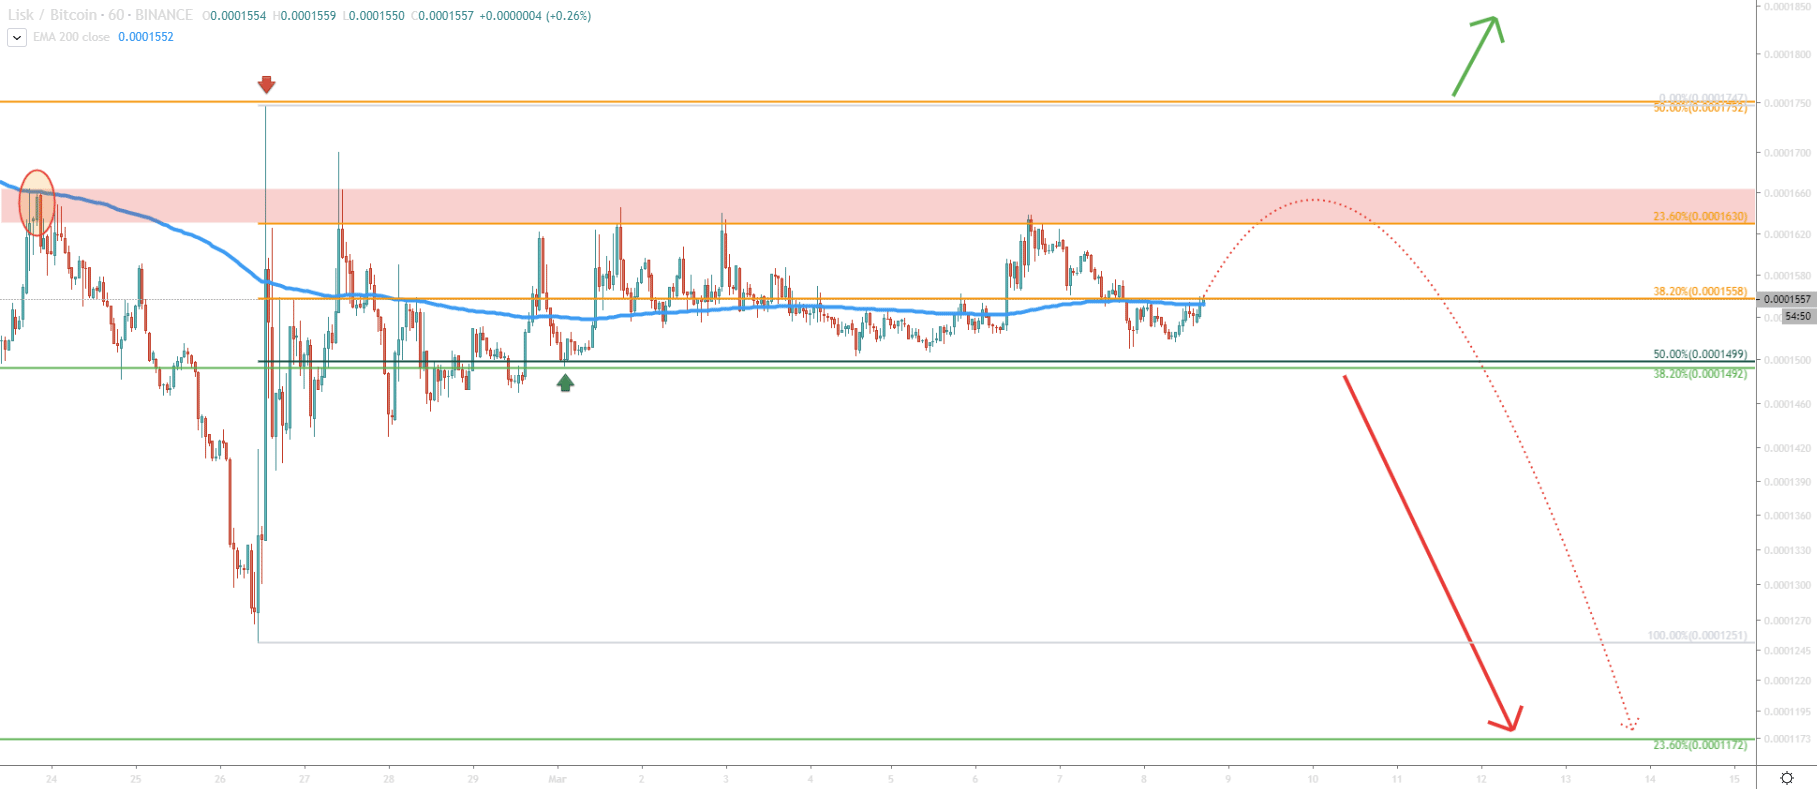
On the 1H chart, range trading is even more obvious. Price stuck between the support and resistance levels. On the lower timeframe clearly there is no distinguished direction. Therefore it is worth waiting for some sort of breakout, either above resistance or below support. Having said that, selling remains the priority considering price action oh hight timeframes.
The strong price rise in recent weeks could have come to an end. LSK/BTC has potentially topped out and the long term downtrend is likely to continue. Although weekly break and close would change this perspective.
In the medium to short term, there are two major downside targets. First is at 23.6% Fibonacci level at 0.0001172BTC. The next one is near previously made low on January 6, which is at 0.0000654BTC.
There are multiple resistance levels to watch. Break of each and every level will increase the probability of the uptrend. The nearest strong resistance is at 0.0001630, while the second and key resistance is at 0.0001752 BTC.
Support: 0.0001492, 0.0001172, 0.0000654
Resistance: 0.0001558, 0.0001630, 0.0001747