
Published: May 10th, 2022
Kinder Morgan is a leading energy infrastructure company in North America, controlling the largest natural gas transmission in the country. At the beginning of 2022, the company had 71K miles of natural gas pipelines and held 700 billion cubic feet of storage. As it handles almost 40% of the natural gas consumption and export in the US, it closely connects to the broader natural gas market and the US economy.
To meet the business requirement, Kinder Morgan maintains a stable cash flow to run the day to day business. Almost 90% of its revenue comes through the take or pay contract, fee-based contracts or hedges. These methods allow the company to have more than $4 billion in free cash flow every year. As a result, the company can pay high yield dividends, repurchase stocks and expand businesses to provide a better return to shareholders. At the beginning of 2022, the company spent almost $1.4 billion on business expansion, from which 45% was on the natural gas-related infrastructure.
The rising inflation rate would be a problem for stock valuations, while the Ukraine-Russia conflict would change the industry sentiment. Let’s see the future price direction from the Kinder Morgan Stock (KMI) technical analysis.
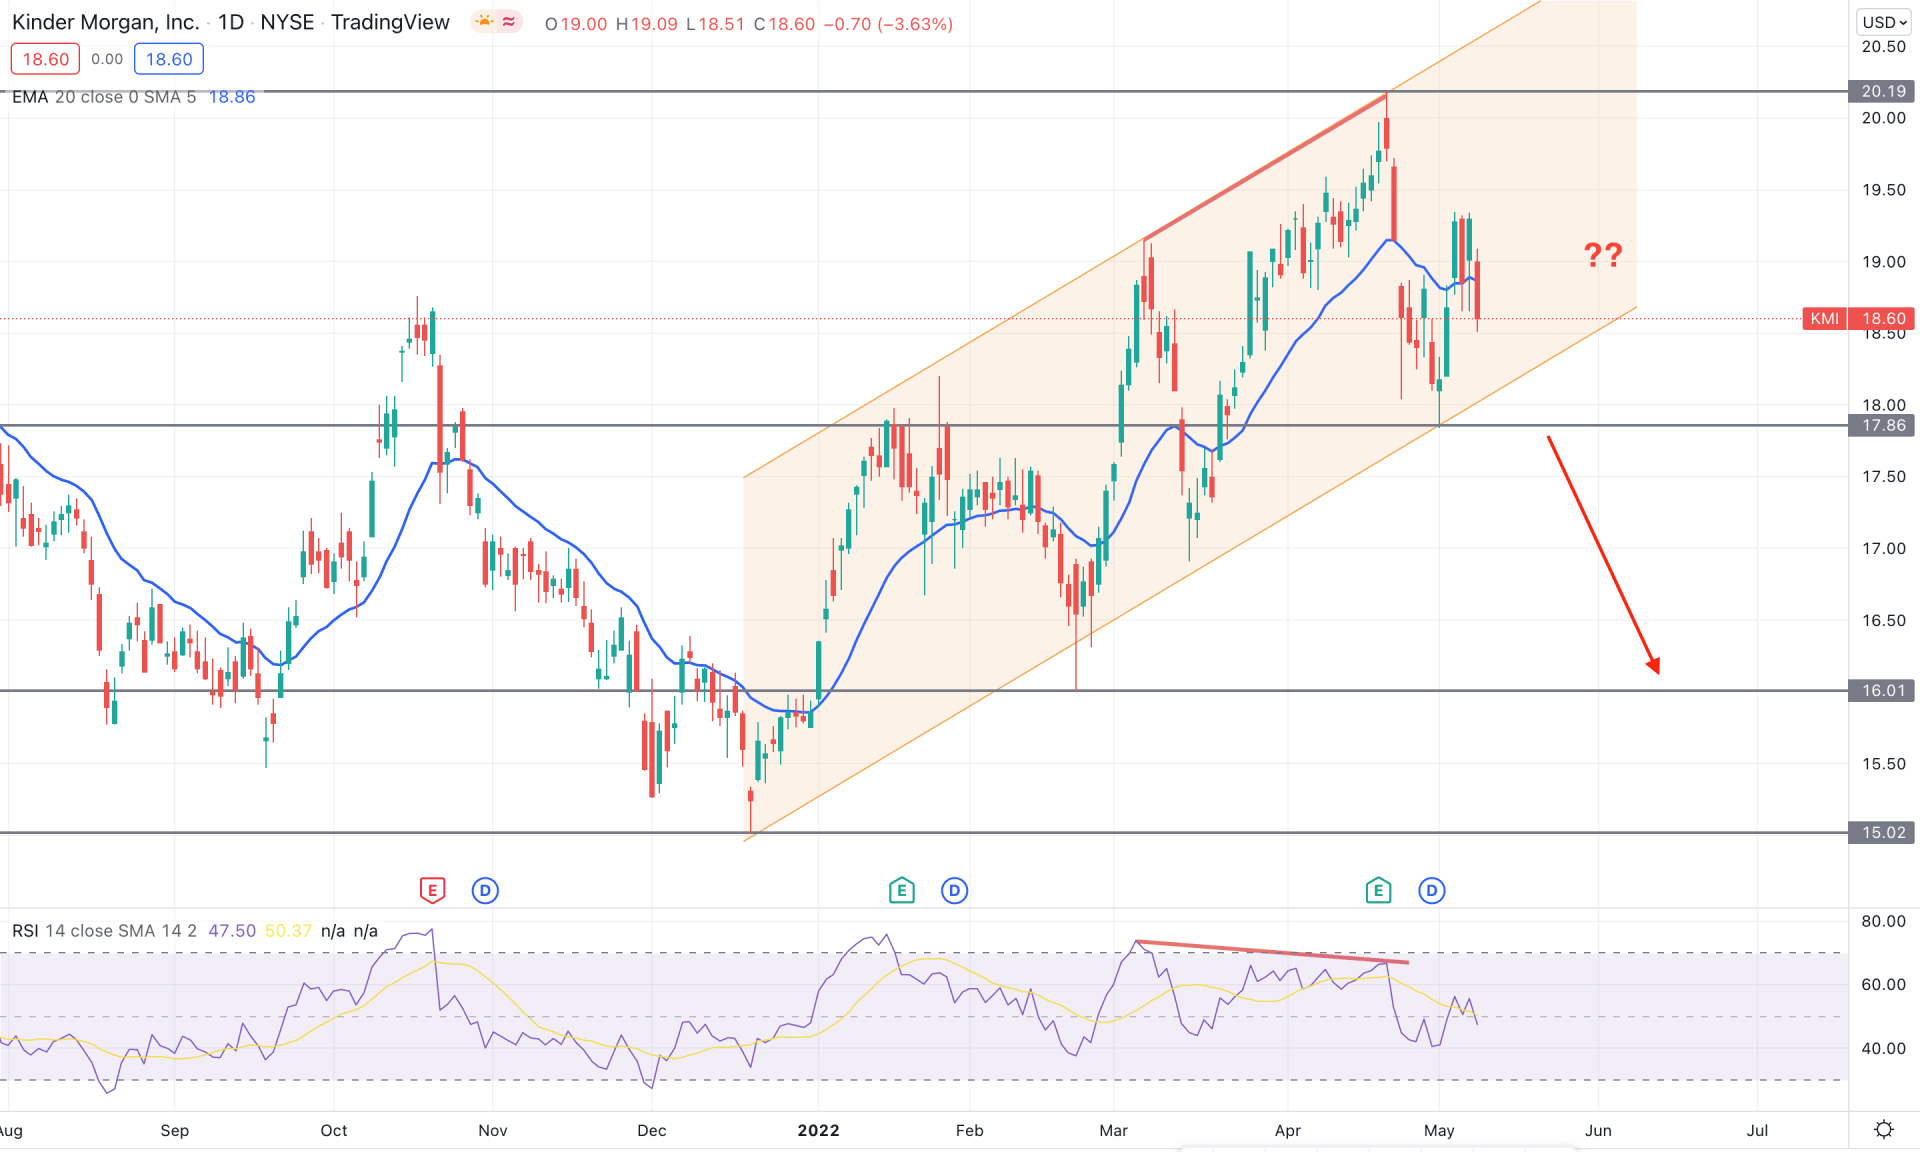
Kinder Morgan Stock (KMI) remained within a volatile bullish trend since the beginning of 2022, where the price provided an almost 27% gain by reaching the 20.19 swing low. However, the corrective bullish price action within a channel is a sign that bulls are losing momentum, and bears may join at any time. On the other hand, the weekly timeframe is still bullish for this instrument, where the latest price action shows a stable buying pressure above the 17.86 level while the RSI is above the neutral 50 level. Although a bearish pressure may come from the possible bullish channel breakout, any intense buying pressure may resume the long-term trend and test the 22.58 swing high.
The above image shows the daily chart of KMI stock, where the price formed a divergence with the RSI before moving below the dynamic 20 EMA. Moreover, the price returned above the dynamic 20 EMA this week but failed to hold the momentum. Therefore, it is a sign that bears became stronger this week, forming a bearish pre breakout structure in the daily timeframe.
Therefore, based on the daily price action, the selling pressure is valid as long as the price trades below the dynamic 20 EMA. A bearish daily candle below the 17.86 level would increase the selling pressure towards the 16.00 support level. However, the alternative approach is to wait for a bullish rejection from the 17.86 level with a daily close above the dynamic 20 EMA that may extend the buying pressure towards the 22.00 area.
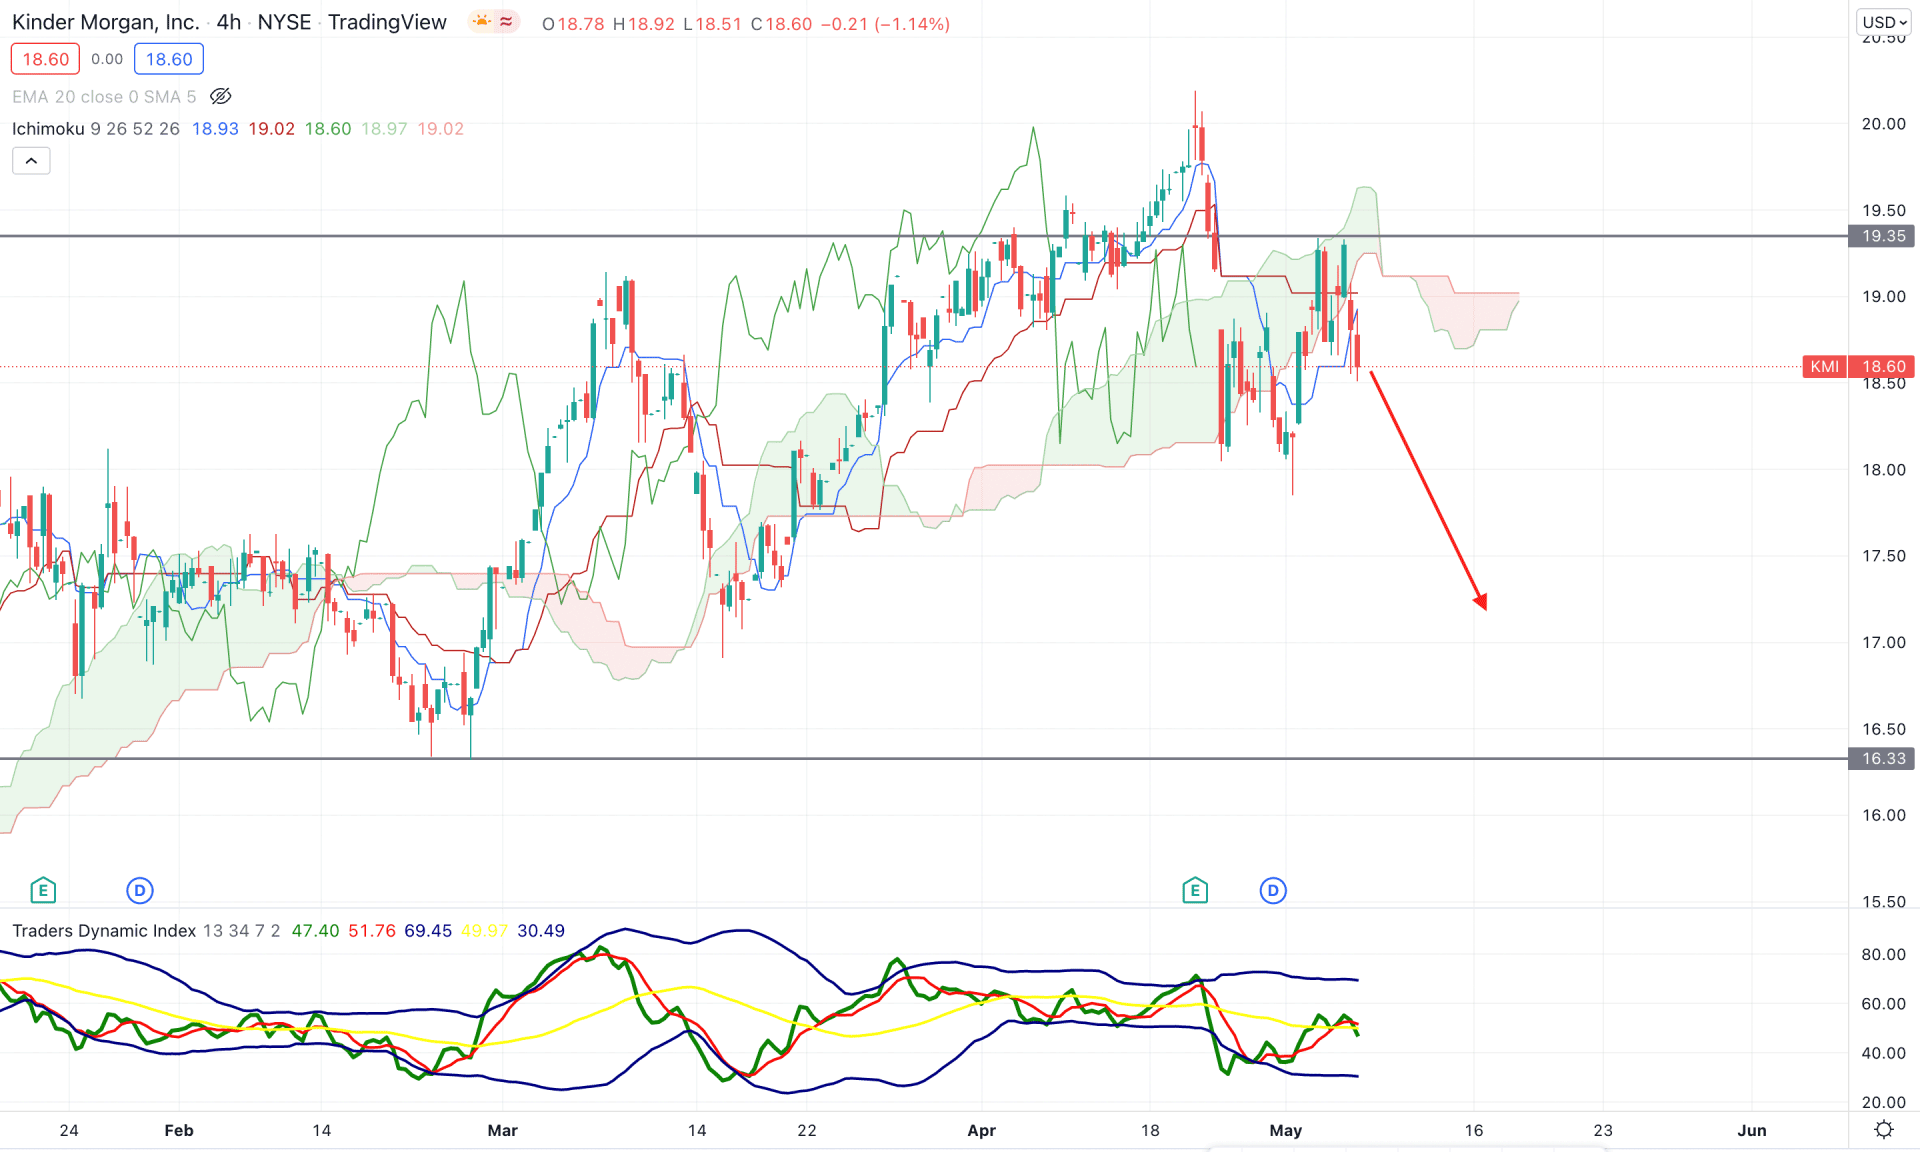
According to the Ichimoku Cloud, the broader market direction from KMI stock is corrective as the price moved below the Kumo Cloud but failed to make a new swing low. Moreover, Senkou Span A and Senkou Span B reached closer, which is another sign of corrective price action. However, bears are more likely to win in this situation as the current price trades below the Kumo Cloud with a bearish rejection from the 19.35 resistance level.
The above image shows how the Traders Dynamic Index (TDI) remained stable below the neutral 50 lines with a pending test to the lower band. Meanwhile, the dynamic Tenkan Sen and Kijun Sen are above the current price and work as minor resistance.
Based on the H4 context, the upcoming price direction would be bearish as long as it trades below the dynamic Kijun Sen. In that case, bears may take the price down towards the 16.33 support level in the coming days. On the other hand, a strong rebound with a stable price above the 19.50 level would be a buying sign in this instrument that may extend the bullish pressure towards the 22.00 area.
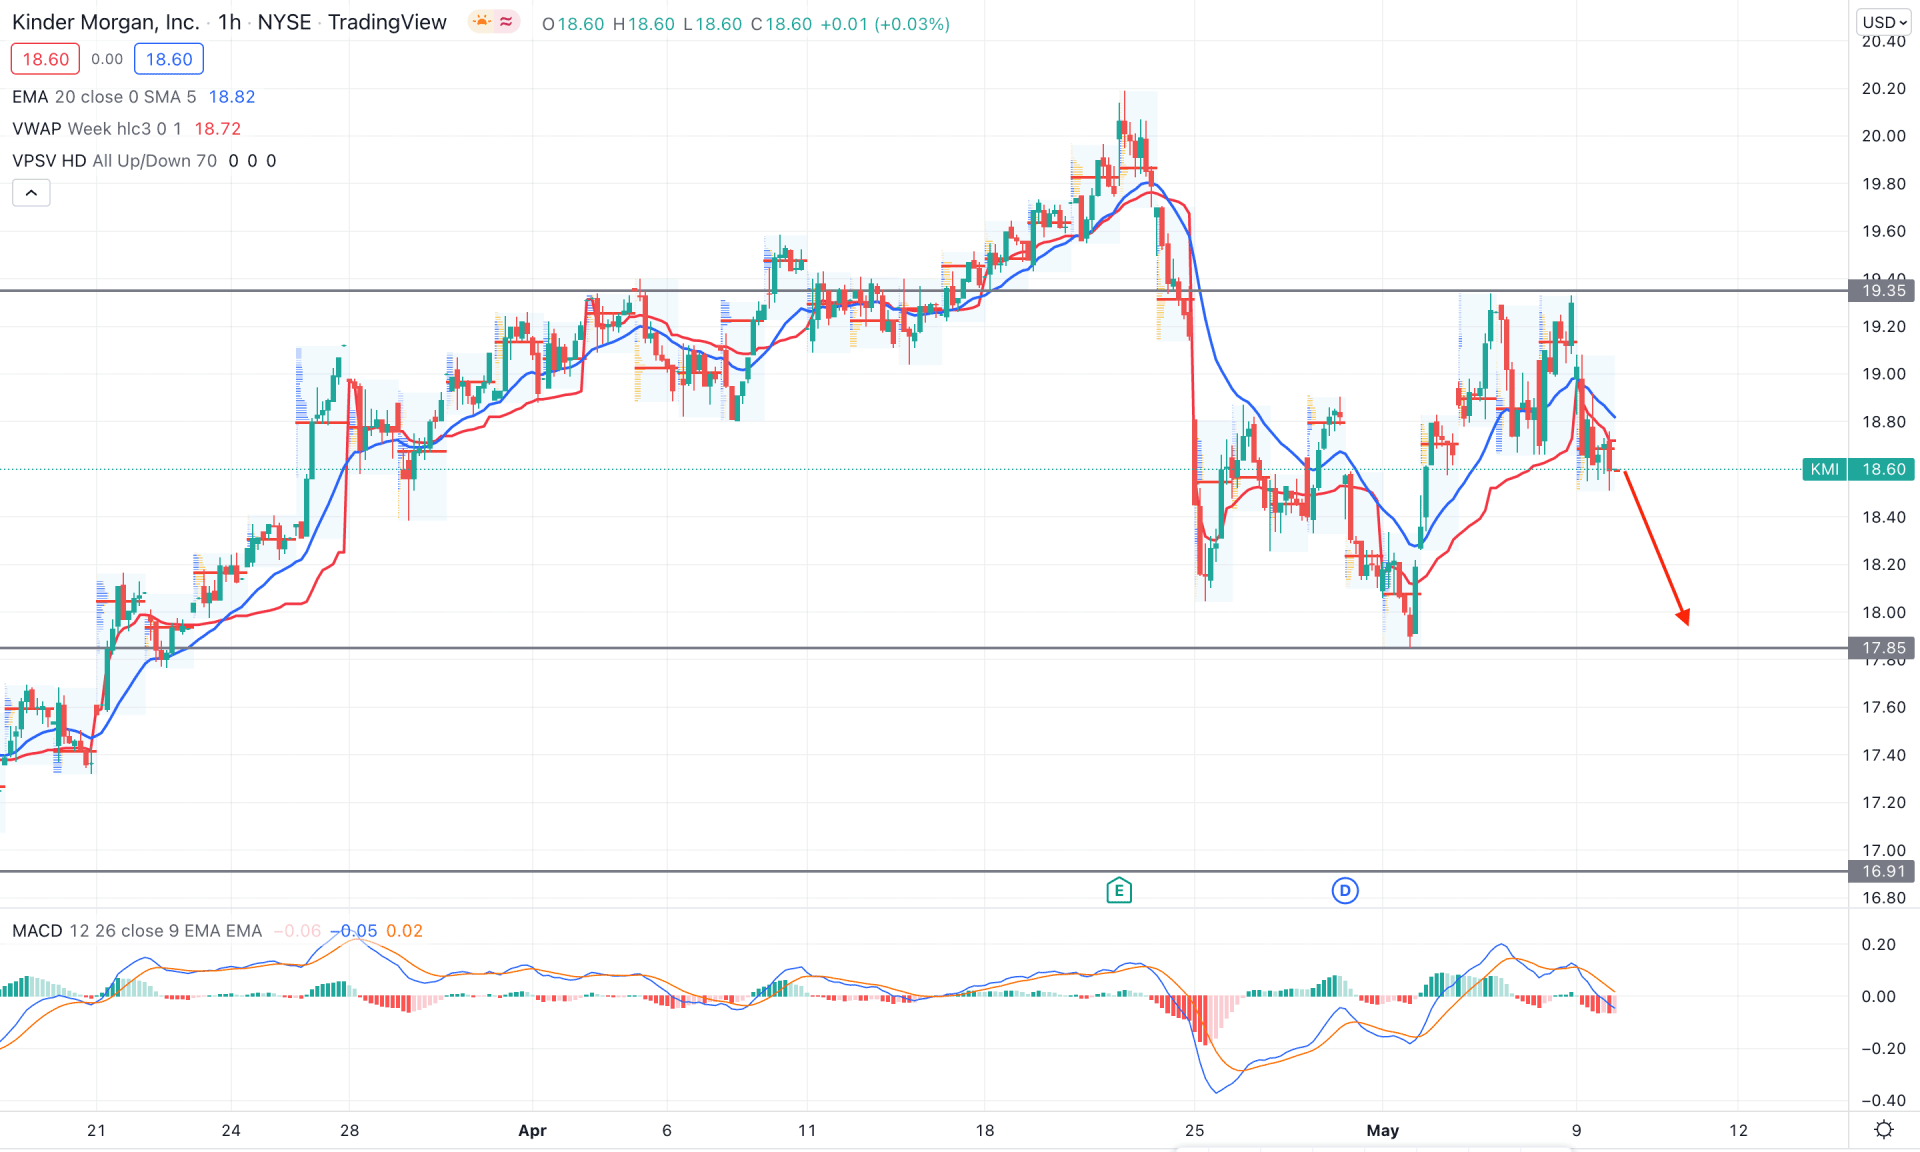
In the KMI intraday chart, the price is trading below the dynamic 20 EMA, while the most recent intraday high volume level is above the current price. The selling pressure is also backed by an impulsive movement from the 20.00 swing high and bearish rejection from the 19.35 intraday resistance level.
The above image shows the H1 chart of Kinder Morgan Stock (KMI), where the current price is below the dynamic weekly VWAP while the MACD histogram is bearish. The selling pressure towards the 17.85 level is likely to happen as long as it trades below the dynamic 20 EMA.
As per the current market context, KMI's long-term bullish continuation pattern needs confirmation from the 17.86 trendline support with a bullish rejection. On the other hand, the intraday price is bearish, which may open a bearish opportunity for grabbing the liquidity below the trendline support.