
Published: August 10th, 2021
JPMorgan is one of the biggest banks in the US by market value. Therefore, investors consider it as a window into the US consumer spending and corporate outlook. Thus, the recent bullish breakout in the JPM stock is a sign of a post-pandemic recovery of the US economy.
On the other hand, the Federal Reserve chairman said that the economy might need more time to recover from the current delta variant in some states. However, the vaccination rate remains strong while economic reopening has started, and investors can see the impact on the stock market soon.
Suppose we look at the company’s performance where would see that the 2nd quarter revenue came with $3 billion from loan loss reserve with a boost to the pandemic recovery. Besides, the revenue from trading has slowed from the previous year. The bank increased its quarterly dividend payment to $10, up from 90 cents in the last quarter.
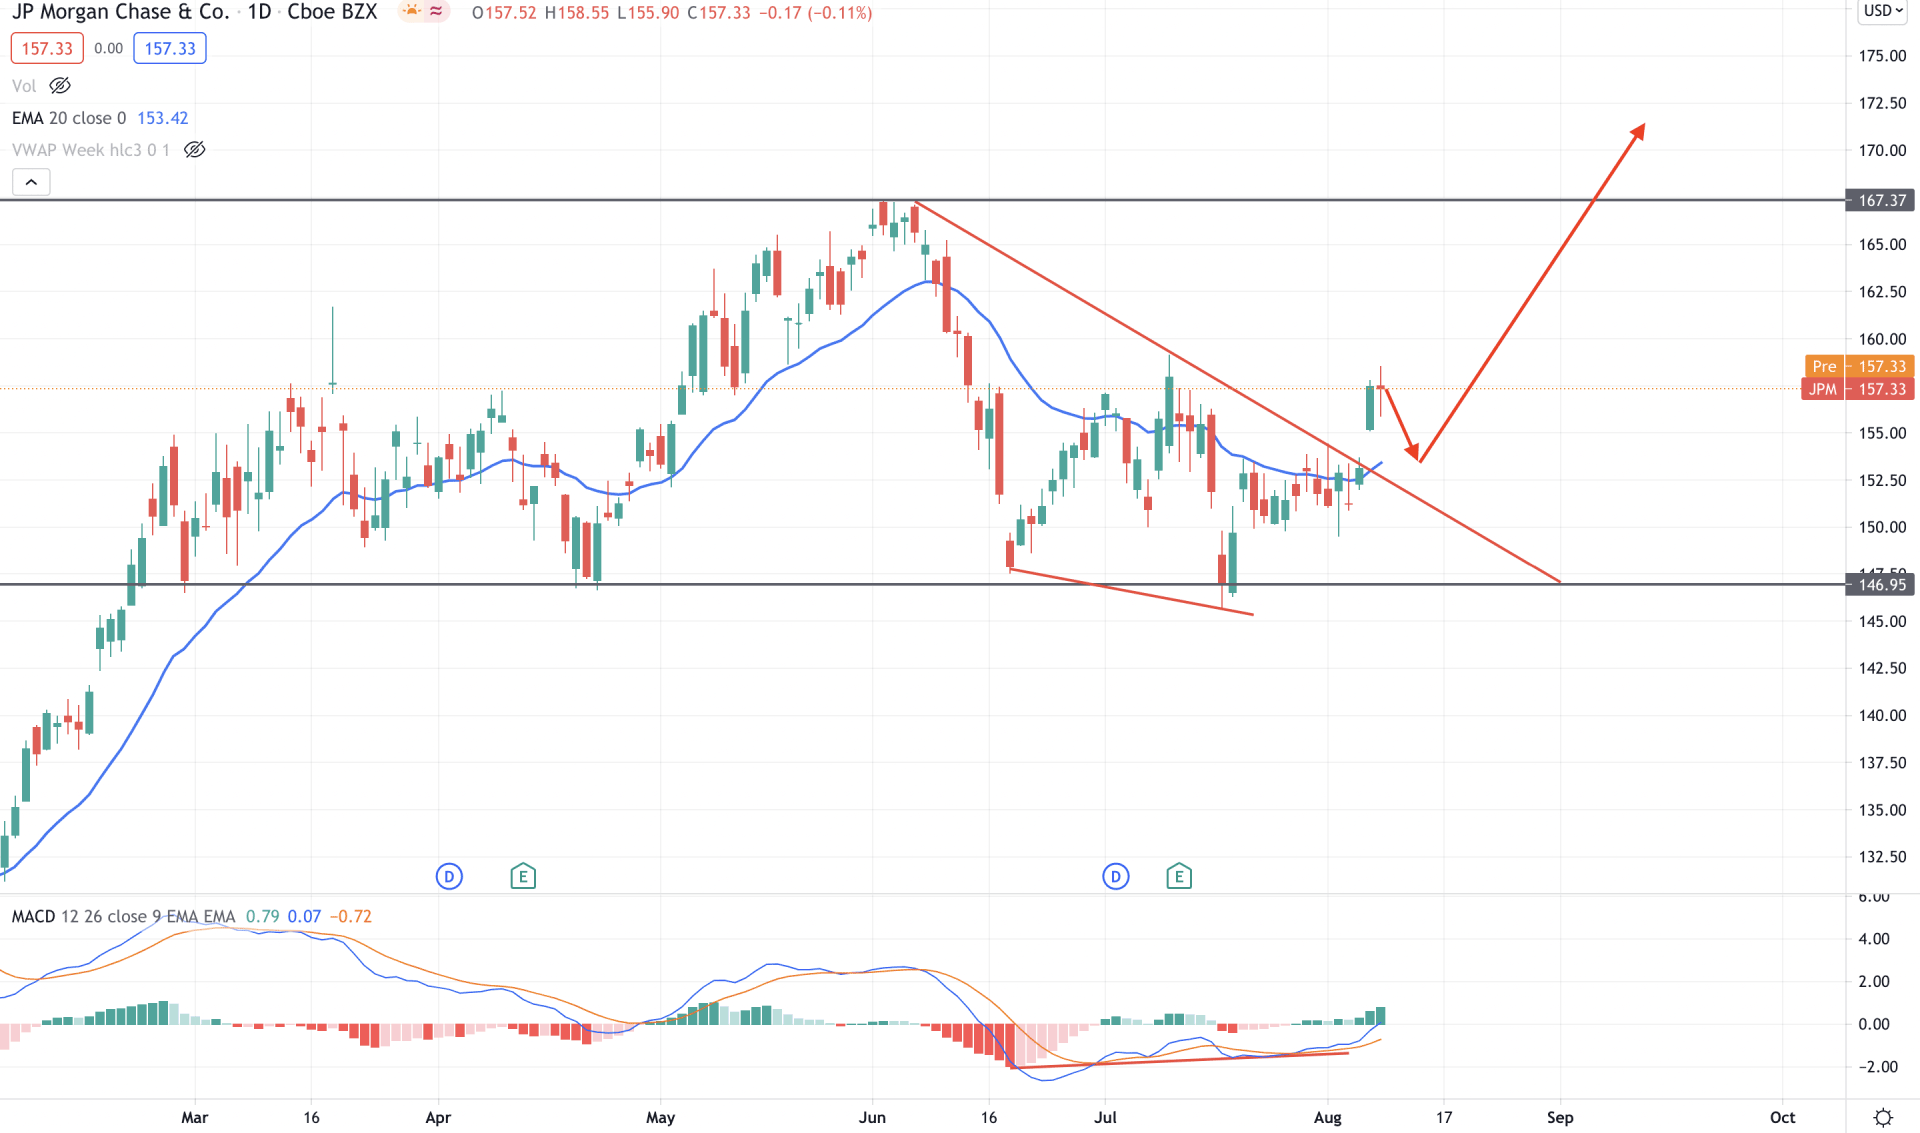
JPMorgan showed a strong recovery after the COVID-19 pandemic in 2020 that took the price higher towards an all-time high at the 167.37 level. Later on, the price corrected lower but failed to hold below the $150.00 key level for a considerable time. This week, the price moved above the dynamic 20 EMA and trendline resistance that created further bullish possibilities in the coming days.
In the above image, we can see the daily chart of JPMorgan stock where the price moved above the dynamic 20 EMA with a strong bullish daily close. Moreover, the bullish pressure is backed by a potential Regular divergence in MACD.
In the indicator window, we can see that the price moved lower but failed to show bearish pressure below the 146.95 support level. Moreover, MACD Histogram turned bullish and made new highs, which is an indicator of an upcoming buying pressure. In this context, the price is more likely to continue the bullish pressure above the 170.00 level in the coming days.
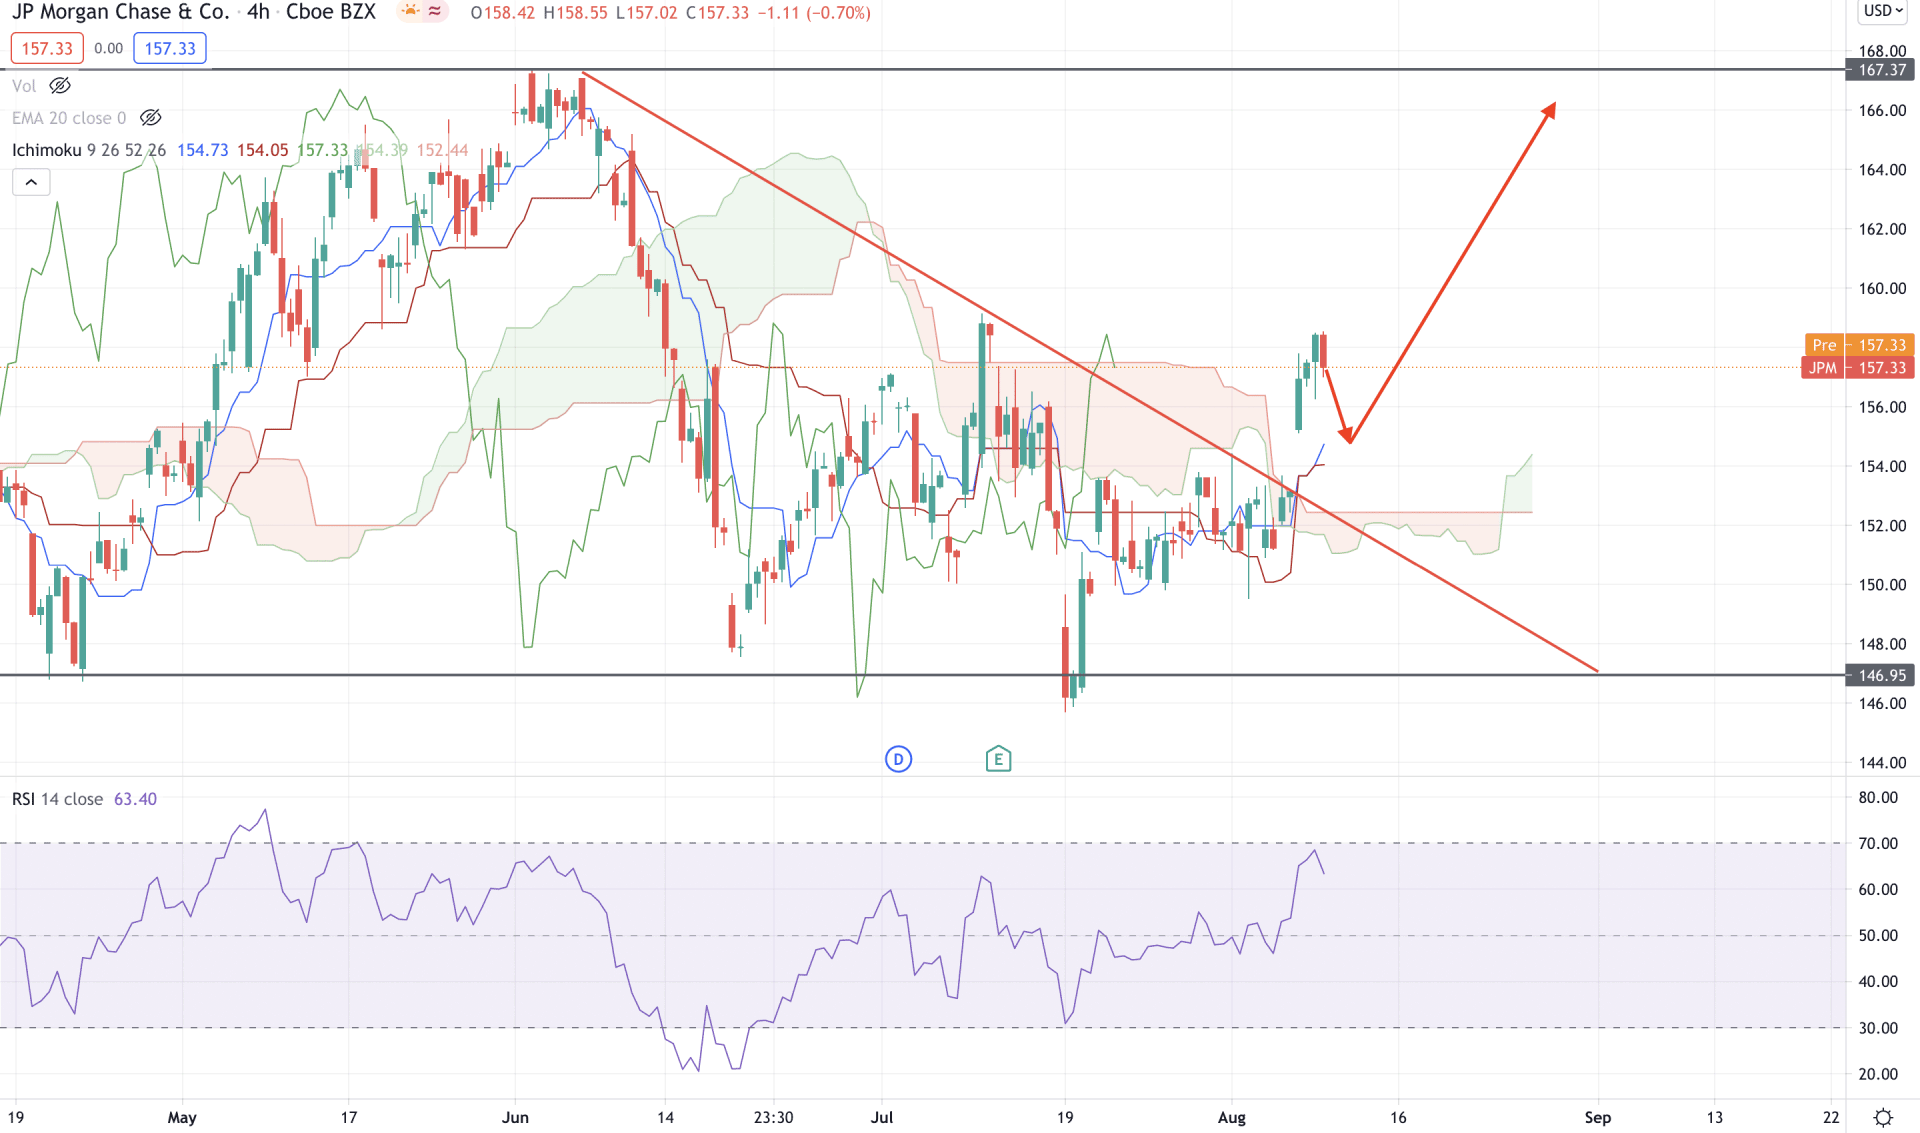
In the H4 timeframe, JPMorgan stock moved higher above the Cloud support with a bullish H4 close. Moreover, the future cloud is bullish as the Senkou Span A is above the Senkou Span B and aiming higher. Moreover, Chikou span is also above the price and striving higher. Therefore, based on the Ichimoku Cloud, JPMorgan stock is more likely to continue the bullish pressure in the coming days.
In the above image, we can see that the price moved above the cloud resistance after the break that created a possibility of a minor correction. The Tenkan Sen and Kijun are near and aiming higher. Therefore, any bearish correction towards dynamic Tenkan Sen may increase the buying pressure towards the 170.00 area. On the other hand, a strong bearish H4 close below the 151.00 level may start a broader correction to the price.
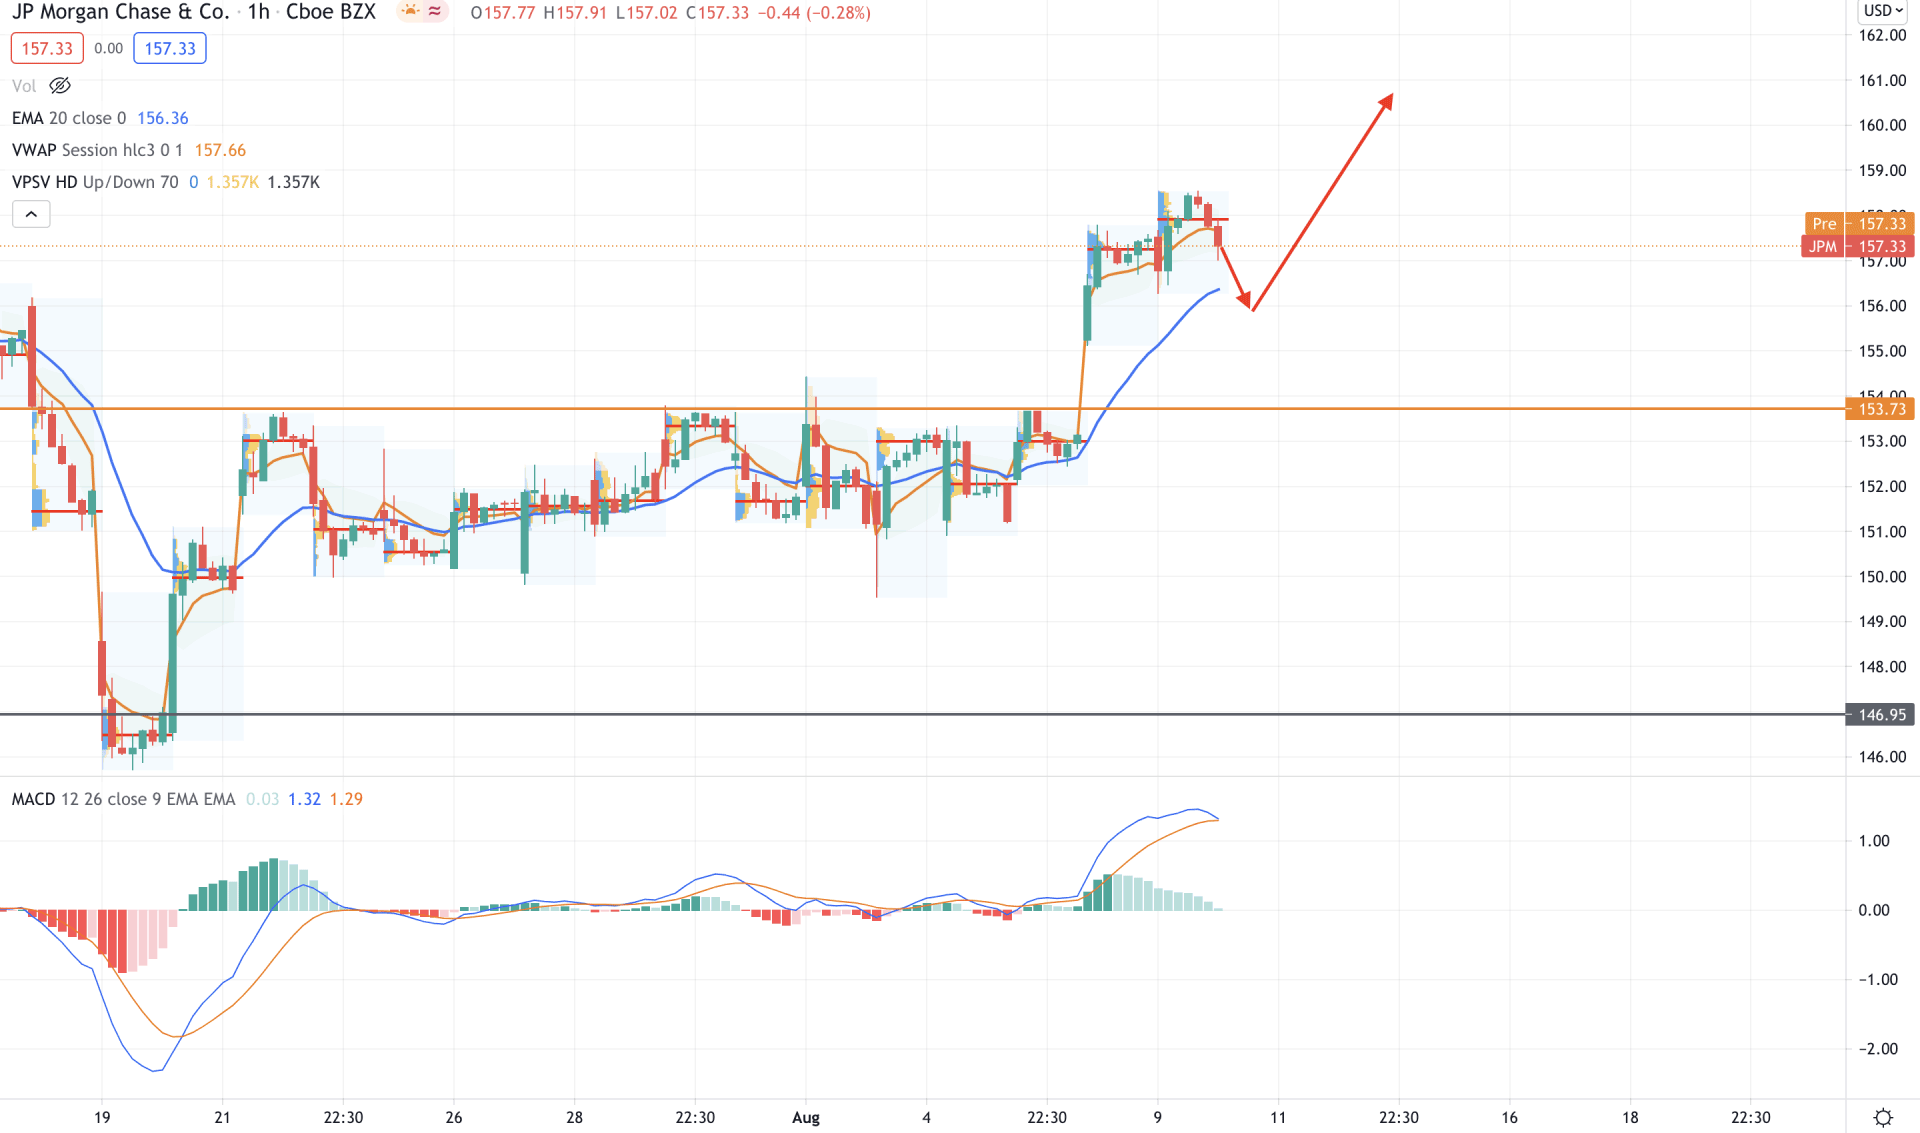
In the intraday chart, JPMorgan stock became extremely bullish after getting rejected from the 146.95 support level. Therefore, the price moved higher and broke above the 153.73 resistance level. In that case, as the price is trading above the 153.73 level, we may expect that the price will move higher in the coming session.
In the H1 timeframe, we can see that the price move moved lower below the most recent high volume level of 157.92 and dynamic vwap level. Therefore, the price may move lower towards the 153.73 level before showing any strong bullish pressure.
In the indicator window, MACD Histogram shows a buying pressure as it moved to zero levels. Therefore, the buying possibility may get strength if the MACD Histogram makes a new high from the zero levels. On the other hand, a break below 153.73 may require waiting a bit and observe the market.
As of the above observation, we can say that the JPMorgan stock may move higher above the $170.00 level in the coming days. However, a minor bearish correction is pending as the price is above dynamic Kijun Sen in H4 and 20 EMA in H1.
On the other hand, a stable bearish H4 close below the 150.00 level may alter the current market structure and initiate a broader correction to the price.