
Published: April 20th, 2022
Jasmy is an IoT company aiming to buy and sell data through the Jasmy Platform. According to the whitepaper of Jasmy, the platform's main aim is to realise data democracy for decentralised finance, where data will be protected by each individual through Jasmy’s locker.
Since its inception, Jasmu has faced a lot of trouble, but the use of the decentralised network to store data eliminated most of the drawbacks. The native token of this platform is JasmyCoin (JASMY), built on the Ethereum network. The main users of JASMY are companies who use the data locker of the Jasmy platform.
Currently, 4.7B Jasmy tokens are in circulation among the total of 50B tokens as the maximum supply with a market cap of $124 million. The recent buying pressure is also supported by an increase in the volume. The volume for the last 24 hours was $1,609,688,114, 12.88% up from the previous day. As the price completed the bearish correction after the March 2022 swing, it is ready to show another bullish pressure.
Let’s see the future price direction from the JASMY/USDT Technical analysis.
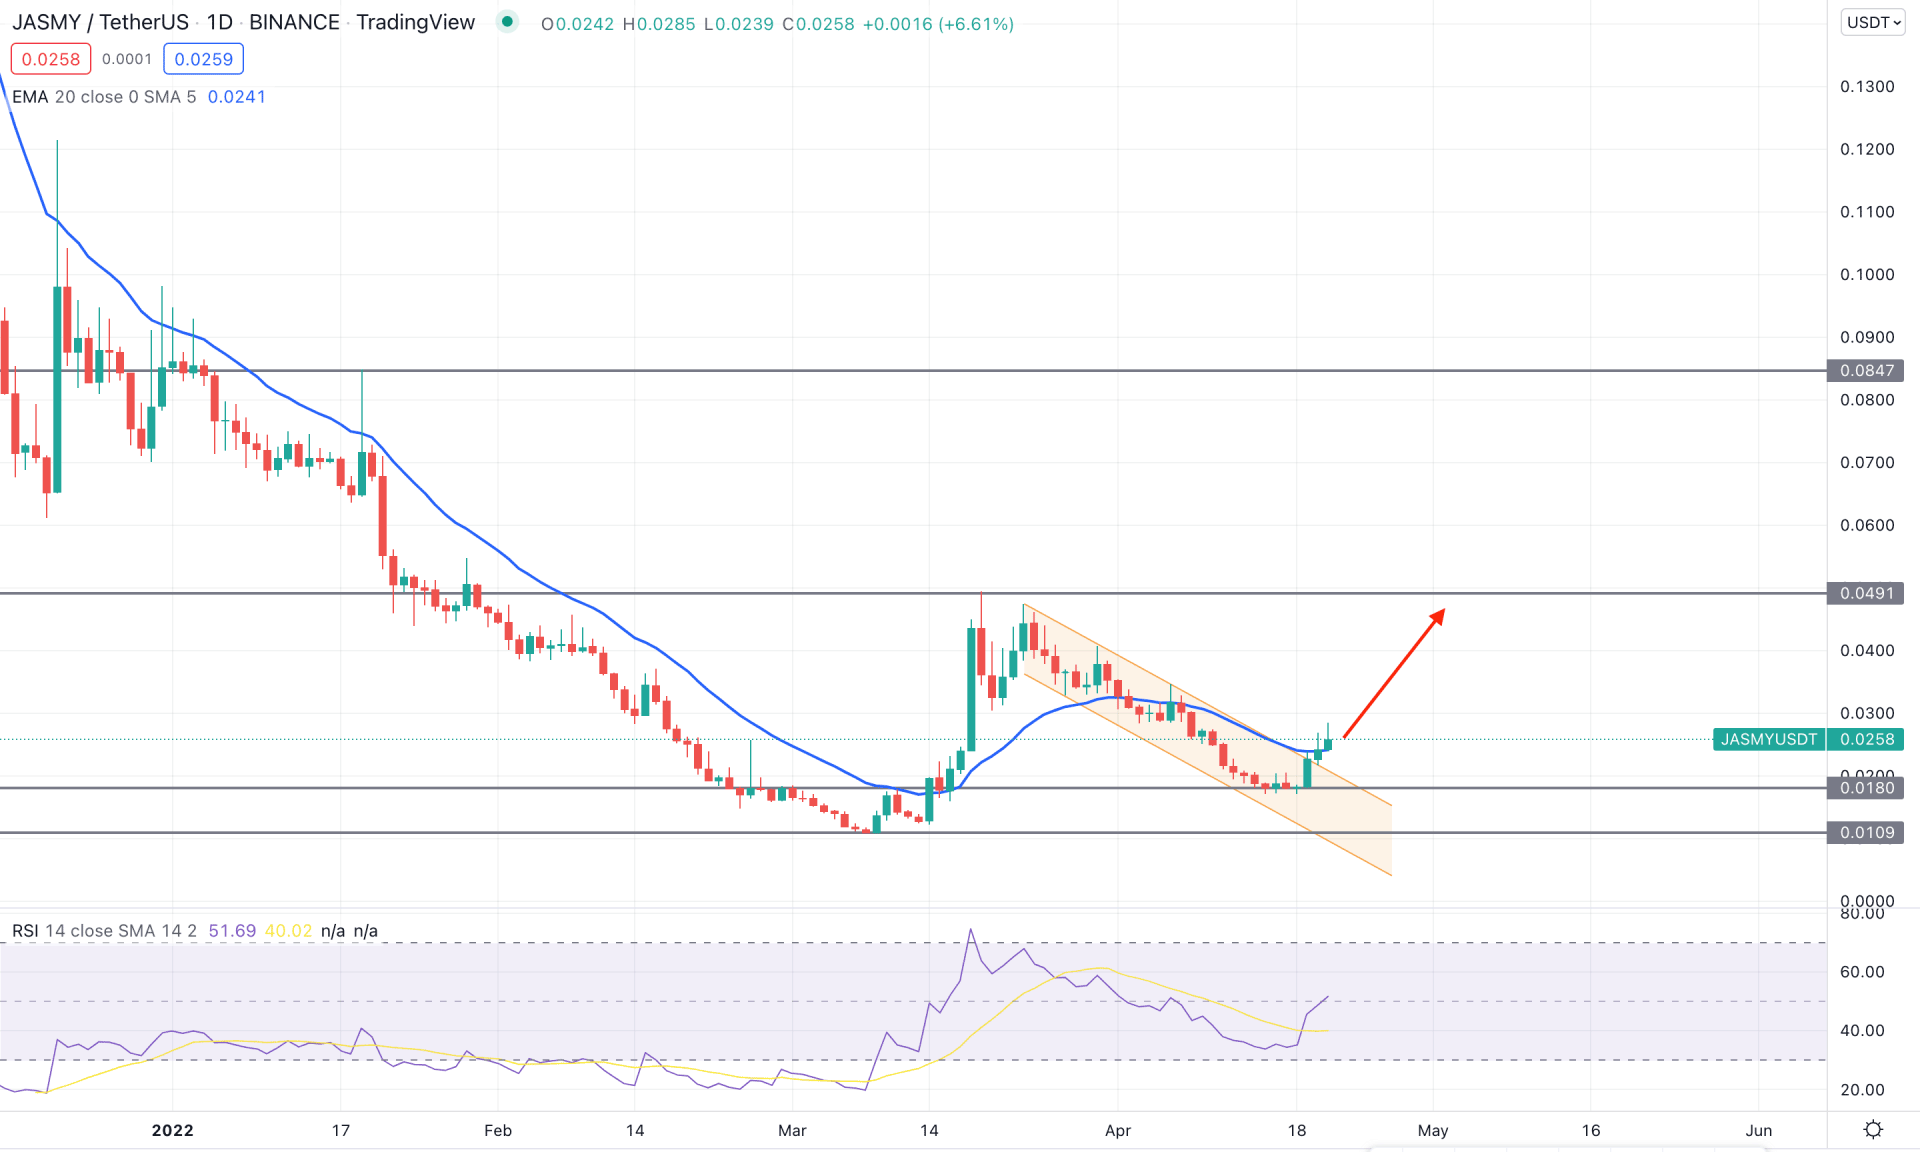
In the daily chart, JASMY/USDT started 2022 with a bearish sentiment where the price reached the 0.0109 bottom before breaking the trend with strong bullish pressure in March 2022. After testing the 0.0490 swing high, the price moved lower within a bearish channel. As the recent price shows another bullish channel breakout with a daily candle above the dynamic 20 EMA, we expect the price to move higher in the coming days.
The above image shows how the price moved higher from the bearish channel breakout while the RSI turned bullish by moving above the 50 neutral level. As per the market context, the price is likely to form a bullish impulsive pressure followed by a bearish correction from 0.0490 swings high to 0.0180 swing low. Moreover, the dynamic 20 EMA is working as immediate support to the price from where any bullish signal would increase the buying pressure towards the 0.0490 level.
As per the daily context, bulls are more likely to extend the current price towards the 0.0490 key resistance level in the coming days. However, the buying pressure is valid as long as it trades above the 0.0109 level. Any break below the 0.0109 level with a bearish daily candle would eliminate the current bullish momentum and create a new all-time low in the price.
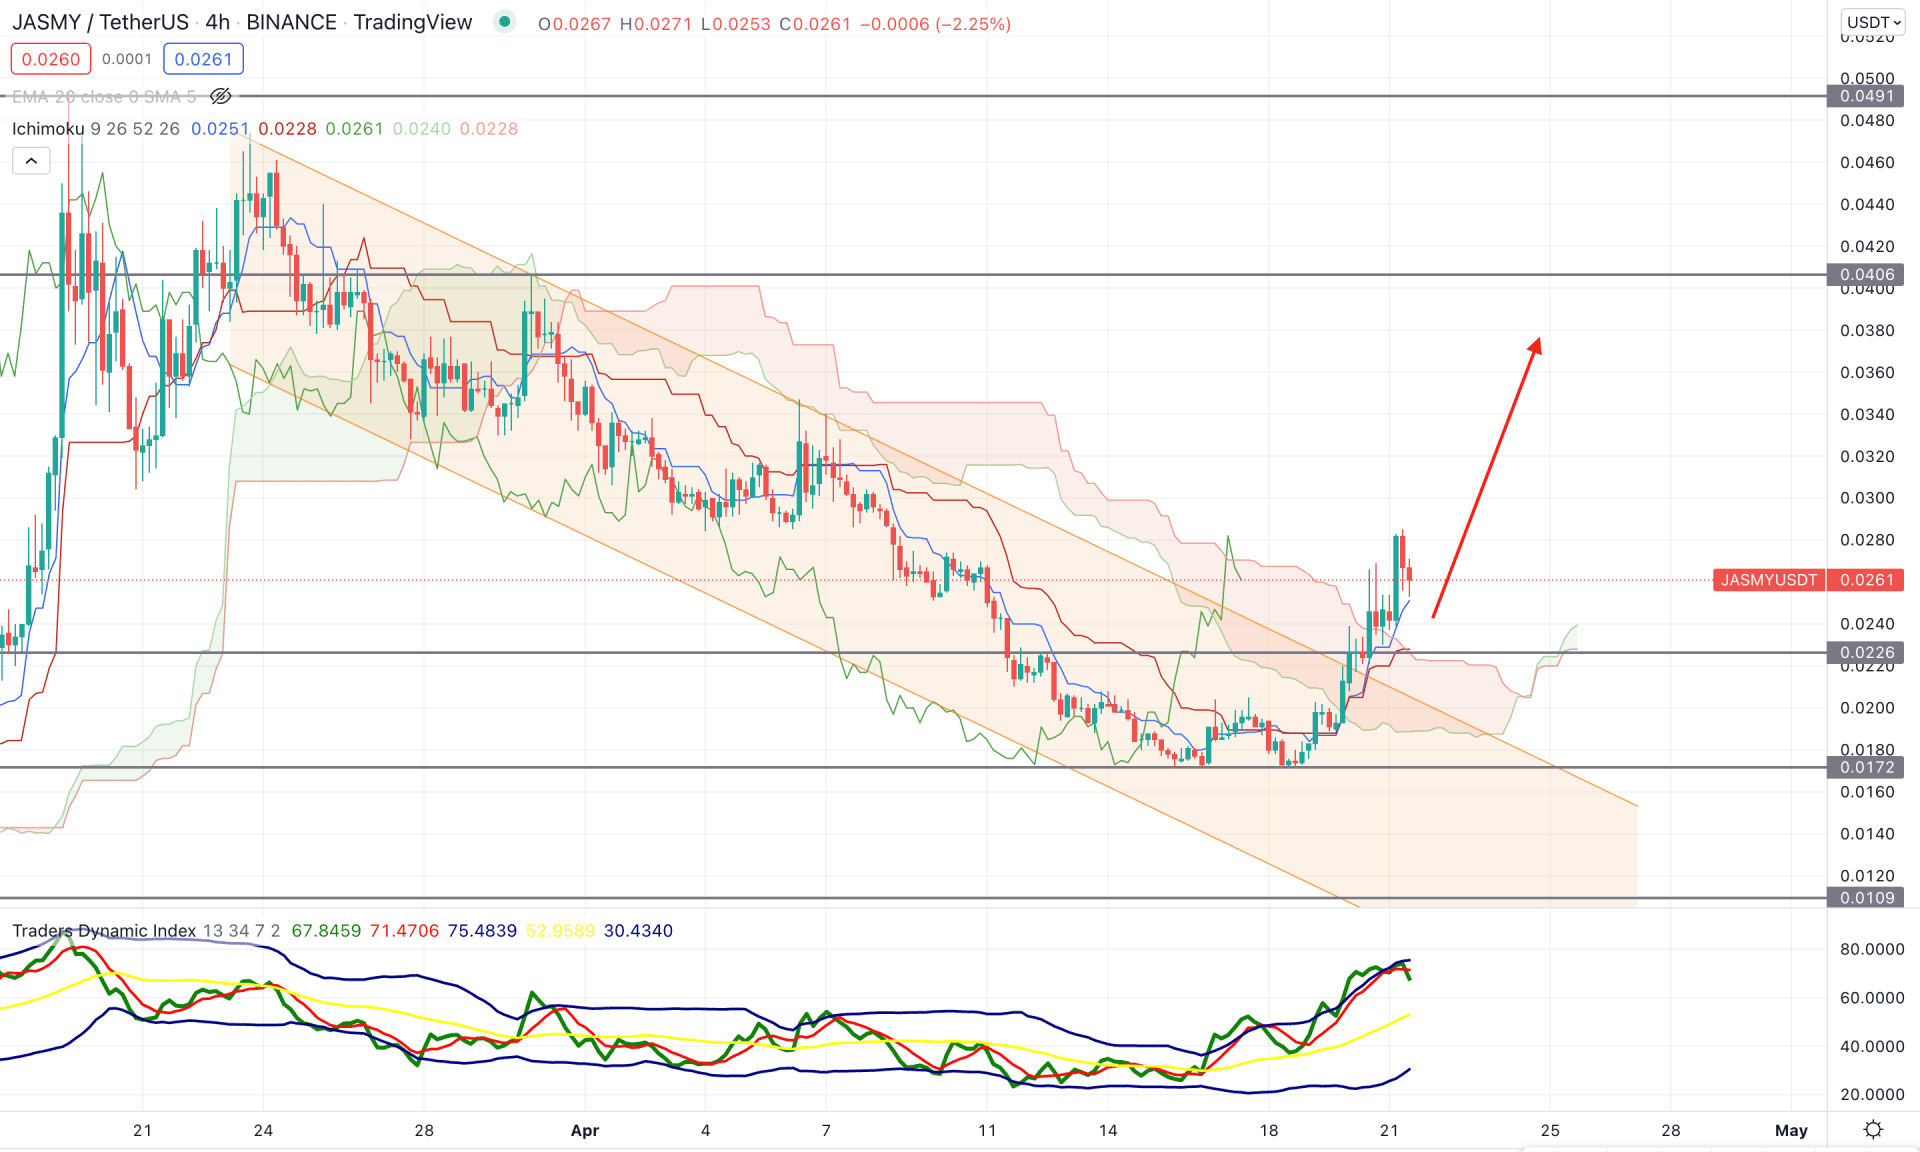
According to the Ichimoku Cloud, the JASMY/USDT H4 chart shifted its direction from bearish to bullish as soon as the price broke above the Kumo Cloud with an impulsive bullish pressure. Moreover, the extreme buying pressure changed the sentiment of Future cloud, where the Senkou Span A moved above the Senkou Span B and aimed higher.
The indicator window shows an increase in buyers activity from the Traders' dynamic index, which is currently at the upper band area. Although a bearish correction is pending in the TDI, the buying pressure is valid as long as the TDI is above the 50 level. On the other hand, the price moved above dynamic Tenkan Sen and Kijun Sen, indicating further bullishness.
Therefore, any bullish rejection from 0.0240 to 0.0200 area with a candle close above the dynamic Tenkan Sen would be a potential buying opportunity in this pair where the primary target is to test the 0.0400 key level. On the other hand, the alternative approach is to wait for the price to break below the 0.0172 level to find a selling opportunity.
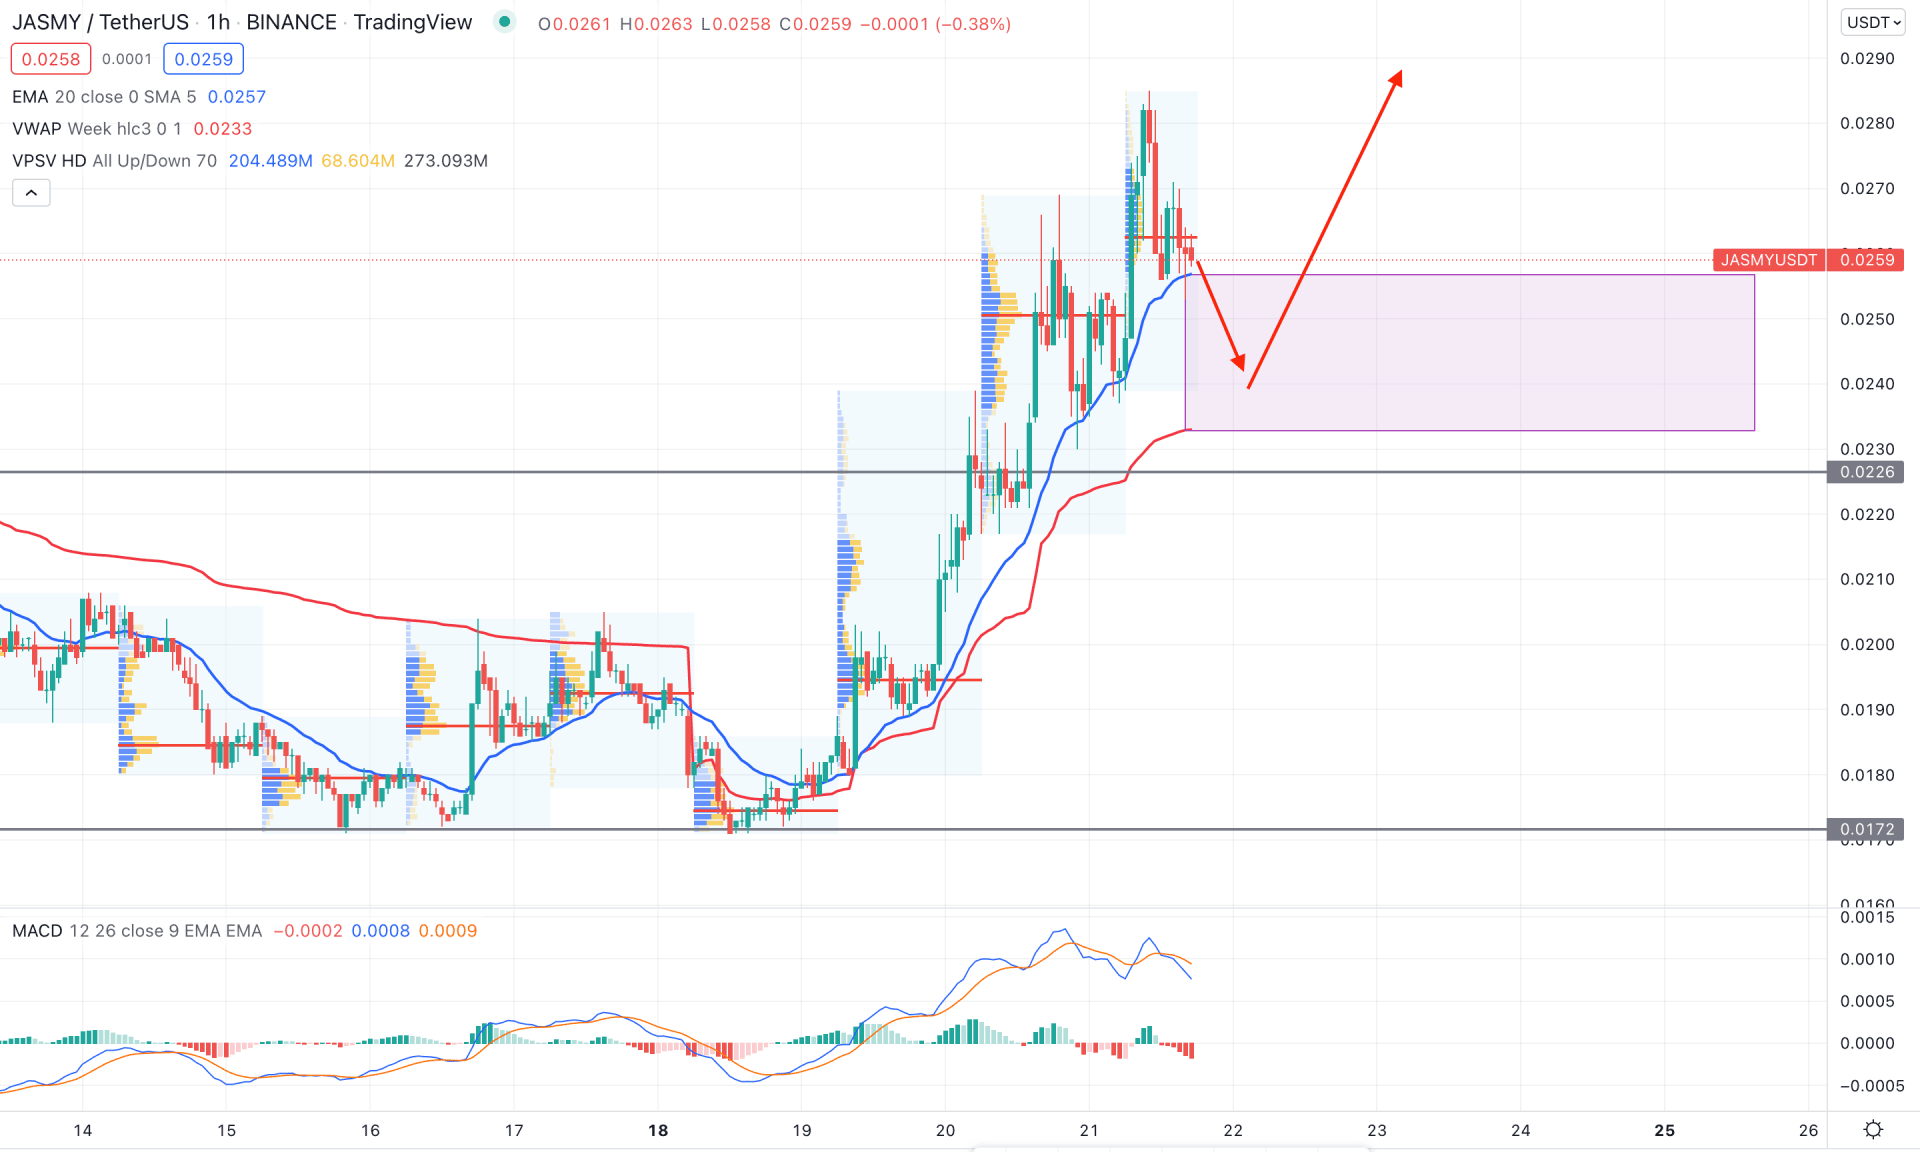
In the intraday chart, JASMY/USDT is trending up where the most recent price moved above dynamic 20 EMA while the most recent high volume level is near the current price. In that case, an upside pressure is likely to happen until the price moves below the static 0.0226 support level.
The above image shows that the price is holding at the dynamic 20 EMA support level, where the gap between the price and dynamic weekly VWAP is extended. On the other hand, the MACD Histogram is corrective. Therefore, if the price comes to the zone between dynamic 20 EMA and VWAP, we can expect the buying pressure to occur upon forming bullish rejection candlesticks.
Based on the current multi-timeframe analysis, JASMY/USDT is more likely to move up towards the 0.0490 resistance level with an 89% gain. On the other hand, investors should monitor how the price trades between 0.0226 to 0.0172 area as a daily candle below the 0.0170 would create a new all-time low in the price.