Published: April 10th, 2020
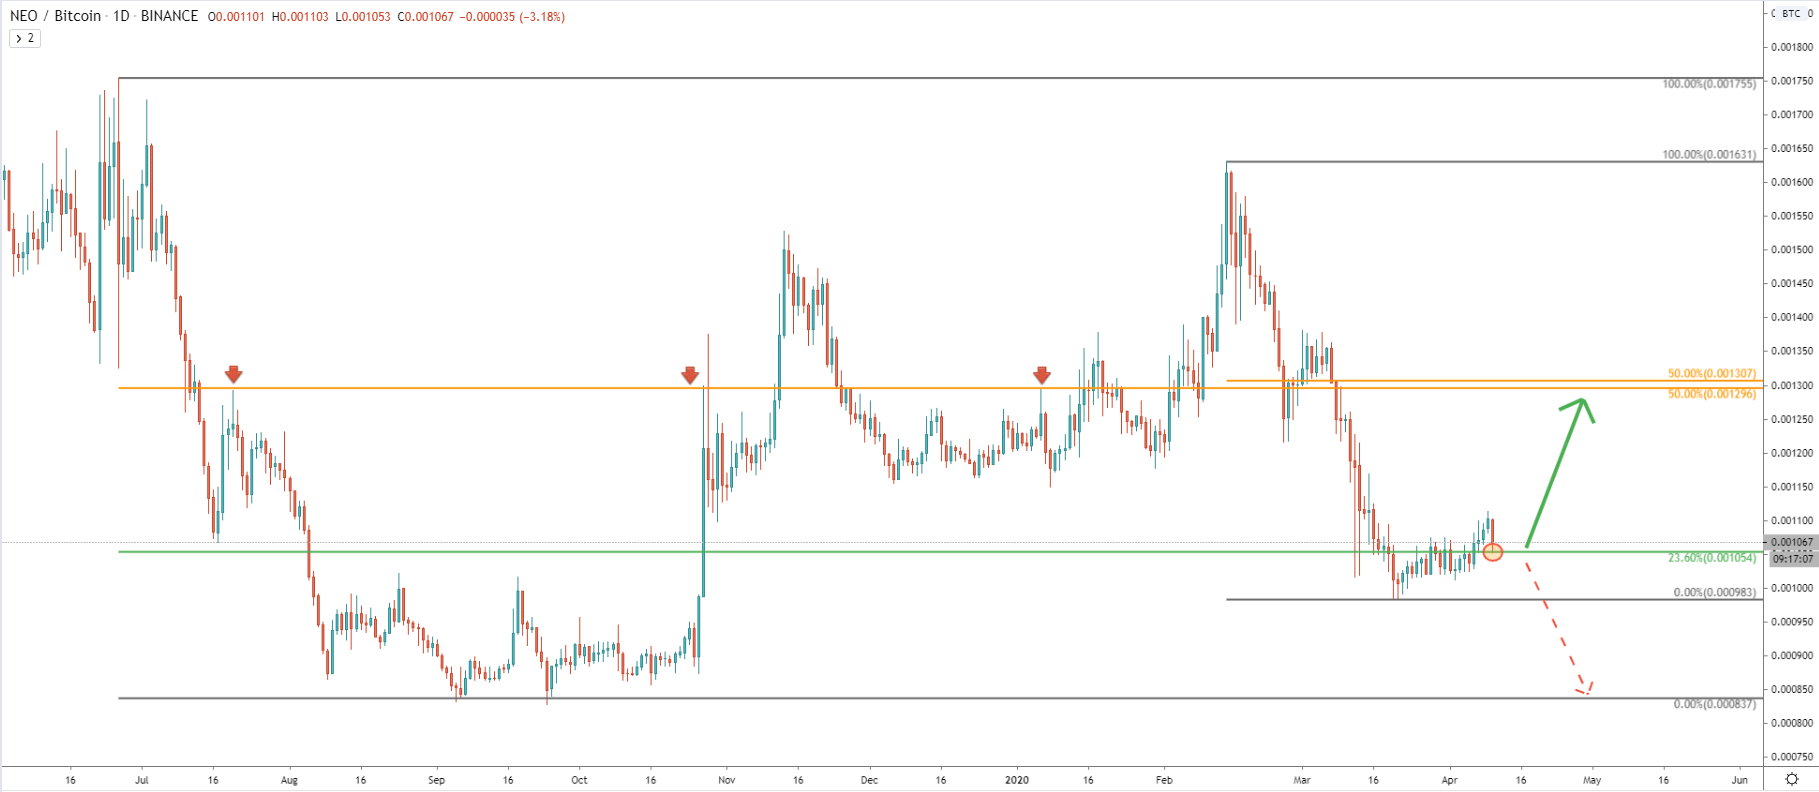
On the daily chart, we can see a massive range-trading on NEO/BTC cryptocurrency pair. It is quite obvious that there is a strong resistance level that has been formed near 0.00123 BTC, which is a 50% Fibonacci retracement level based on two different Fibs. The first is applied to the June-September 2019 downtrend, and the second is applied to February - March 2020 corrective wave down. Both Fibonacci levels show that 0.00130 BTC, is a very strong supply area and it is very likely that price will be pushed towards it once again.
We can also see that today NEO/BTC has approached the 23.6% Fibs at 0.001 BTC area, which so far is being respected by the market. It will be important to see the daily close, whether it manages to stay above the 0.001054 BTC price. If that will be the case, bulls could be starting to take control once again, sending the price up north.
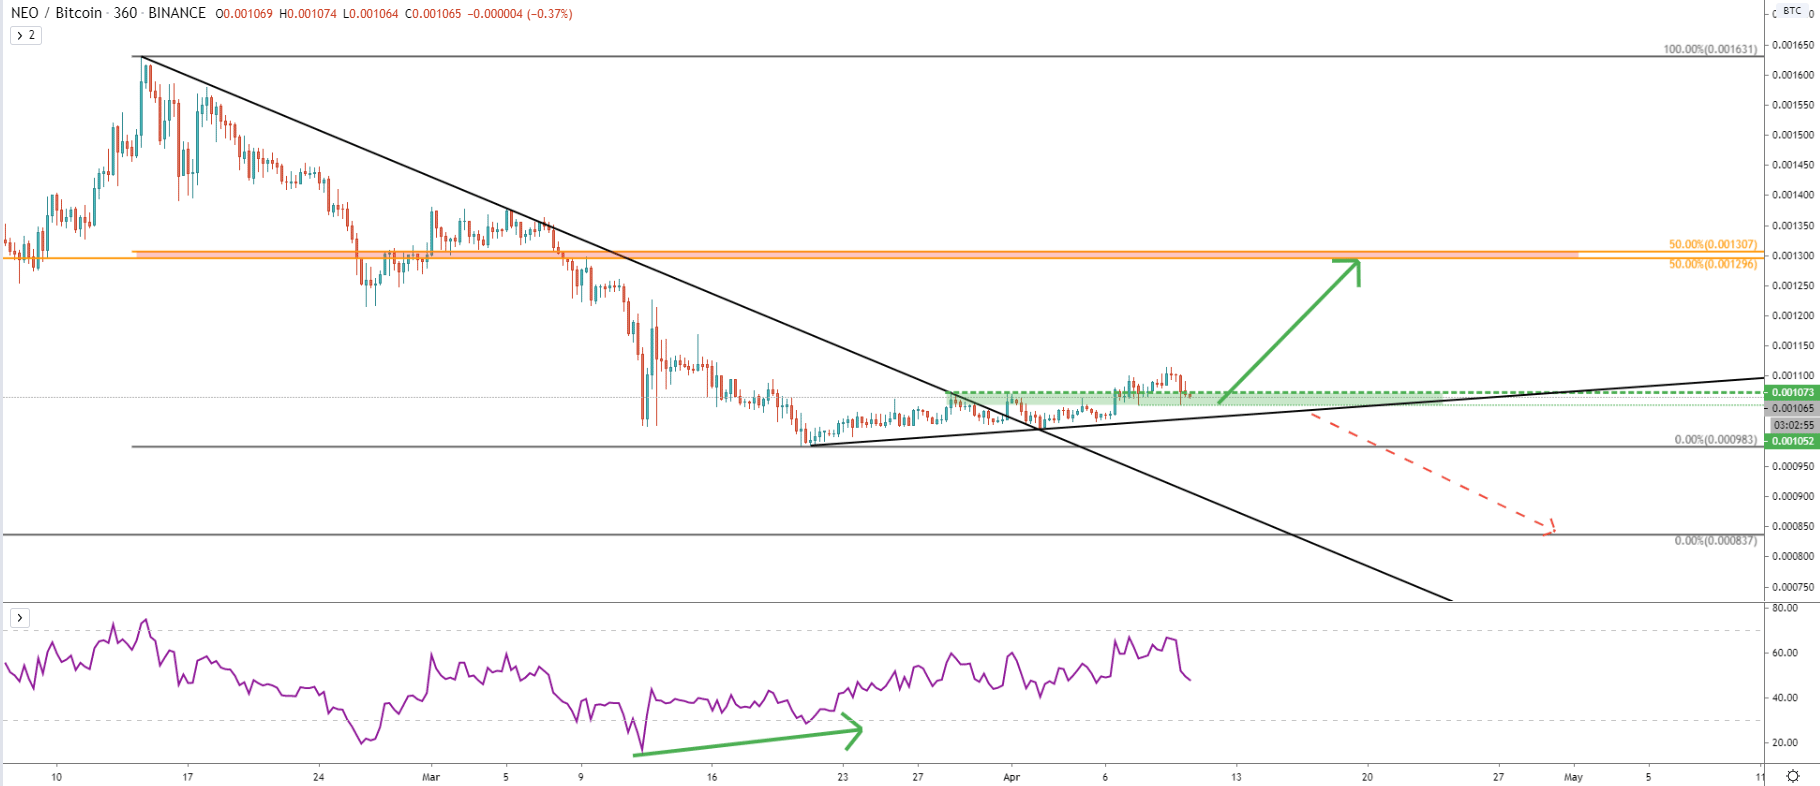
On the 6H chart, the downtrend trendline has been penetrated, which also shows that previously 0.00107 BTC was a resistance level, which currently is acting as the support area. Price is printing higher highs and higher lows indicating that it might be getting ready for a new wave up. But at the same time, NEO/BTC could first test the uptrend trendline, prior to the move up. The RSI bullish divergence also suggests that the price is about to reverse, although it could take more time for the pair to consolidate. If the uptrend trendline will be broken, the downside risk will be increase and could drop as lows as 0.000837 BTC support. However, up until this happens, the bullish scenario will be more likely.
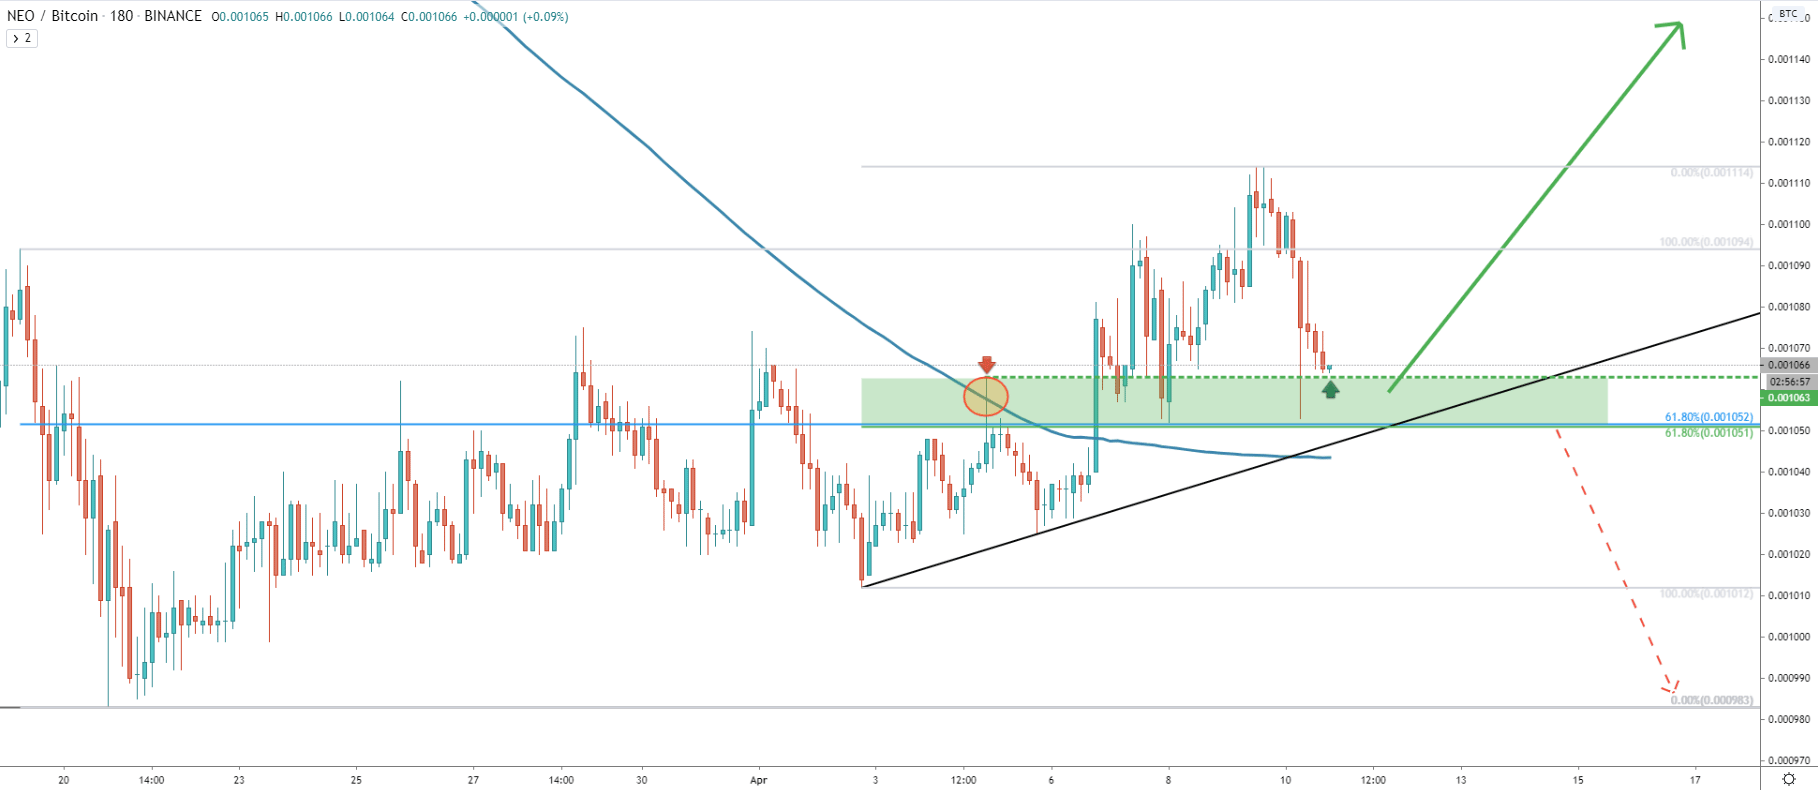
On the 3H chart, there is very strong support confirmed by two Fibonacci retracement levels. Both of them are 61.8% retracement and is based at 0.001050 BTC. Since this is a very important price, NEO can potentially go down to re-test it and even produce the spike down to hit the 0.001 BTC psychological level. But only daily break and close below 0.001 BTC should be considered as a continuation of the downtrend. Overall, there is a support level between 0.00105 and 0.00106 where price could be stuck for the time being. Probably the uptrend trendline will get tested once again before/if the uptrend will continue.
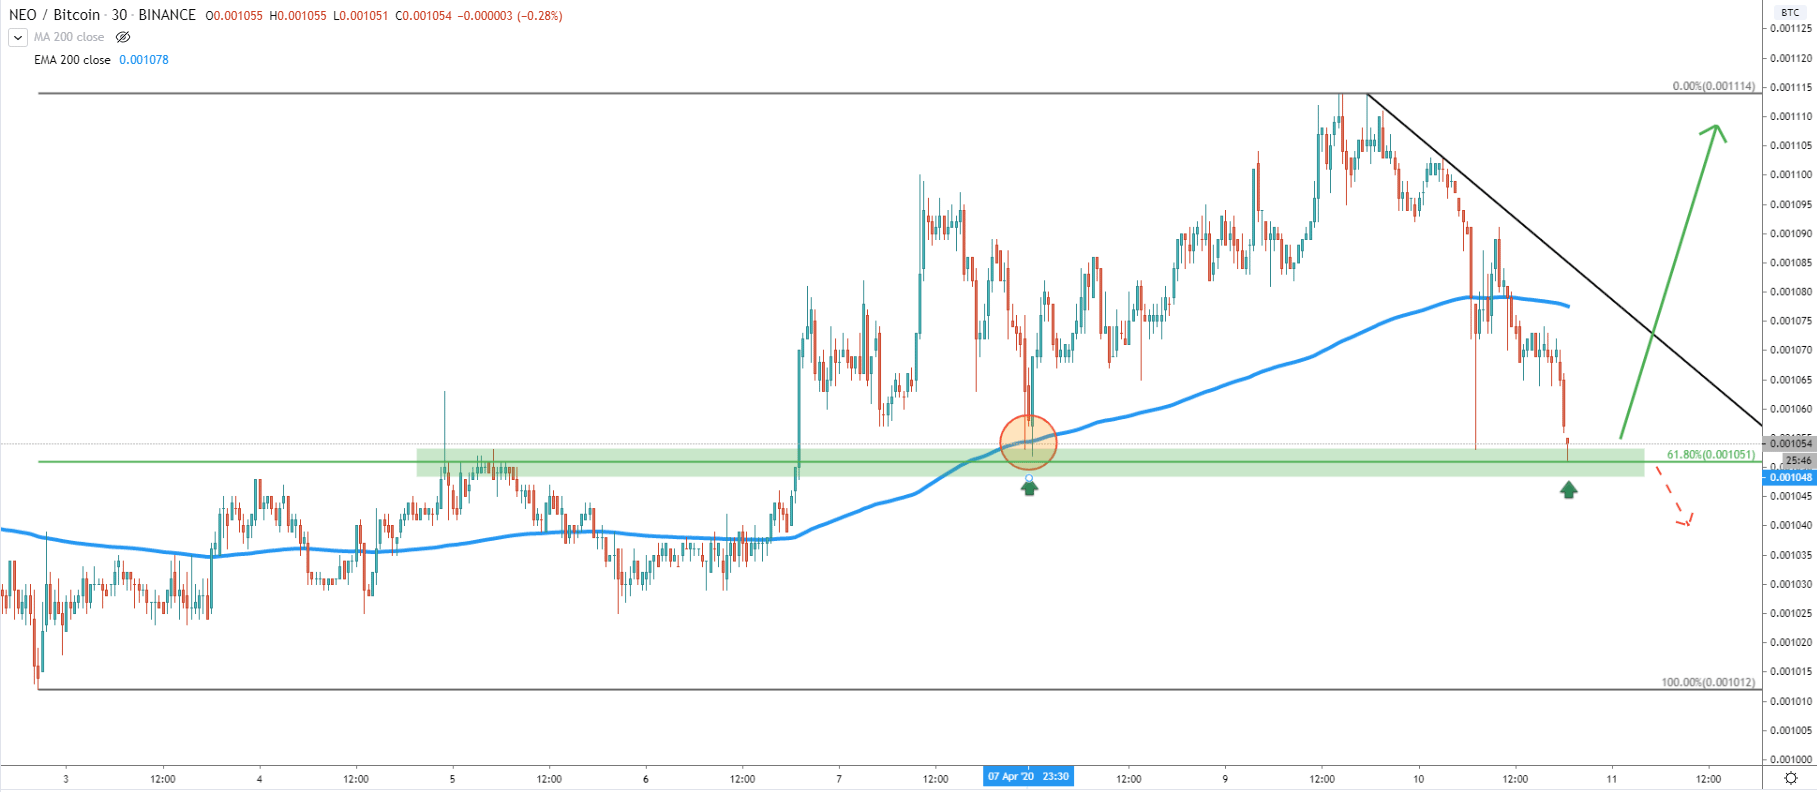
The lowest timeframe we will look at is 30M, which shows that just today NEO/BTC has reached yet another Fibonacci support level at 61.8% retracement. This is the very same 0.00105 level, which becomes more and more important to understand further price development. Perhaps the confirmation would be a break and close above the 200 Exponential Moving average on the 30M chart, along with the break above the downtrend trendline.
For now, it is “wait and see” time and we should pay attention to support and resistance levels to understand the probability of either a downtrend or even the beginning of a long term uptrend.
NEO/BTC could be in the decision-making area and currently, it is unclear on which side it will break. While the support is holding, the probability is in favor of the uptrend, although support level at 0.001 BTC must be monitored very closely for the daily break and close below.
The key long-term resistance is seen at 0.0013, which is confirmed by two 50% Fibonacci retracement levels. If/when this level is reached, it will result in a 30% growth for the NEO over the Bitcoin.
Downtrend probability is still there and remains quite high. Although for this scenario 0.001 BTC support level along with the uptrend trendlines must be broken.
Support: 0.00105, 0.0010
Resistance: 0.001114, 0.001300