Published: January 25th, 2022
In the fourth-quarter earnings report, IBM showed that the company earned $3.35 a share with a revenue of $16.7 billion. This result successfully beat analysts’ expectations of $3.30 a share and the revenue of $16.1 billion. As a result, the IBM stock faced a bullish gain with a spike in the intraday price.
The main revenue generator for IBM is its shift to the business structure from consulting business to cloud computing and AI. On the other hand, its health care based on data analytics business has a firm value of $1 billion. Quarterly, the revenue from cloud computing has moved by 16% to $6.2 billion, and on a yearly basis, the result came with a 20% gain or $20.2 billion.
IBM has undergone a massive structural change in the business where the focus on hybrid cloud computing might work as a key stock price driver. Moreover, the price appreciation from the cloud computing business is not yet over, leading to further growth possibilities for IBM investors.
Let’s see the upcoming price direction from the IBM Stock (IBM) technical analysis:

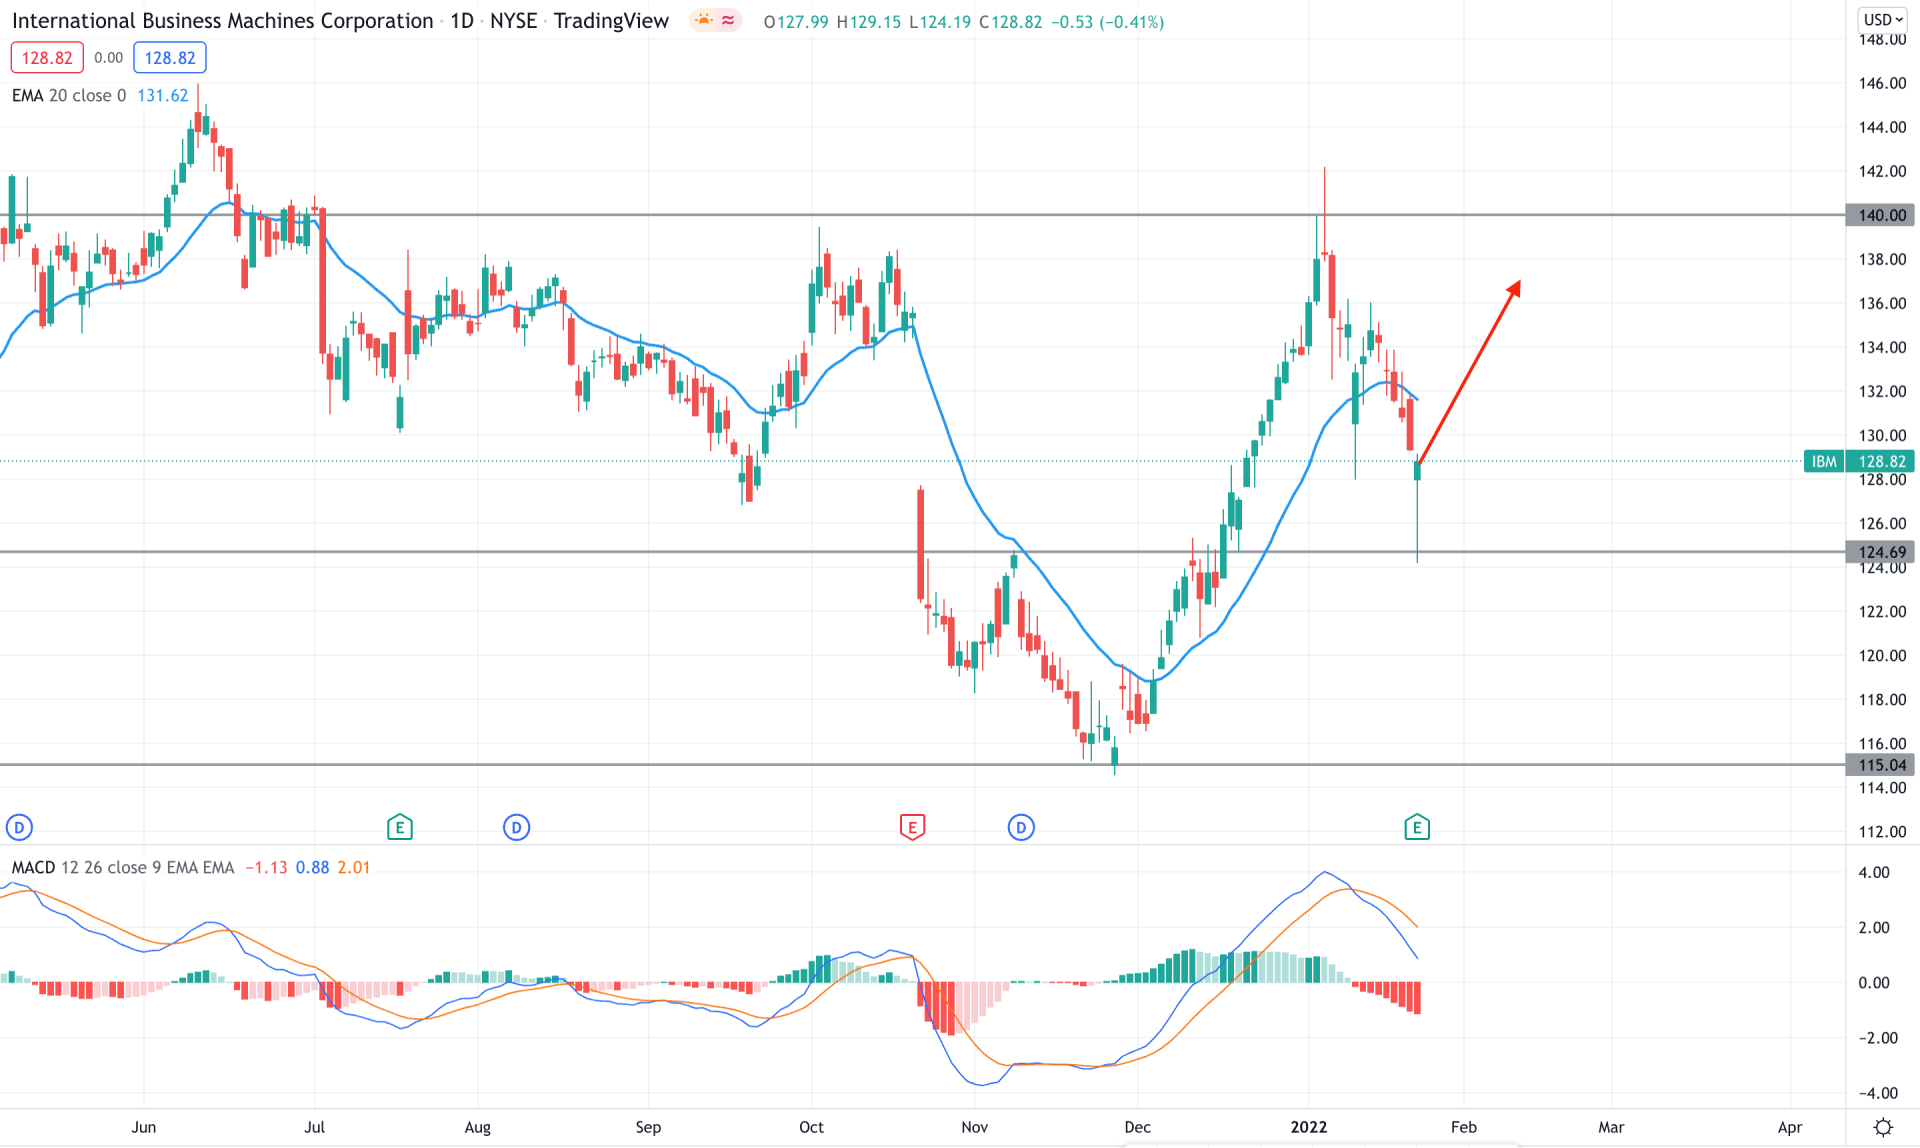
IBM stock showed a corrective momentum in recent days where the price found the 115.04 level as a bottom and 146.00 level as a top. Moreover, the rebound from the 115.04 level was potent as it took the price above the dynamic 20 EMA with a straight 19% gain. However, the recent downside pressure below the dynamic level found support at the 124.69 level with bullish exhaustion. Therefore, as the current price is above the 124.69 level with a bullish daily candle, further upside pressure may come in the coming days.
The above image shows how the MACD Histogram remained steady bearish below the neutral zone while the current price is trading below the dynamic 20 EMA with selling pressure. Although the price is in bear territory, a bullish daily candle above the dynamic 20 EMA would be a buying opportunity for this instrument.
Based on the daily chart, investors can consider the 124.69 level as a price changer whereas any bullish sign above this level is the potential to test the 140.00 level.

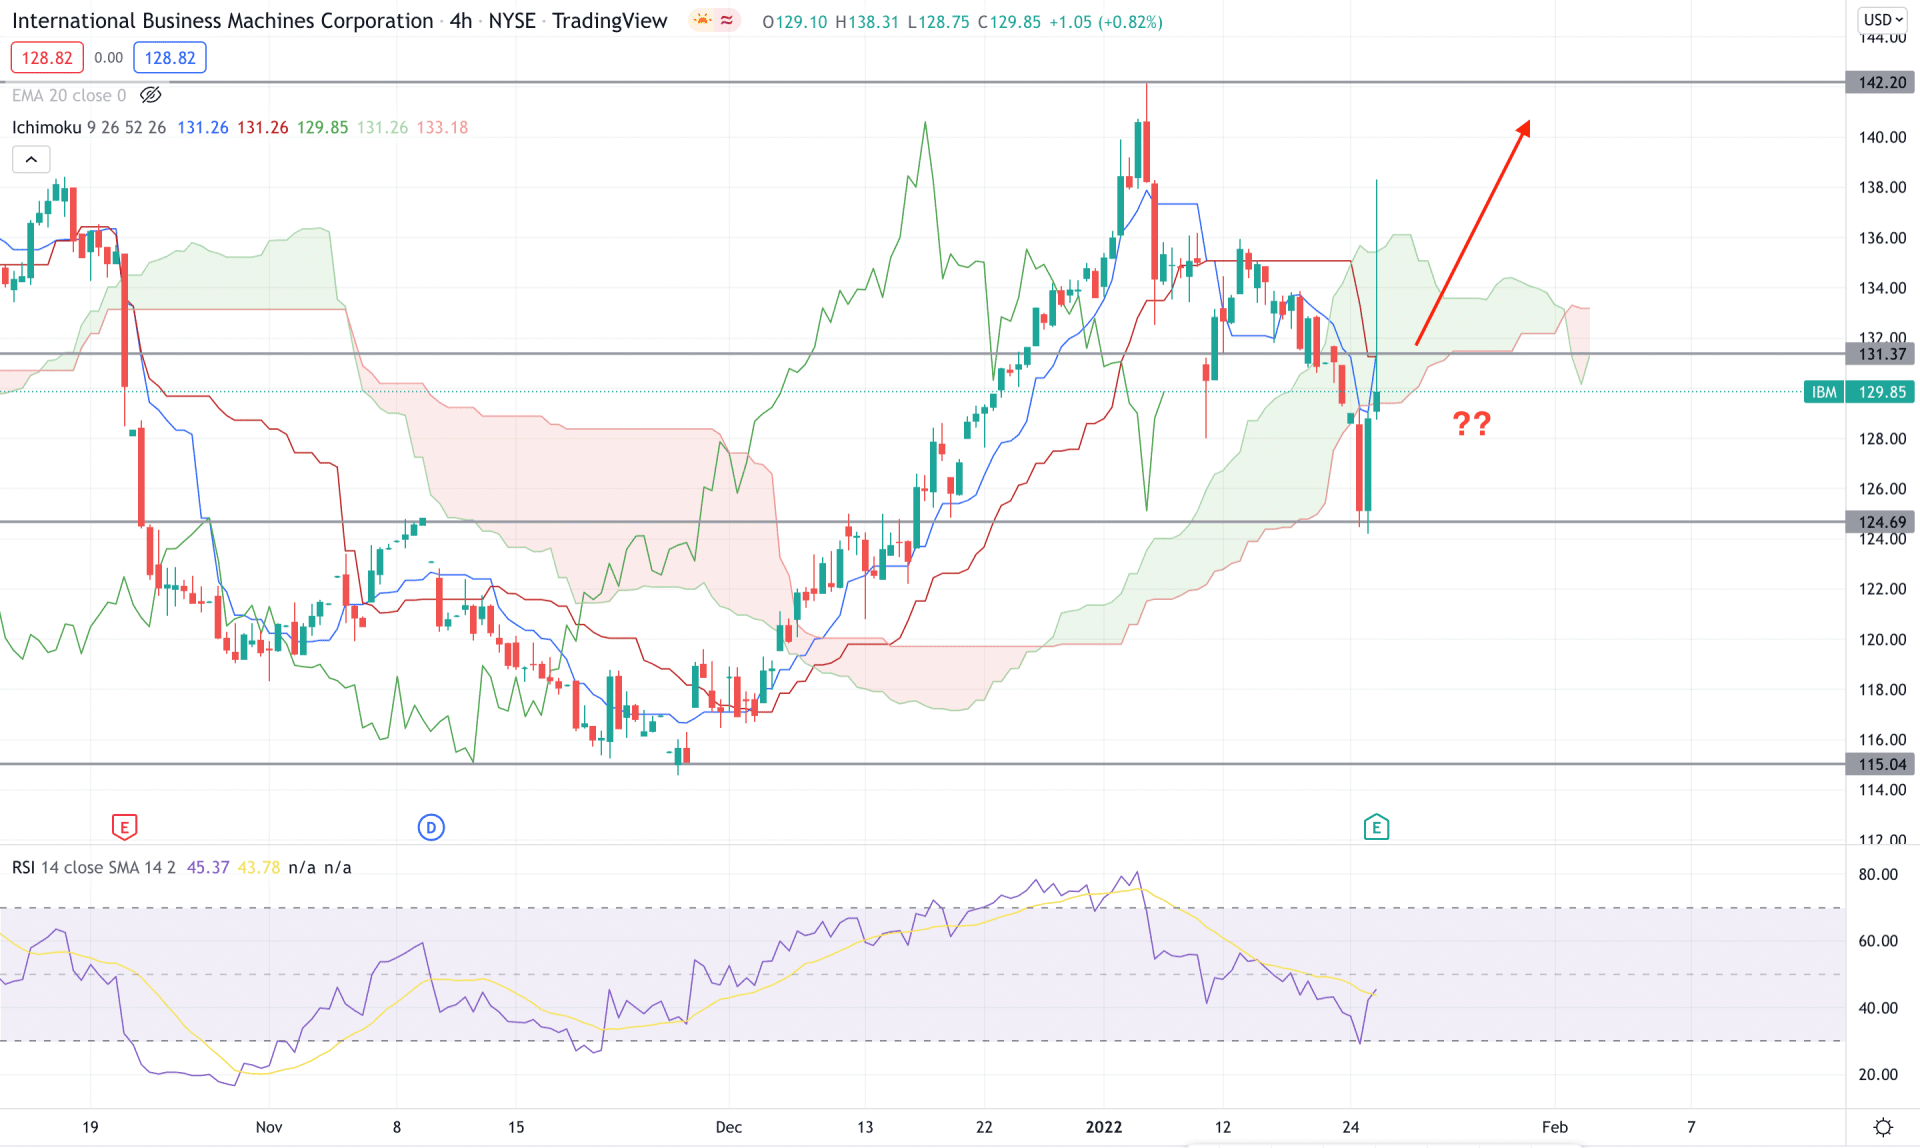
According to the Ichimoku Kinko Hyo, the recent exhaustion from the 124.69 level raised a question regarding the effectiveness of the current bearish momentum. The future cloud is still bearish but the Senkou Span B is aiming higher, which is the potential sign of possible bullish pressure. However, investors should find the price above the 131.37 static support level to consider the upcoming price direction as bullish.
The above image shows how the price trades below Tenkan Sen and Kijun Sen where the RSI line changed its direction from the 30 level. Therefore, if the price moves above the dynamic Kijun Sen line, it may show a bullish momentum for the coming hours.
Based on the H4 context, any bearish rejection from the 131.37 level would open a bearish opportunity towards the 124.00 area. On the other hand, bulls should wait for the price to break the 124.00 level with a solid bullish candle where the primary target would be 1402.20 level.

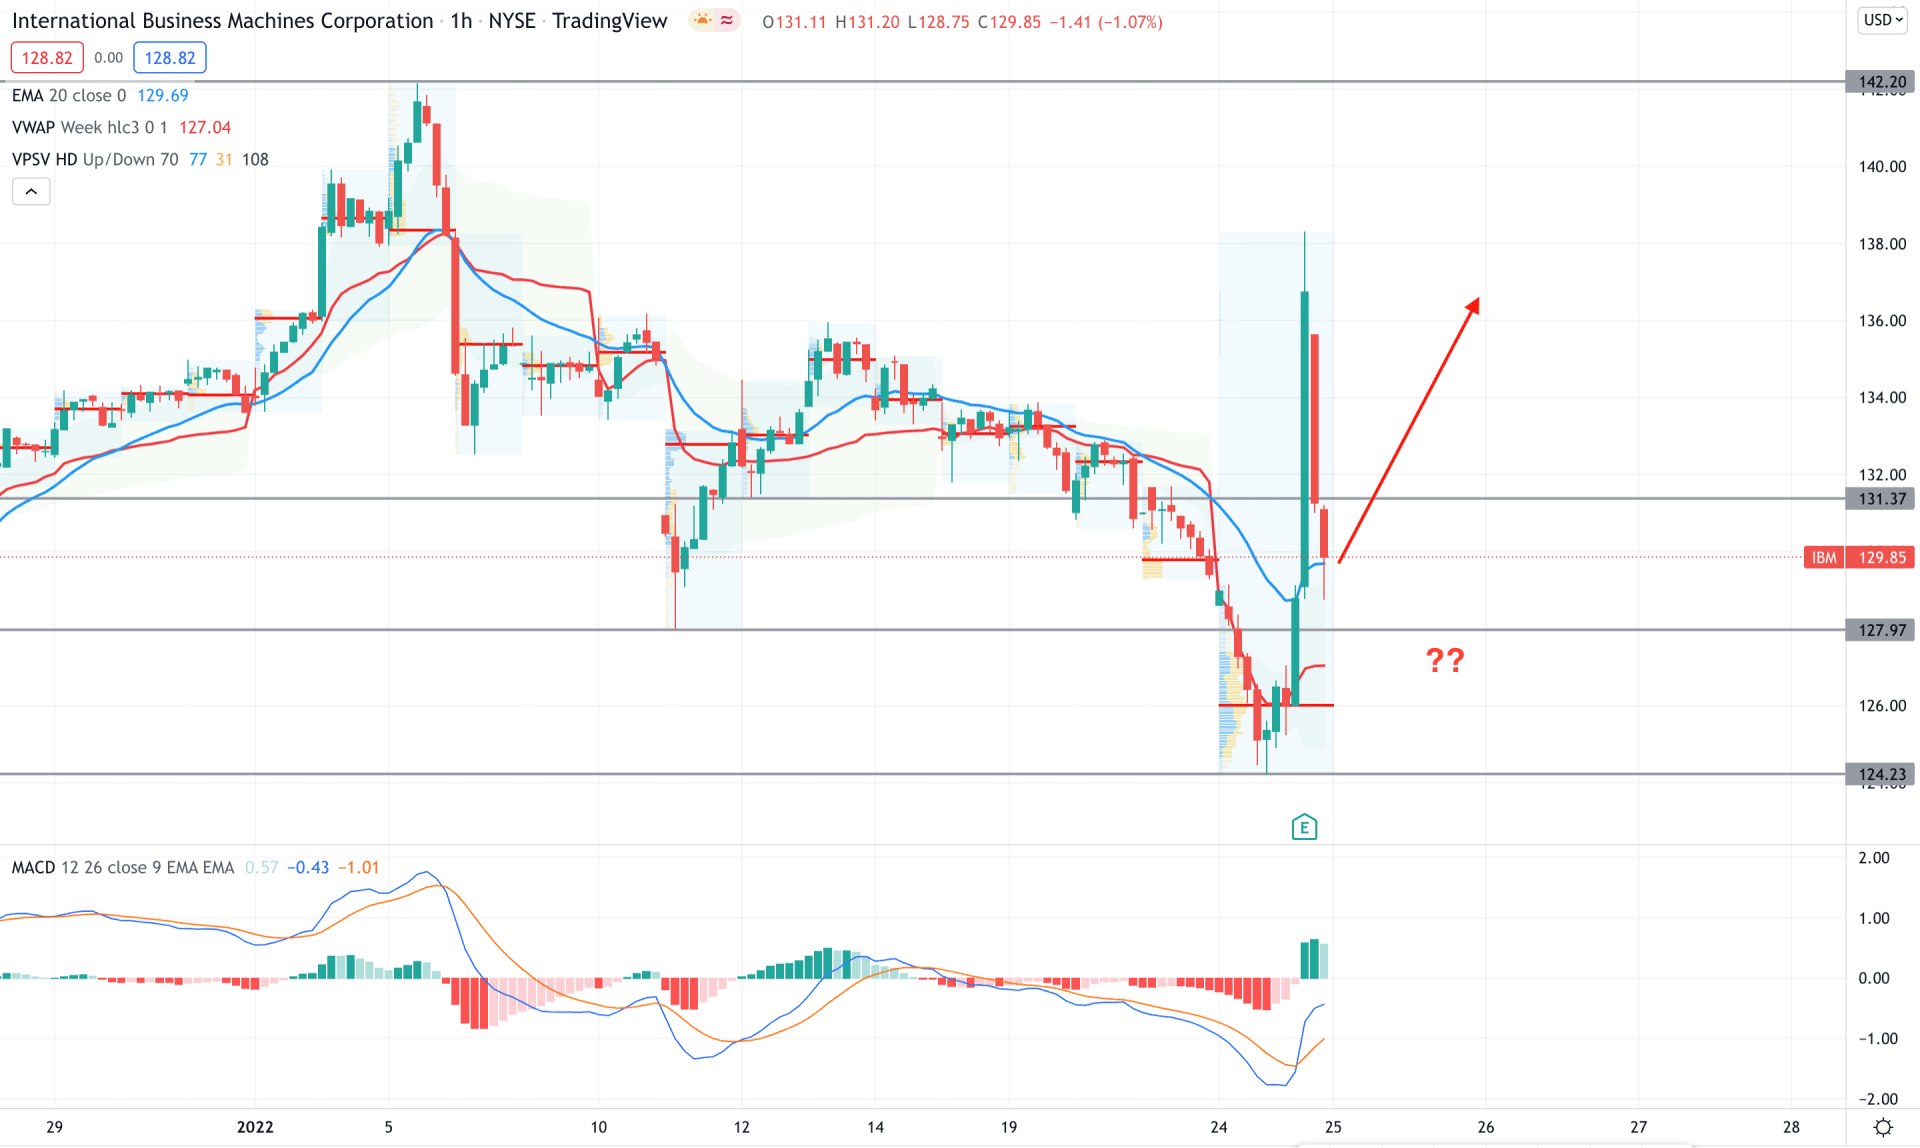
IBM stock showed a strong buyer’s interest in the hourly chart where the price formed a massive bullish candle that broke the previous corrective selling structure. Moreover, the buying pressure from the Q4 earnings report took the price above dynamic levels with a further bullish potentiality for investors.
The above image shows how the MACD Histogram changed its direction from bearish to bullish, where the MACD lines showed a bullish crossover. On the other hand, the price moved above dynamic 20 EMA and weekly VWAP with a substantial volume.
Therefore, based on the H1 chart, investors should wait for a bullish candle above the 131.37 level before opening a buying trade in this instrument. On the other hand, the bullish possibility is valid until the price moves below the 127.97 level.
As per the current market context, IBM stock is more likely to show bullish pressure in the coming days. In that case, any bullish H4 candle above the 131.37 level has a higher possibility of showing further bullish pressure in the coming days.