
Published: December 9th, 2021
Houbi Token is a native cryptocurrency token from the Houbi Global exchange. This decentralized digital asset is based on the Ethereum blockchain on the ERC-20 compliant. Although HT’s value relies on the Houbi Exchange’s reputation, there are some other factors that also affect its impact.
Houbi Token is a relatively young project that launched in January 2018 as a major competitor of rivals in the crypto exchange Binance. Its own token builds a flexible marketing platform to attract new users with an opportunity for further growth in the platform. Moreover, investors can use this token to reduce trading commissions for all trading activities. Further discounts on transaction fees are available on upgrading the VIP status using the HT token.
The current circulation of this coin is 159,308,566 HT, which is 32% of the max supply of 500,000,000. This coin is ranked at #76 in the CoinMarketCap, ranking with a market capitalization of $1,593,600,805. It grabbed investors’ attention from a 63.76% surge in trading volume in the last 24 hours.
Let’s see the upcoming price direction from the HT/USDT technical analysis:
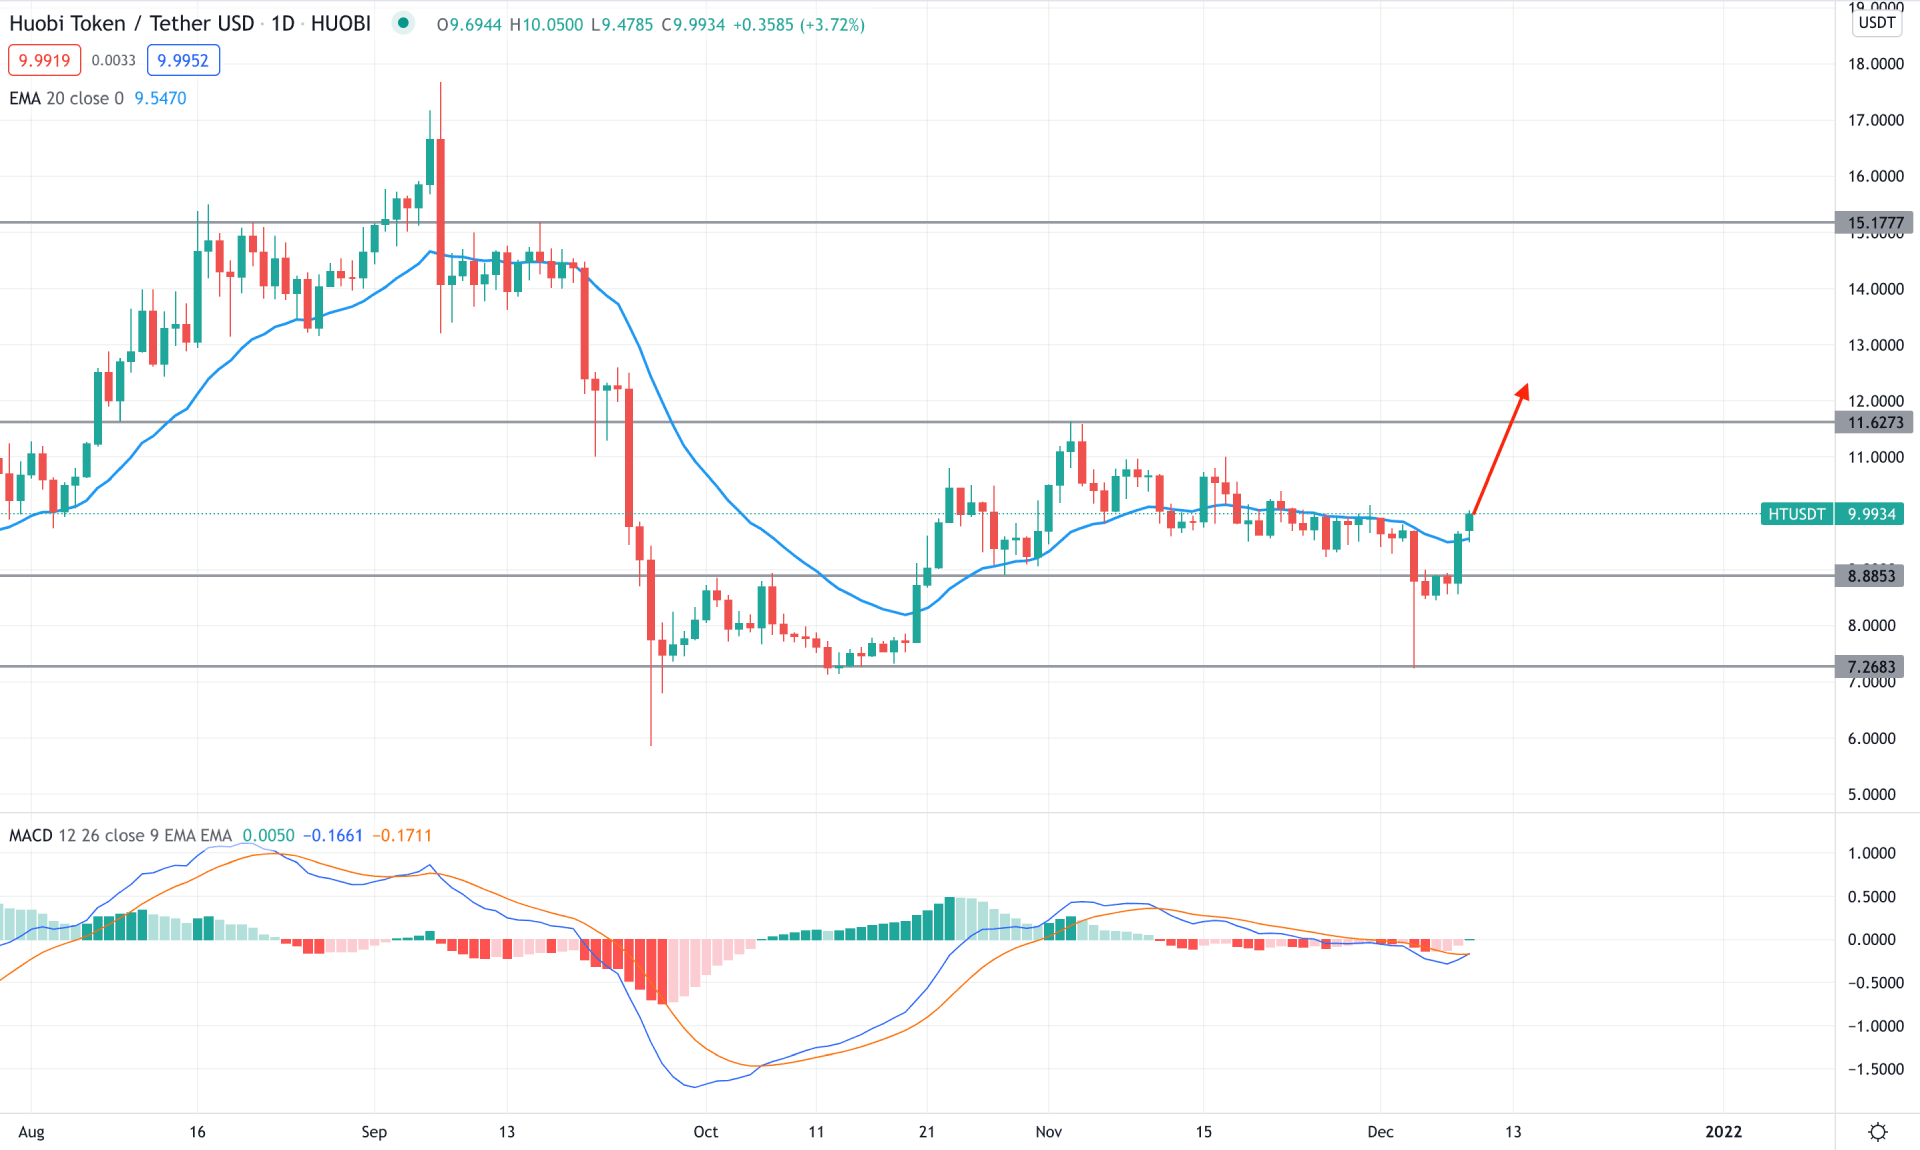
Houbi Token reached an all-time high at 39.8988 at the post-pandemic economic recovery and crashed immediately at the 11.62 support level. Since then, the price remained corrective, where the 7.2683 level worked as a significant support level. As the current price has a strong bullish rejection from the 7.2683 support level, it is more likely to extend the current bullish pressure towards the 11.6273 level in the coming days.
The above image shows how the price rejected the 7.2683 support level with a strong exhaustion candle and closed the daily candle above the dynamic 20 EMA. Meanwhile, the MACD Histogram turned bullish, but there is no sign of divergence.
Based on the daily context, HT/USDT is more likely to extend the bullish pressure in the coming days. Therefore, any intraday buying opportunity from 10.0000 to 8.8853 level has a higher possibility of taking the price up. A break below the 8.8853 level needs a close observation to the 7.2683 level as a discounted buying point. A break below the 7.2683 level with a bearish daily candle may alter the current market structure and lower the price towards the 5.0000 area.
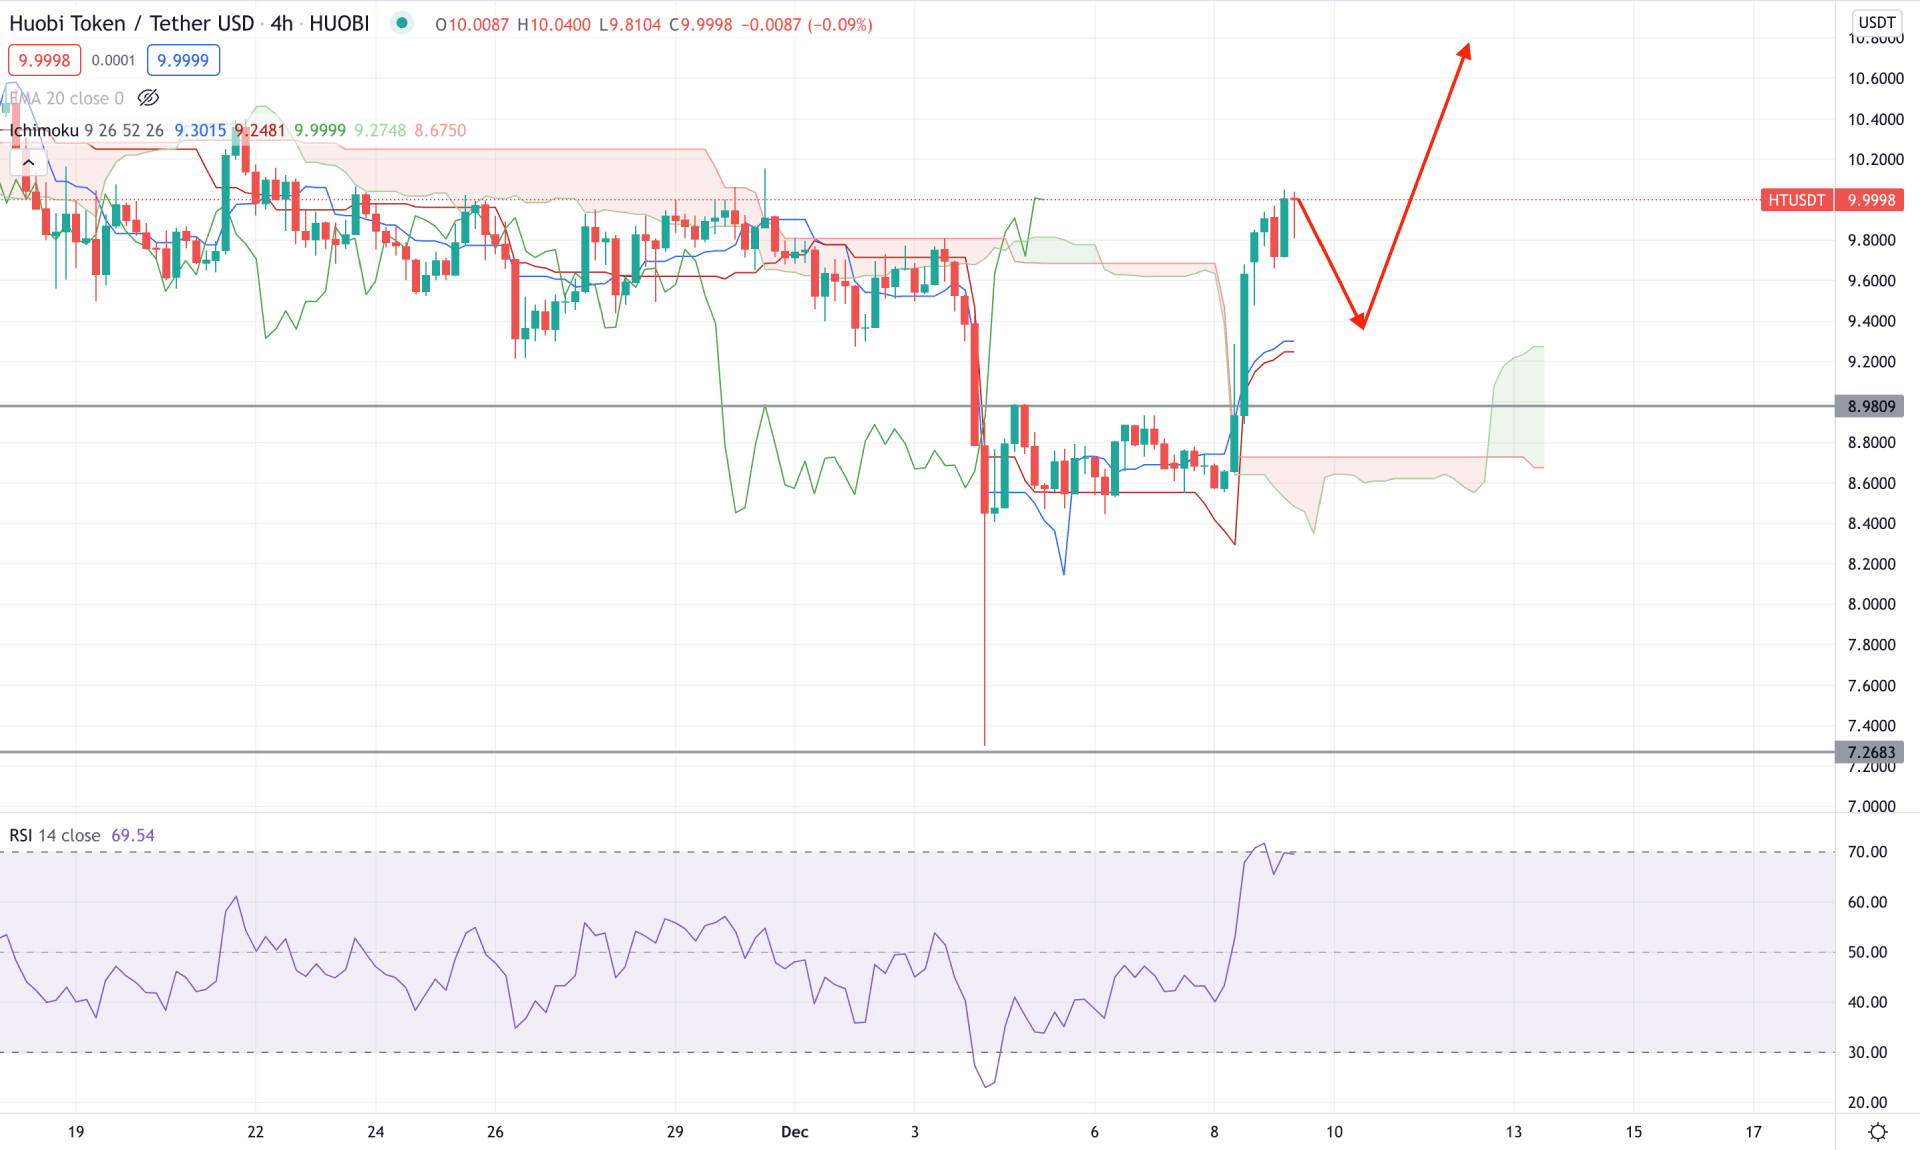
According to the Ichimoku Kinko Hyo, HT/USDT showed a major trend reversal from the 7.2683 level by moving above the Kumo Cloud with a solid bullish H4 close. Therefore, the future cloud turned bullish where the Senkou Span A moved above the Senkou Span B and aimed higher. Consequently, it is a sign that the bullish pressure above the dynamic Tenkan Sen and Kijun Sen came from strong buyers at 8.9809 to 8.5000 area.
In the indicator window, RSI is bullish and reached the overbought 70 level, a strong sign of bullish pressure in the price. Moreover, Tenkan Sen and Kijun Sen are below the current price and aiming higher, while the Lagging Span is above the price.
Therefore, based on the H4 context, we can say that the HT/USDT is more likely to move up above the 12.0000 area. In that case, a bullish rejection from 9.6000 to 9.0000 would be a strong buying point.
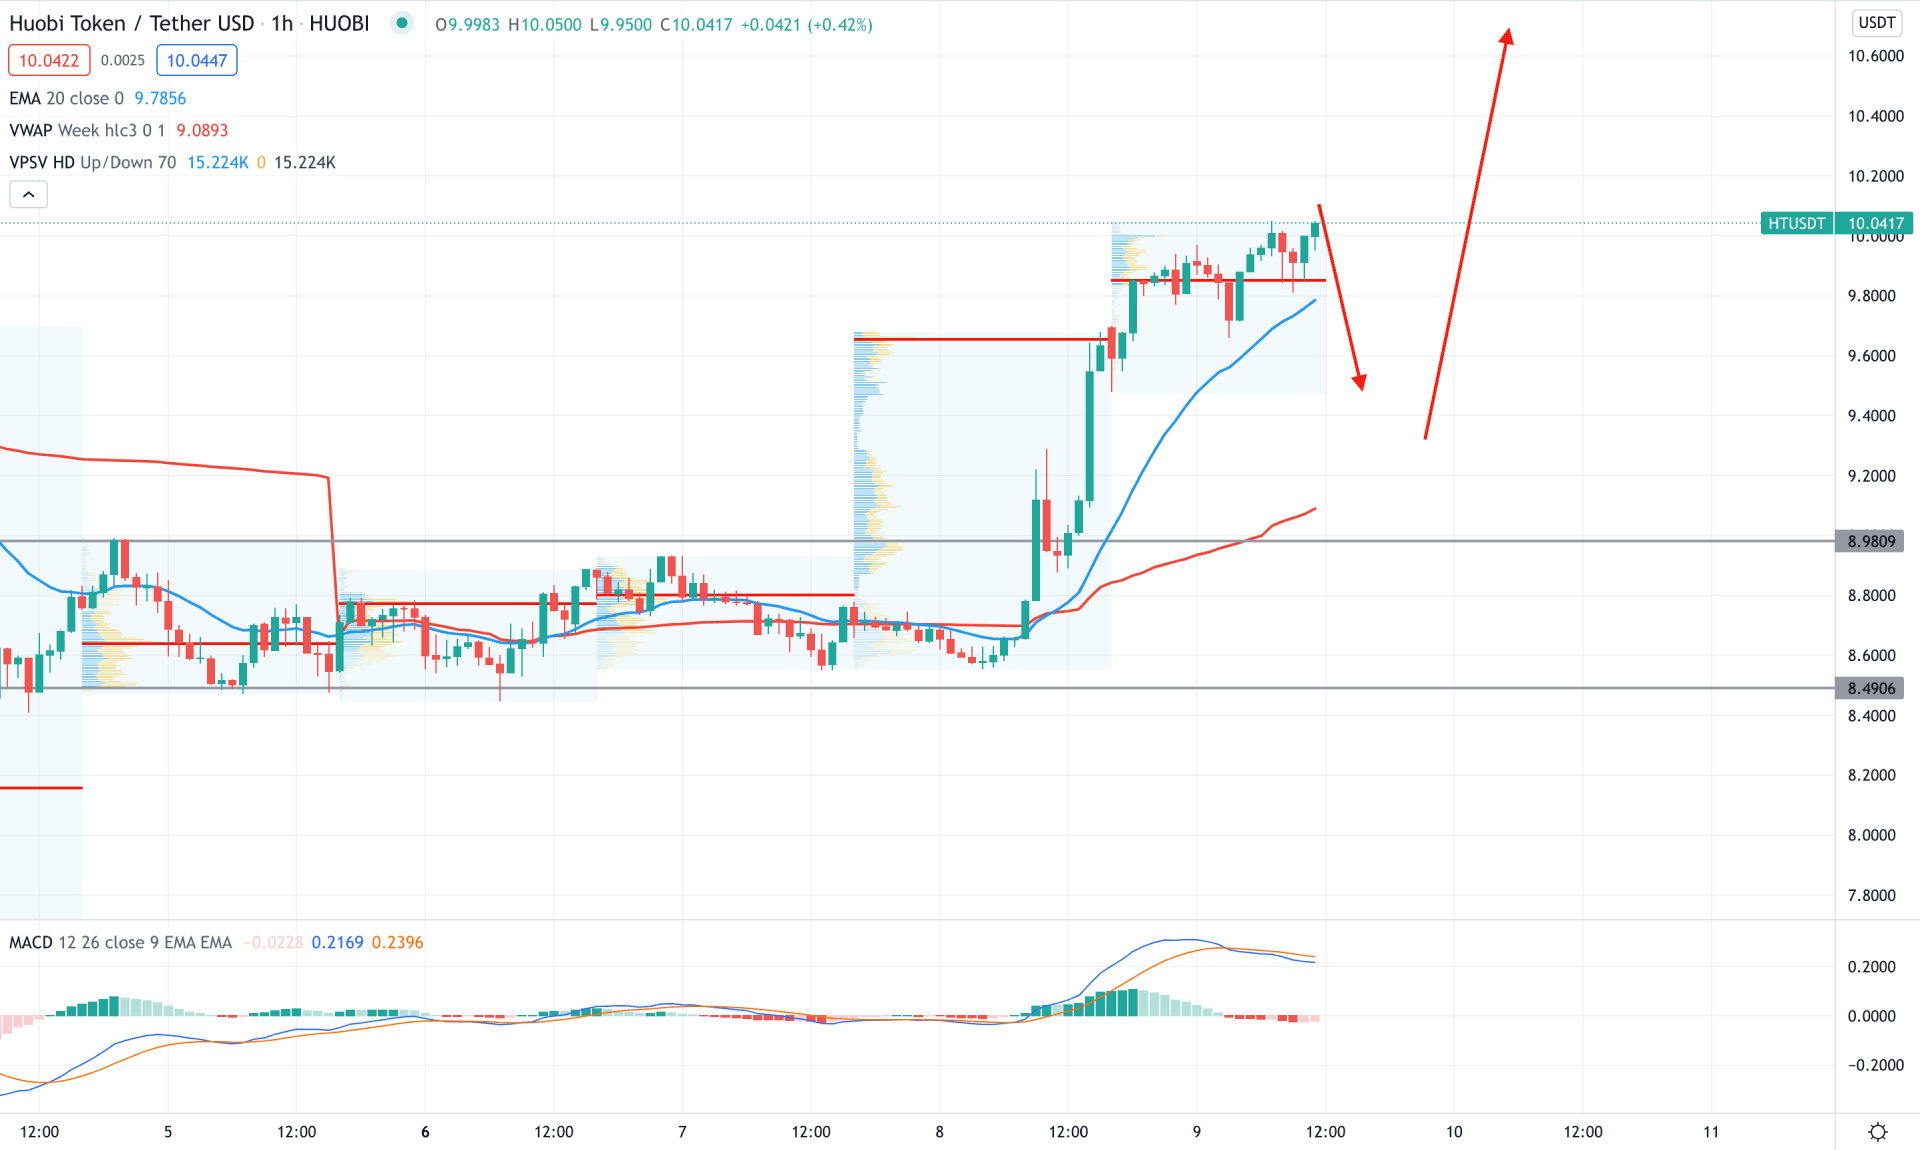
In the intraday chart, HT/USDT is trading within a strong uptrend where the current price trades above the most recent high volume level of 9.8543. Moreover, the bullish breakout from the dynamic 20 EMA was strong that may extend more after a considerable correction.
The above image shows that the current price trades above the dynamic 20 EMA and weekly VWAP, with a high gap between these dynamic levels. As a result, small mitigation is pending where any bullish rejection from 10.0000 level to 9.2000 level would be a potential buying point. On the other hand, investors should closely monitor how the price trades above the 8.4906 level as a break below this level would eliminate the current market structure and lower the price towards the 7.0000 area.
As of the current observation, HT/USDT is more likely to move up as a substantial trading volume backs the recent bullish pressure. Therefore, the primary target of the bull run would be towards the 13.0000 to 15.0000 area from where a bearish correction may appear. However, a break below the 7.2683 level would alter the current market structure and lower the price to 5.000 area.