
Published: July 21st, 2021
Google stock bulls resumed the momentum as soon as the Covid-19 vaccination program expanded. People started coming into regular life while businesses continued. The increase in business activity influenced Google’s cloud computing revenue to move higher by 46% in Q1 2021. Now Google’s most extensive cloud computing use is Apple.
Google’s stock repurchase program also remained strong that boosted the revenue expectation for the March quarter. Alphabet announced a $50 billion GOOGL stock repurchase program from where Google bought back $7.9 billion of its shares in Q4 2021. Still, there is a $15.4 billion buyback program remaining.
In the March Quarter, the GAAP earnings increased by 166% to 26.29 a share. In addition, the net revenue came at $45.6 billion, beating the expectation of $42.36 billion. Now the Q2 earnings will be released next week, and until then, Google Stock’s bullish sentiment may continue.
Let’s see the upcoming price direction from the Google Stock [GOOG] technical analysis:
Google stock started the bullish momentum from the Covid-19 market crash and recovered more than it lost during the pandemic. Most of the countries in the world initiated lockdown and shutdown while people remained at home most of the time. As a result, the use of PC and cloud services increased. Therefore, Google stock moved higher, breaking above the multi-year high with strong bullish pressure.
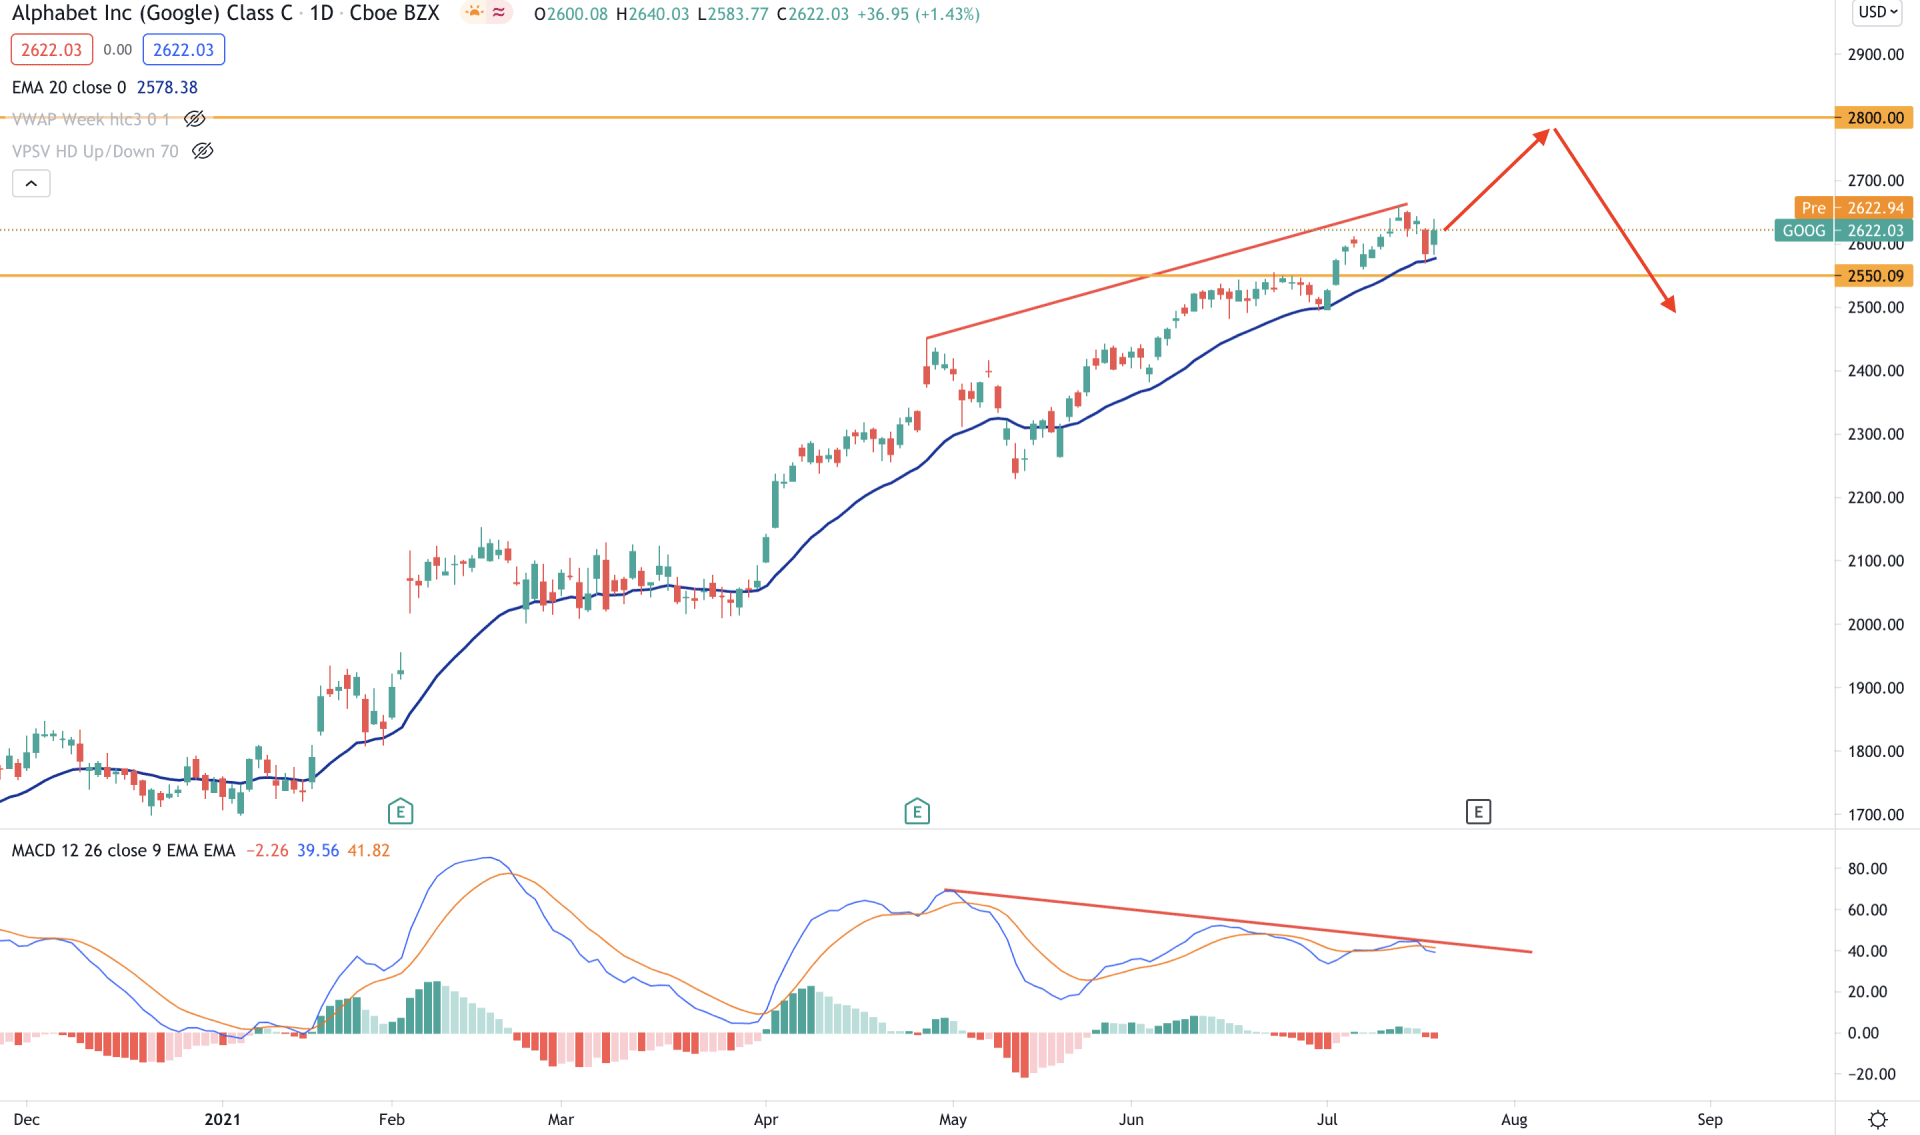
In the daily chart, the price is in a critical zone where the bullish momentum is questioned by the regular divergence in MACD. However, the price is moving within a bullish trend where the dynamic 20 EMA is working as minor support above the 2550.09 static level.
Although the price formed a regular divergence with MACD, bulls may make another swing at the 2800.00 level followed by the current dynamic and static support levels. However, the bullish possibility is valid as long as the price is trading above the 2550.09 level. Any break below this level with a bearish daily close may alter the current market structure.
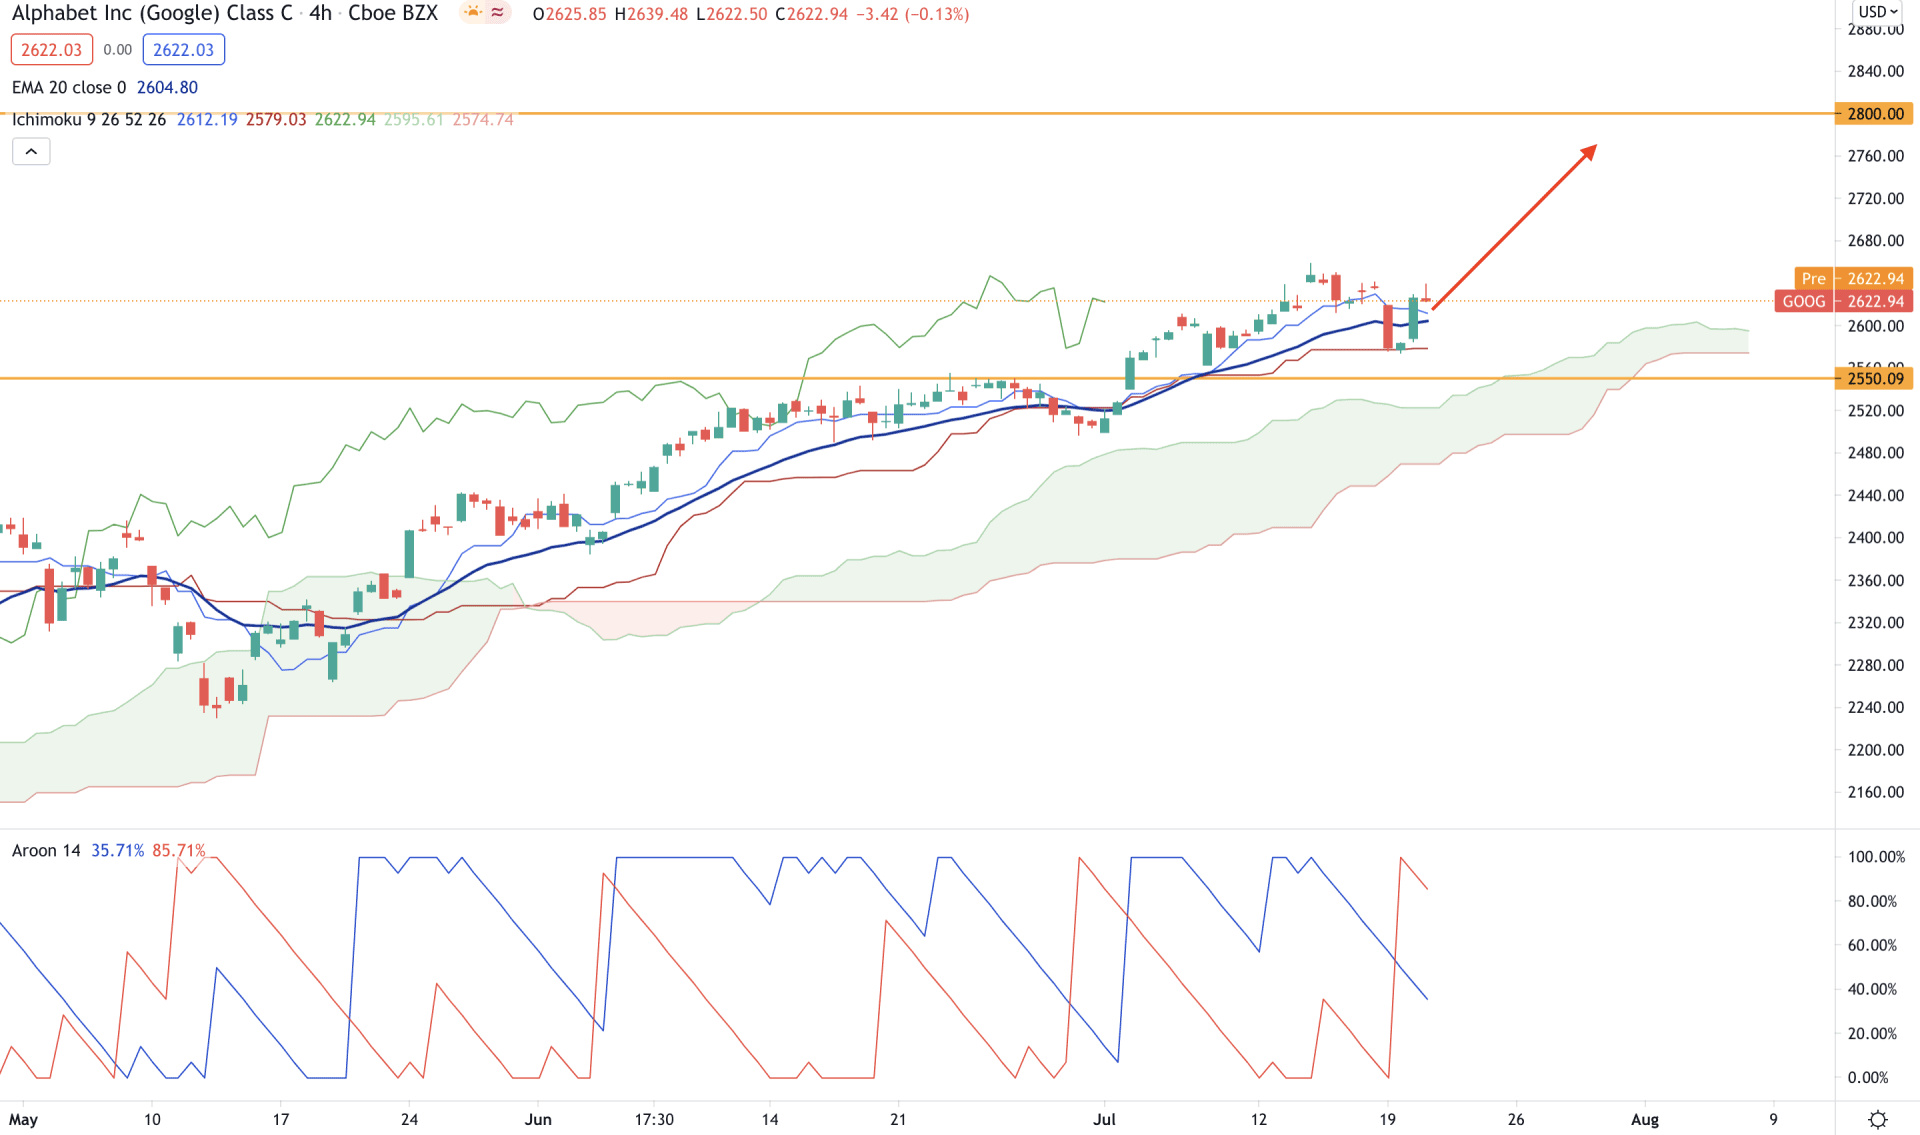
Based on the Ichimoku Kinko Hyo, Google stock has been trading above the Kumo Cloud for a considerable time. Moreover, Senkou Span A remained above the Senkou Span B and headed upwards while the Chikou Span remained above the price. Therefore, the price is moving up with a strong bullish momentum that may extend in the coming days.
In the above image, we can see that the price corrected lower and rejected the dynamic Kijun Sen with a bullish H4 close, which is a sign of buyers’ presence in the price. However, in the indicator window, Aroon Up (blue line) remained below the Aroon Down (red line). Therefore, traders should find the Aroon Up level above the 60% area to consider the current trend as bullish.
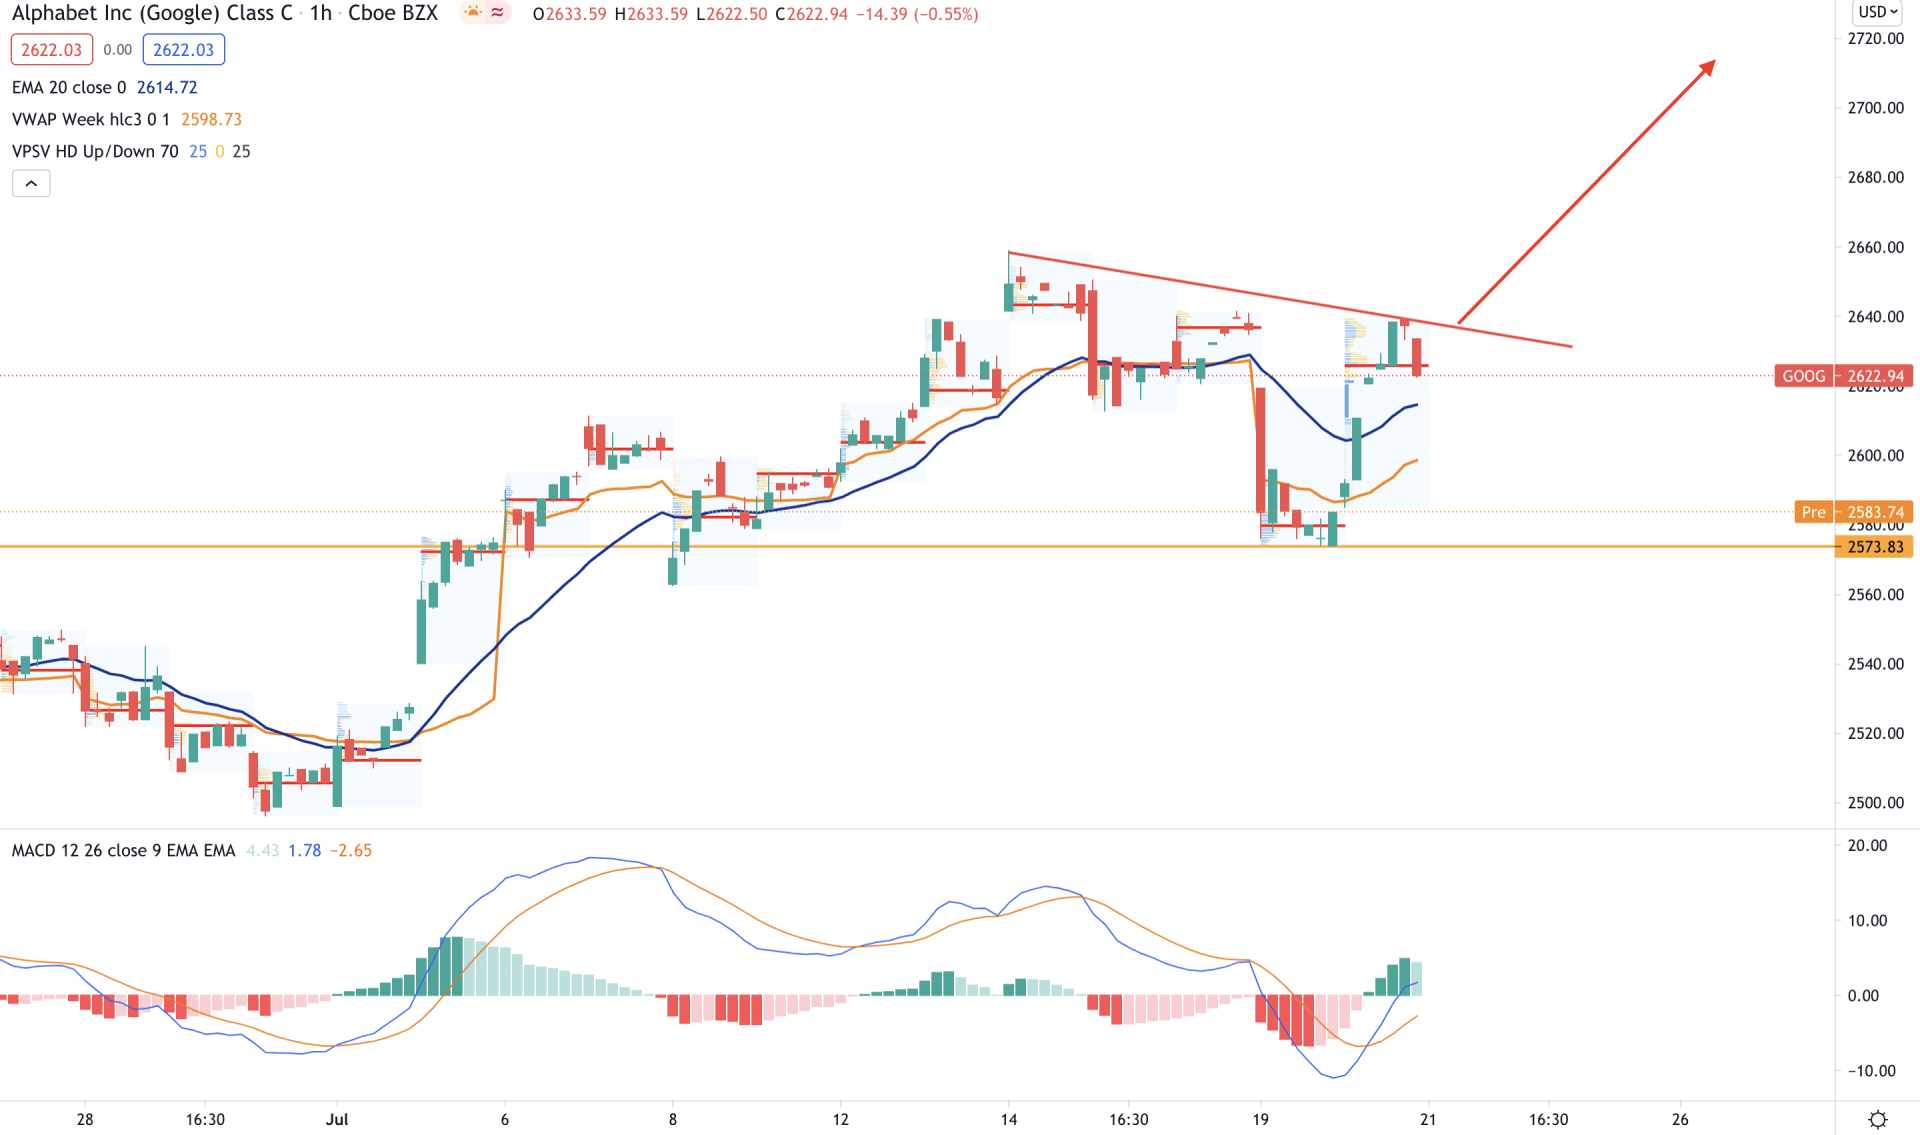
In the intraday chart, Google stock is moving up by creating higher highs where intraday high volume levels were supportive to bulls. However, the price crashed below the dynamic 20 EMA and made a bottom at the 2573.83 level. Therefore, as long as the price is trading above the 2573.83 level, it has a higher possibility of continuing the bullish pressure.
The above image shows that the price moved lower below the dynamic 20 EMA but failed to hold the bearish momentum. Therefore, the price moved up and is currently getting minor support from both dynamic 20 EMA and vwap.
Any bullish break above the intraday trendline from 14 to 21 June high, may take the price higher towards the 2750.00 level in the coming session. On the other hand, a stable break below the 2573.83 level with an H4 close may take the price down towards the 2500.00 level.
As per the current observation, Google Stock has a higher possibility of moving up towards the 2800.00 level in the coming days. However, the bullish sentiment is valid as long as the price is trading above the 2550.09 intraday support level.
Any bearish pressure in H4 below the Cloud support may alter the current market structure and initiate a broader correction to the current bullish trend.