
Published: May 29th, 2020
Currently Gold remains one of the most interesting assets in the current market conditions as it provides a good indication of the US Dollar strength or weakness. Probably there are many investors who consider gold a safe-haven, although it still remains a highly manipulative asset. Considering the current world economic crisis, many believe, that Gold is a perfect store of value, it might be true for the long term, although medium-term price action shows a little different price perspective.
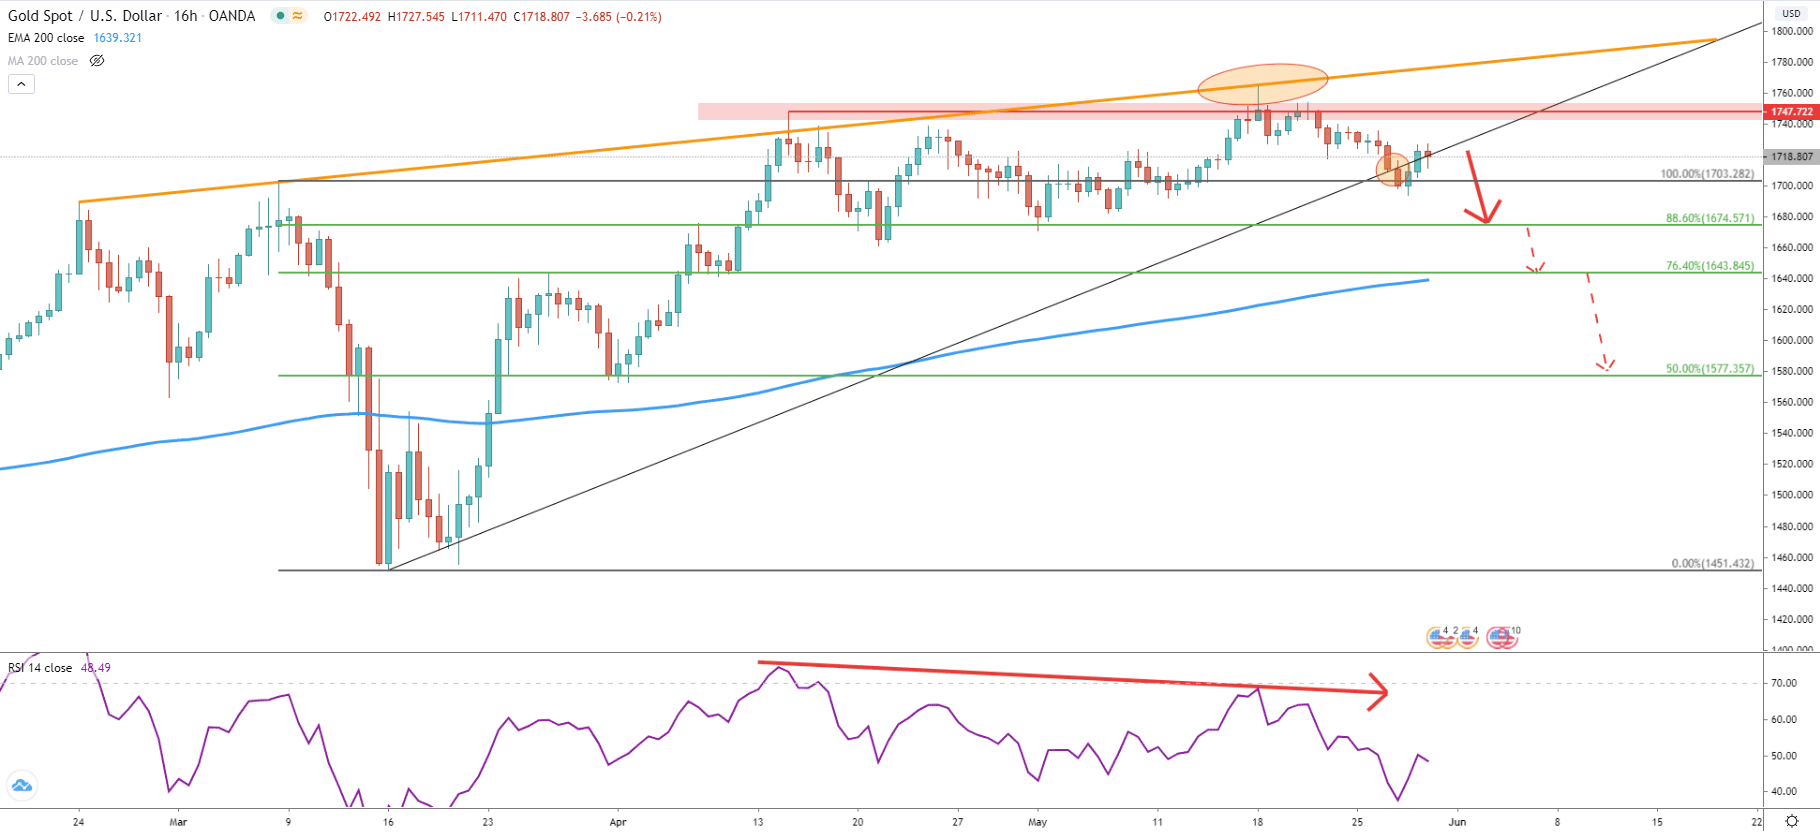
On the 16-hour chart, we can see the formation of the double top at 1748 price level. Along with it, the price has rejected the resistance uptrend trendline, formed a bearish divergence on the RSI oscillator, and started to move down. We can see the breakout below the uptrend trendline, which is the first indication taht price is about to reverse to the downside, or at the very least, initiate a corrective move down. Based on the Fibonacci retracement levels, applied to the last strong correction down, we can see several levels of support, which are likely to be tested before/if Gold long term uptrend will resume. These are 88.6% at 1674, 76.4% at 1663 corresponding with a 200 Exponential Moving Average, and finally 50% at 1577 corresponding to the previous level of support.
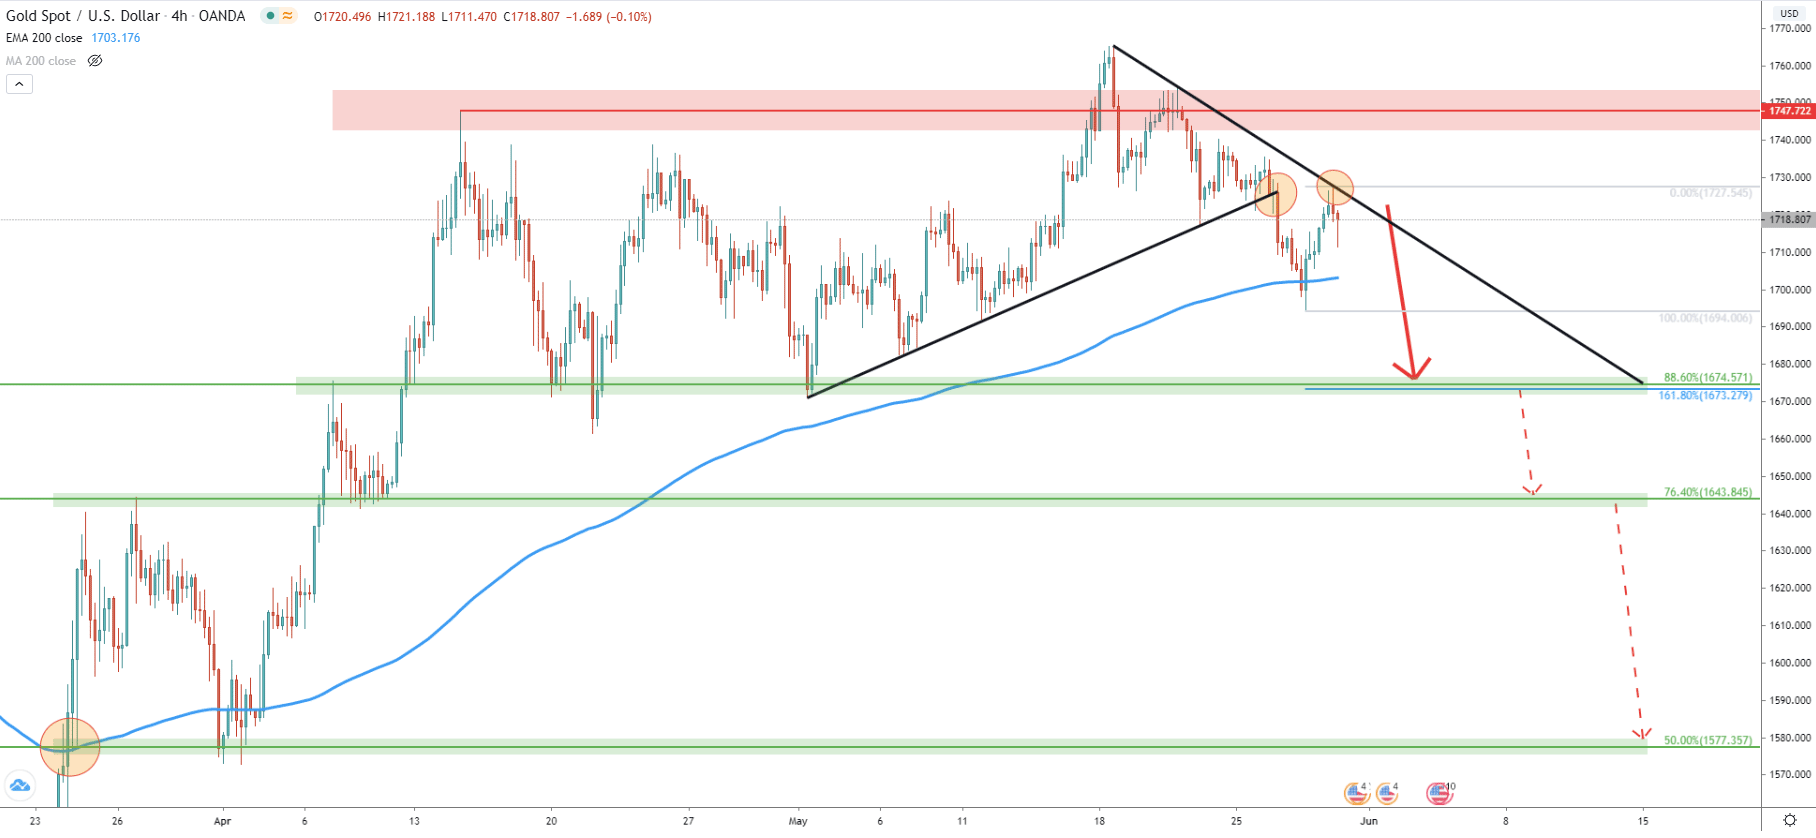
On the 4-hour chart, price broke below the uptrend trendline followed by the breakout of the 200 EMA and reaching the 1711 low. This is yet another strong bearish signal, showing that bulls were unable to hold these support indicators. The correction up followed and price retraced back up to the downtrend trendline, which has been rejecting cleanly. This makes the 1727 price a key resistance to watch in the short and medium-term because as long as it holds, sellers will remain in control. Also, on this chart, the nearest support at 1674 corresponds to the 161.8% Fibs applied to the most recent upside correction, making it a key support level.
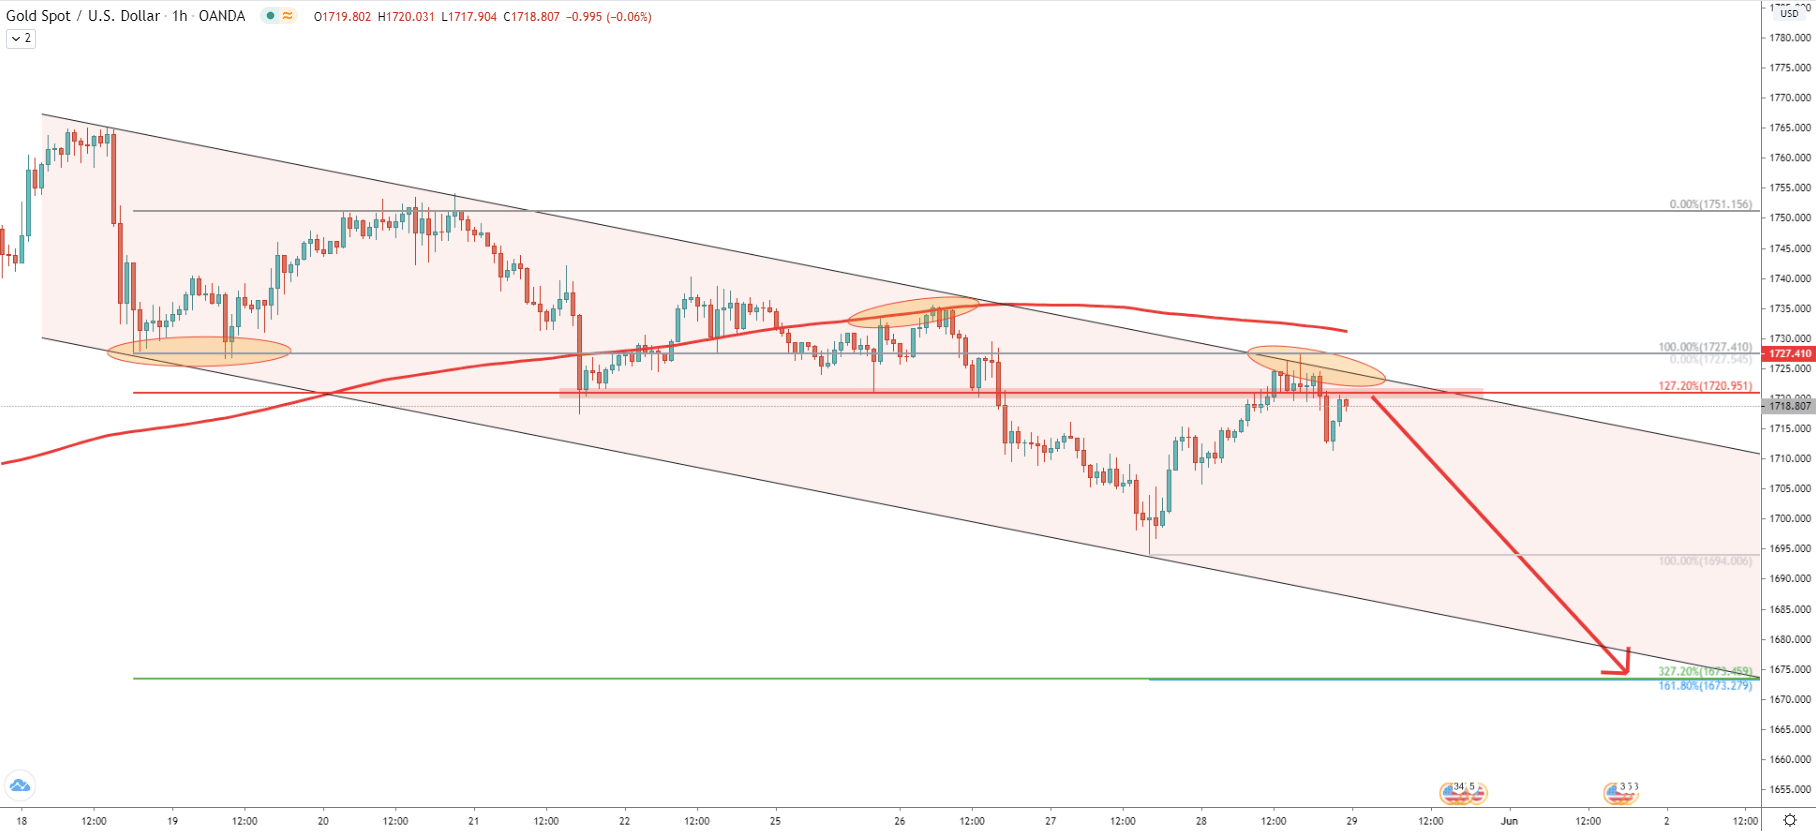
On the 1-hour timeframe, Gold price continue to decline, while trading within the descending channel. Lower lows and lower highs pattern confirming the downtrend. Moreover, today XAU/USD price reached and rejected the top of the channel, which could have been the perfect selling point for those who believe the Gold price will initiate a corrective move to the downside. On this chart, we can also see that1674 support level corresponds to the 327.2% Fibonacci retracement, this time applied to the very first corrective wave up, after hitting a 7-year high at 1765.
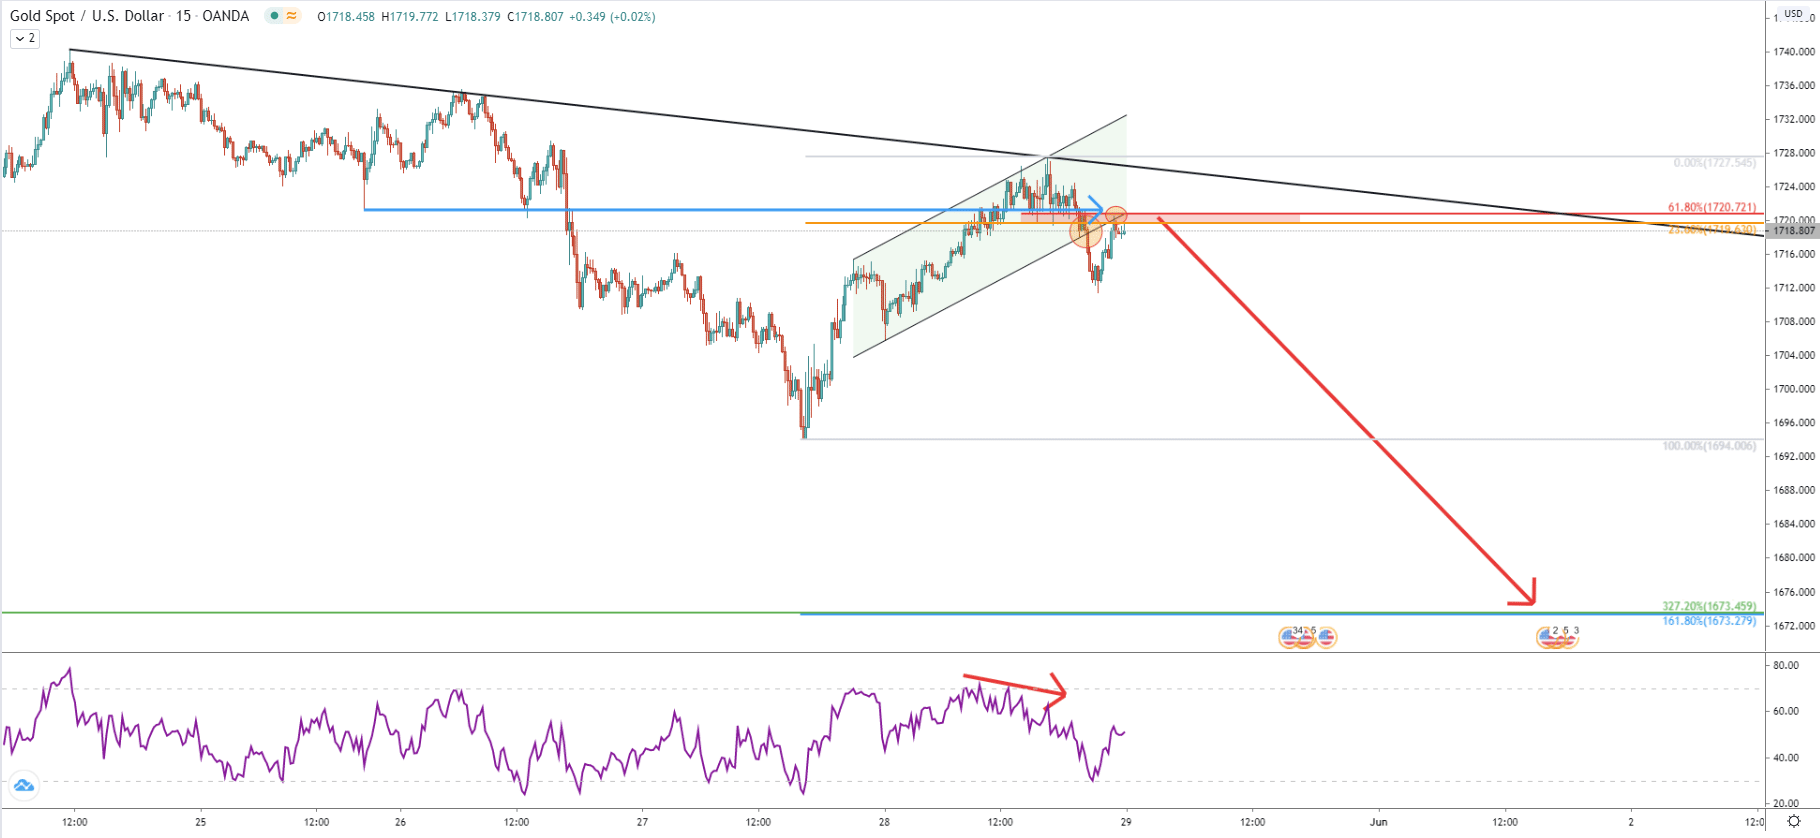
The 15-minute chart show the rejection of the downtrend trendline where price has reached the top of the ascending channel. After that, the price went down and broke below the channel. Current correction shows, that price is respecting the 1720 resistance area confirmed by two Fibonacci retracement levels. At the same time, RSI formed a bearish divergence, suggesting an upcoming wave to the downside.
Gold has formed a bearish divergence on the high and lower timeframes. Currently, the price has reached previous level of support, which is now acting as the resistance. The downtrend trendline and the top of the descending channel are being rejected right on 1727, making this price a decision-making point. As long as the price remains below, Gold will be very bearish at least in the short term.
While there are 3 downside targets altogether, there is one, which should be watched very closely. This is the 1674 area, which is confirmed by 3 Fibonacci retracement levels as well as 200 EMA on the daily chart.
Traders should keep in mind that the long term trend still remains bullish and uptrend might resume at any time. The key resistance is seen at 1727, and if there will be a 4-hour break and close above this price, only then XAU/USD should be expected to continue trending up.
Support: 1694, 1674, 1643, 1577
Resistance: 1720, 1747