
Published: June 21st, 2022
In the US, the Advanced Retail Sales for May moved down from 0.2% to -0.3%, as expected. However, the rising inflation has remained the main concern for the Fed. In the latest FOMC, the Fed delivered a 75 bps rate hike, the highest single rate increase since 1994. The new Federal Funds rate is now 1.75%, where further hikes may come in the coming quarter.
In the Press conference, Powell said that the main aim of the central bank is to bring inflation down. The growth in business investment and housing are slowing, but the labor market is still under control. In this situation, further rate hikes need signs from incoming data, but another 50 or 75 bps will likely happen in the July meeting.
On the other hand, the UK economy is also under pressure from rising inflation, where the current CPI has been hovering around the 9% area for the last few months. Now, investors should monitor how this week's inflation report is coming where the current projection is higher than the previous report. In that case, if the actual report comes above the previous report, GBPUSD might see massive selling pressure.
Let’s see the future price direction from the GBPUSD Technical analysis.
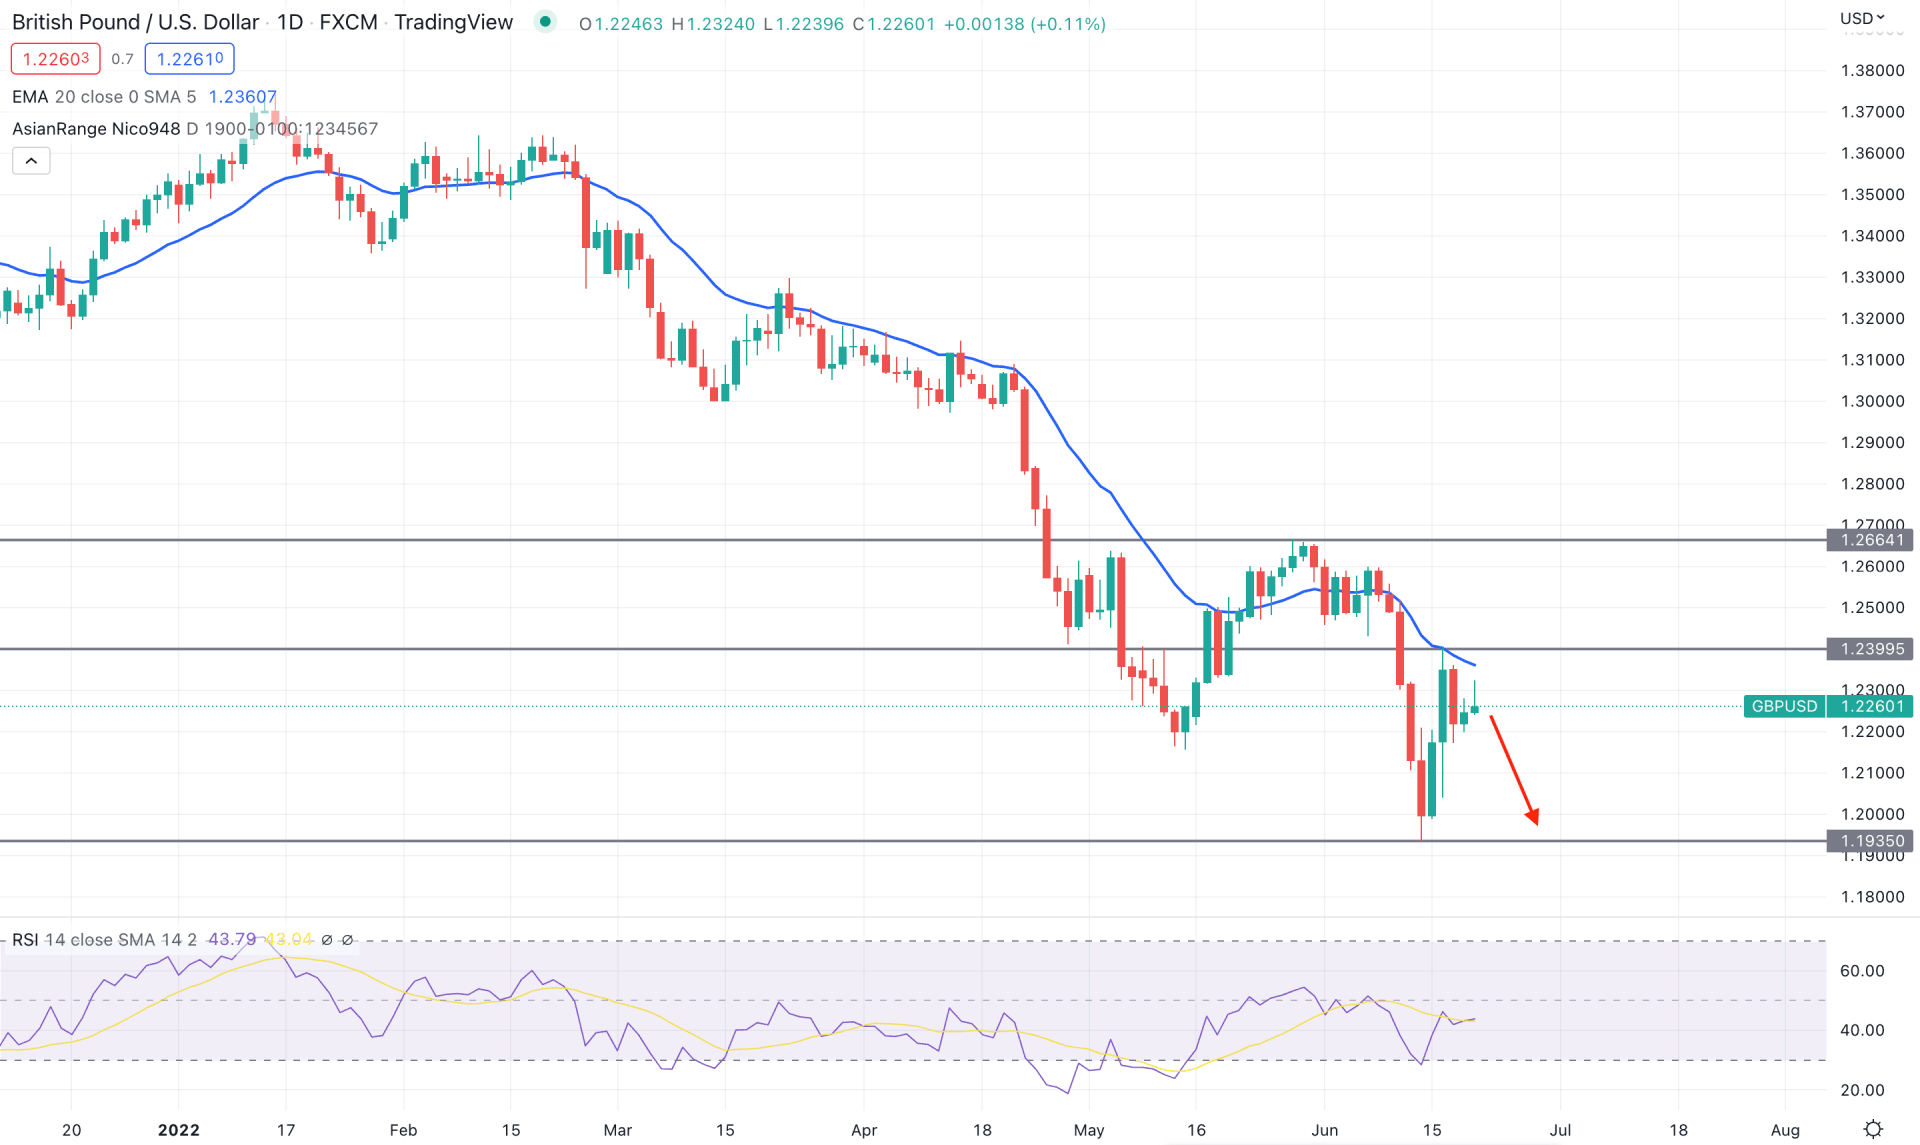
In the daily chart, the GBPUSD price remained bearish since the beginning of 2022. Moreover, the selling pressure was steady below the dynamic 20 EMA resistance, where the most recent price after April 2022 showed a sign of volatility. Although the price made a new swing high at 1.2664 level, the candlestick pattern at the resistance area was not satisfactory. As a result, the price rebounded below the 20 DMA immediately and formed a new lower low at the 1.1335 level.
The above image shows how the price formed a divergence with the RSI where the RSI line failed to form a new low following the price. Moreover, the RSI rebounded higher after testing the oversold 30 level but still remained below the neutral 50 area.
Based on the daily price action, bears are more likely to extend the momentum in the coming days as the current price trades below the 1.2399 resistance level. Therefore, negative sentiment for the GBP on this week’s CPI release would boost the selling pressure towards the 1.1935 level. On the other hand, bulls should recover the price above the 1.2500 level before showing further buying pressures.
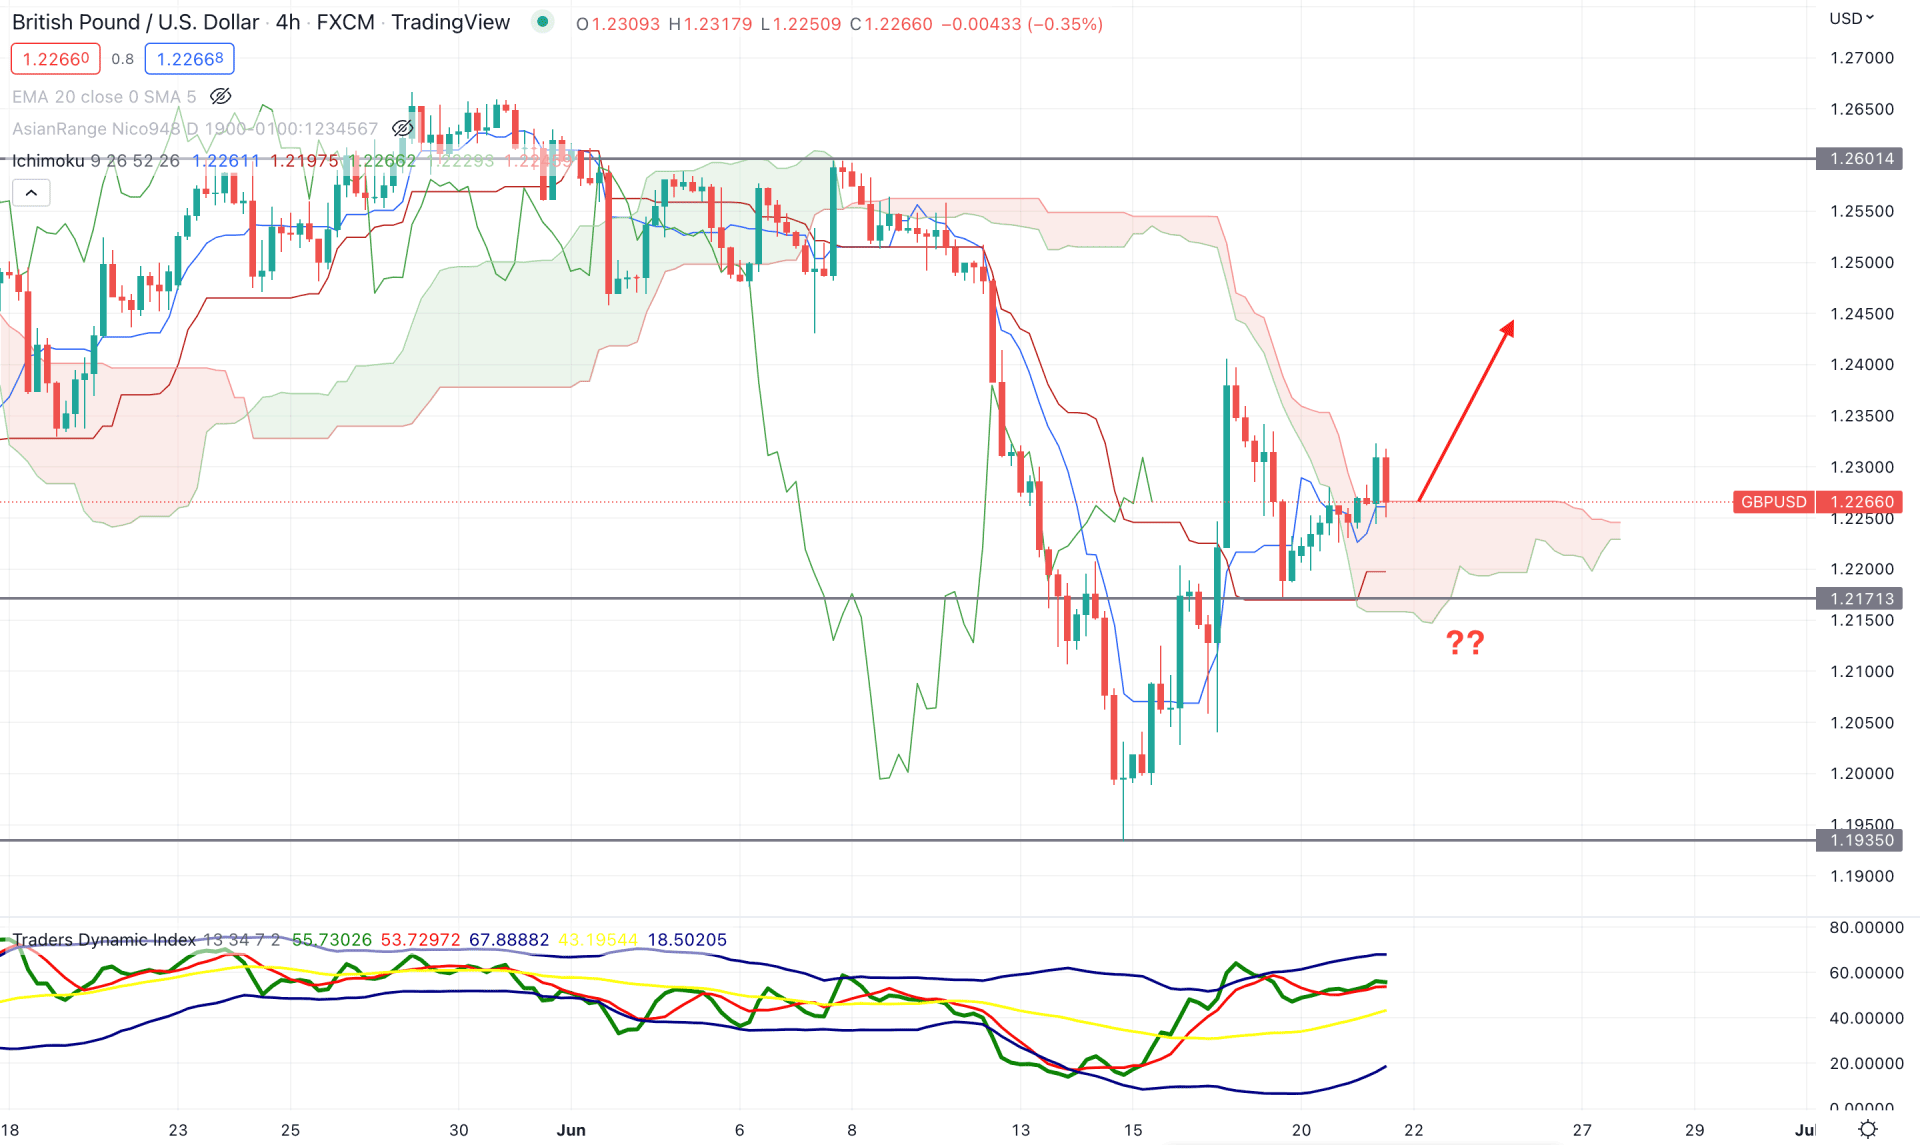
The H4 price shows that the GBPUSD bullish recovery is still pending as an H4 candle appeared above the Cloud support. However, Senkou Span A and Senkou Span B remained flat in the future cloud, indicating a corrective momentum in the trend. On the other hand, the Lagging Span moves above the price, indicating a buyers’ presence.
The above image shows how the buying pressure remained flat from the Traders' Dynamic Index Indicator. The TDI line showed a rebound from the upper band and remained flat at the 60.00 area. It is a sign that bulls have completed their momentum where selling pressure may extend if the TDI line moves below the 50 level. On the other hand, the dynamic Tenkan Sen and Kijun Sen are below the price, and any selling pressure will be valid if the price comes below the Kijun Sen line.
Based on the Ichimoku Cloud analysis, a bearish H4 candle below the static 1.2171 level would resume the current bearish trend towards the 1.1935 level. On the other hand, any bullish rejection from the dynamic Kijun Sen would extend the buying pressure towards the 1.2600 area.
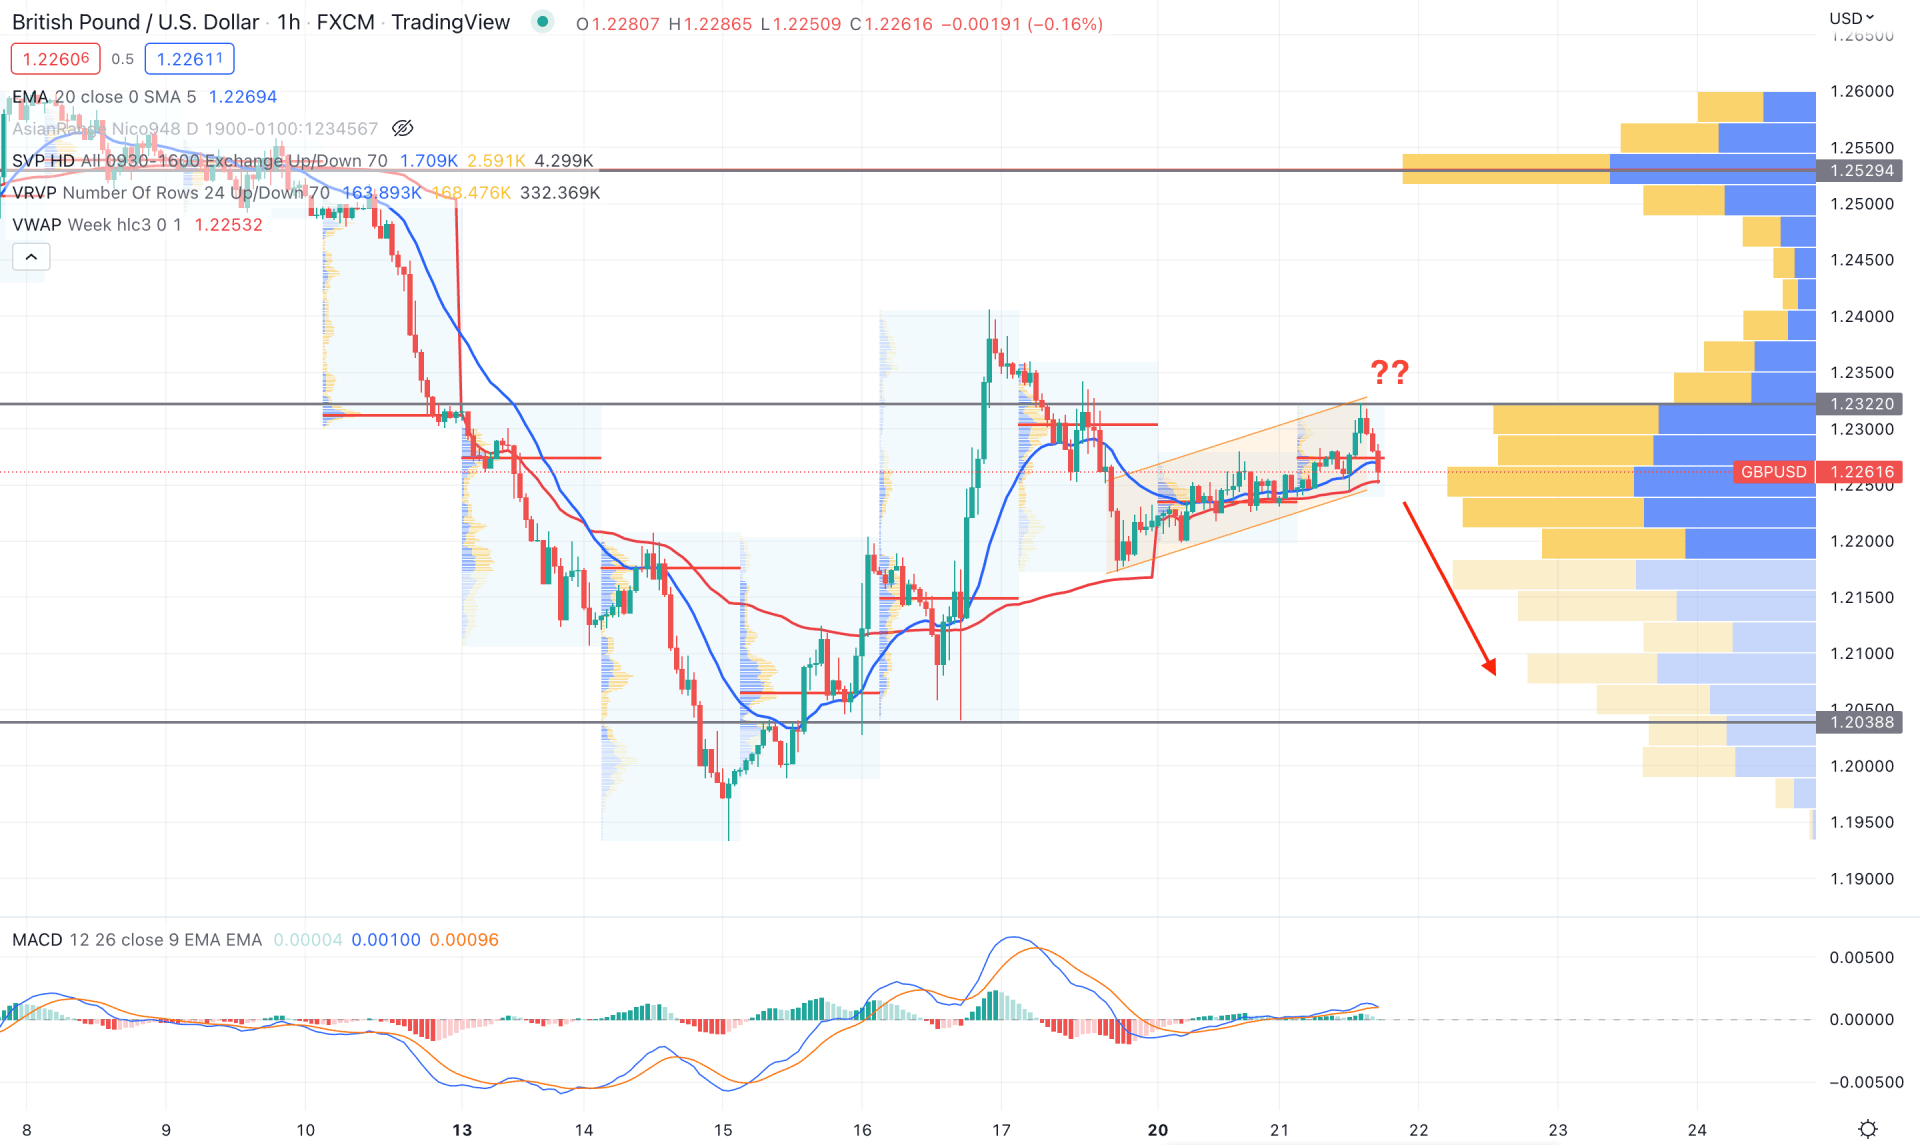
In the intraday chart, the GBPUSD trades within a corrective momentum where the recent price is moving higher within a rising parallel channel. According to the volume structure, the highest trading volume from the visible range is at the 1.2529 level, which is above the current price. Moreover, the latest intraday high volume level is closer to the price, indicating a corrective momentum.
In the indicator window, the MACD Histogram remained bullish in the indicator window, but its momentum is extremely corrective. Moreover, the dynamic 20 EMA and weekly VWAP are below the price, working as a near-term support level. In that case, if a bearish H1 candle appears below the weekly VWAP, it may increase the bearish pressure towards the 1.2038 level.
Based on the current price action, GBPUSD has a higher possibility of extending the current bearish pressure towards the 1.1935 level. However, investors should closely monitor the CPI report, where any surprise with lower inflation would be a bullish factor for this pair.