
Published: May 11th, 2022
The Bank of England provided the widely expected 25 bp rate hike last week with an optimistic growth forecast for the economy. The Committee now sees the bank raising the interest rate to 2.5% by mid-2023/. For the coming quarter, the CPI inflation is forecasted to rise over 9% and rise to 10% during Q4 2022. Moreover, the economy is struggling from higher inflation and unemployment that may rise further in three years from the showdown in demand growth.
On the other hand, the New Zealand employment change was increased by 0.1% Q/Q and 2.9% Y/Y in Q1. Moreover, the unemployment rate remained stable at 3.2%, while the labor participation rate dropped to 70.9% from 71.1% in the previous quarter. Overall, the New Zealand economy shows a stable employment report with higher wages, which is a primary sign of development.
When comparing the UK and New Zealand economies, we would find a potential bearish opportunity in the GBPNZD pair, which is currently trading in a strong bearish trend. Let’s see the future price direction from the GBPNZD technical analysis.
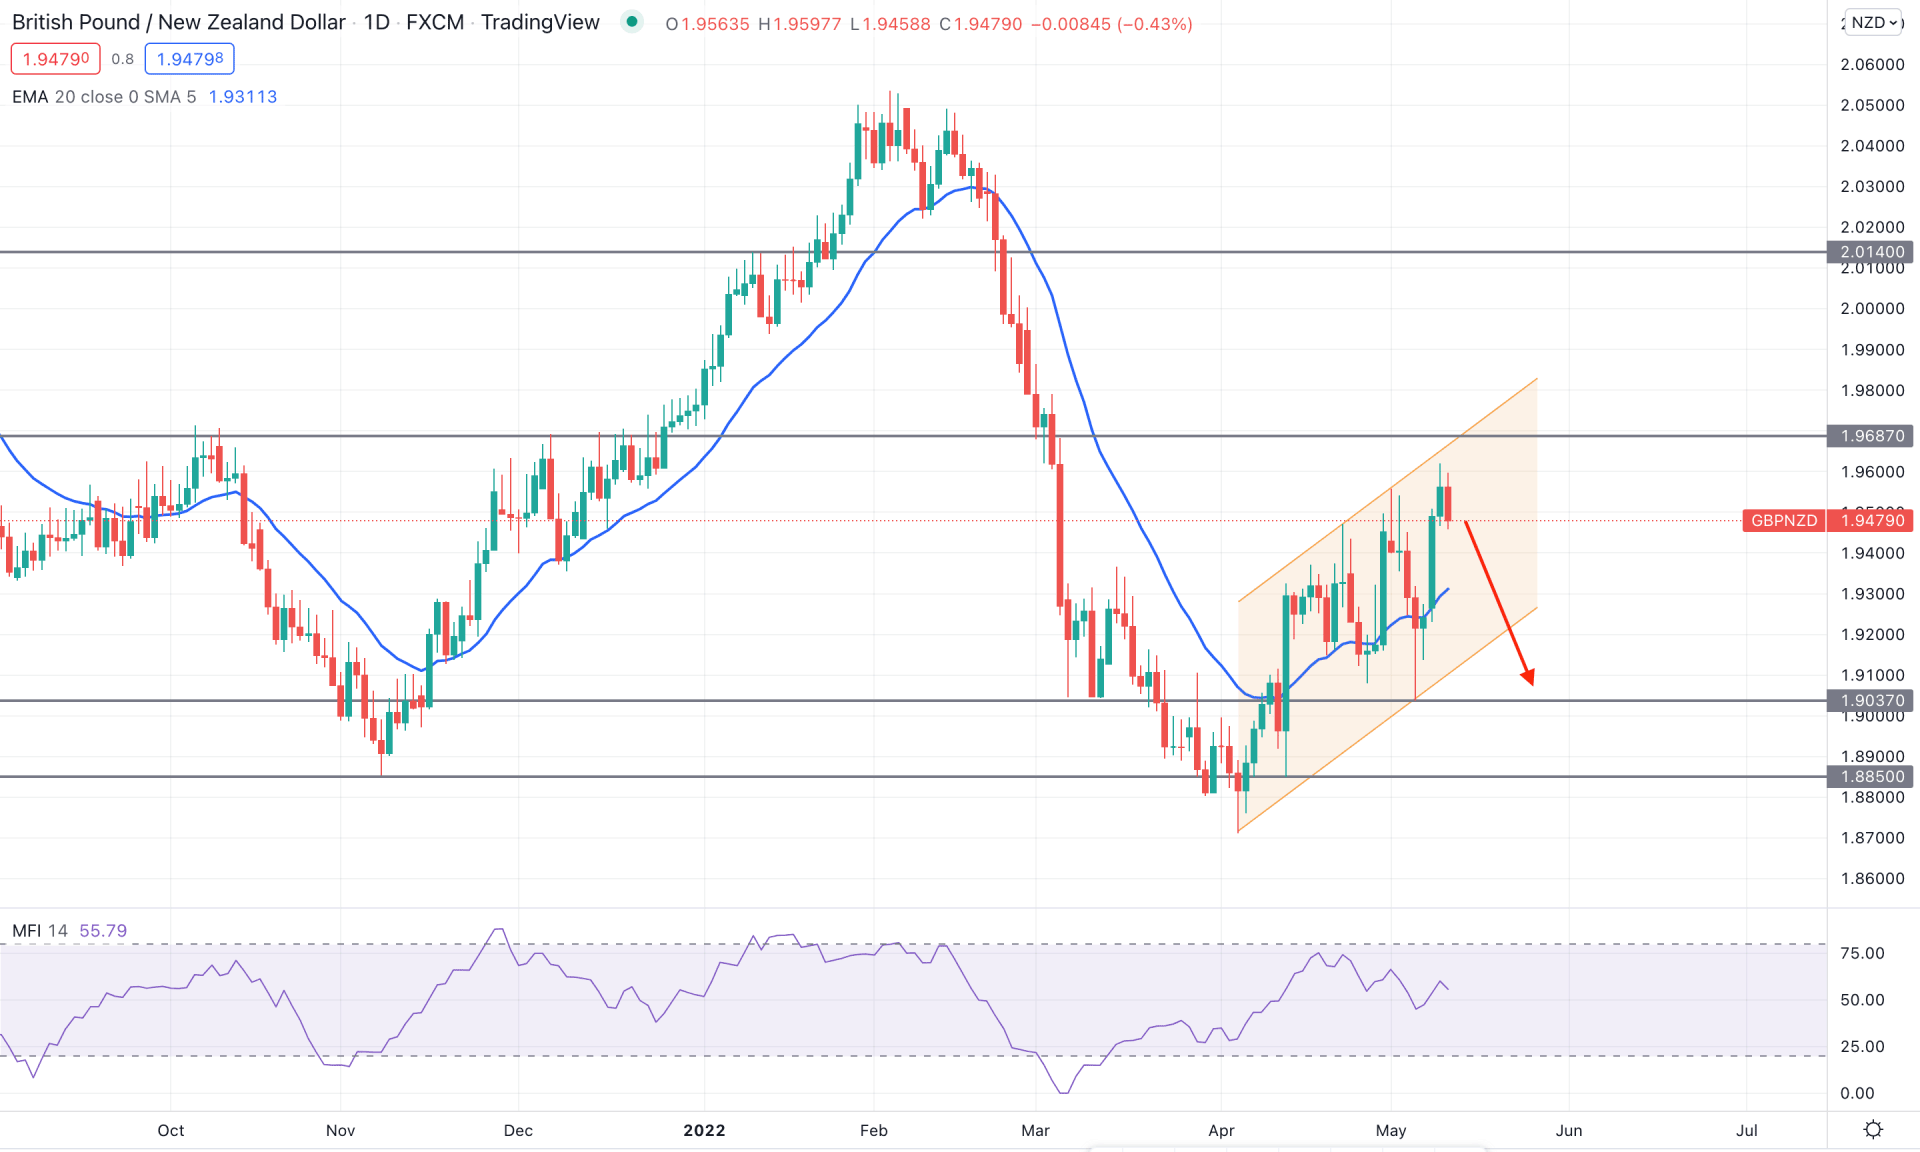
GBPNZD provided profit-taking opportunities in the last six months, where the price moved higher from 1.8850 to 2.0550. The bearish pressure from the 2.0550 swing high was more impulsive than the previous bullish leg. Moreover, the selling pressure made a new swing low below the 1.8850 level. The rejection rejection rejection from the dynamic 20 EMA would extend the bearish correction in the coming weeks.
The above image shows the daily chart of GBPNZD, where the price is still trading within the 50% Fibonacci retracement level from February 2022 high to April 2022 low. Moreover, the price trades within a bullish channel where the gap between the price and dynamic 20 EMA is high. Therefore, although the RSI is bullish above the neutral 50 level, the selling possibility is intact.
Based on the daily structure, the selling pressure in this pair is valid as long as it trades below the 1.9687 static resistance level in the daily chart. In that case, the primary target would be the dynamic 20 EMA, but the violation of the trendline support would lower the price with a bearish trend continuation pattern.
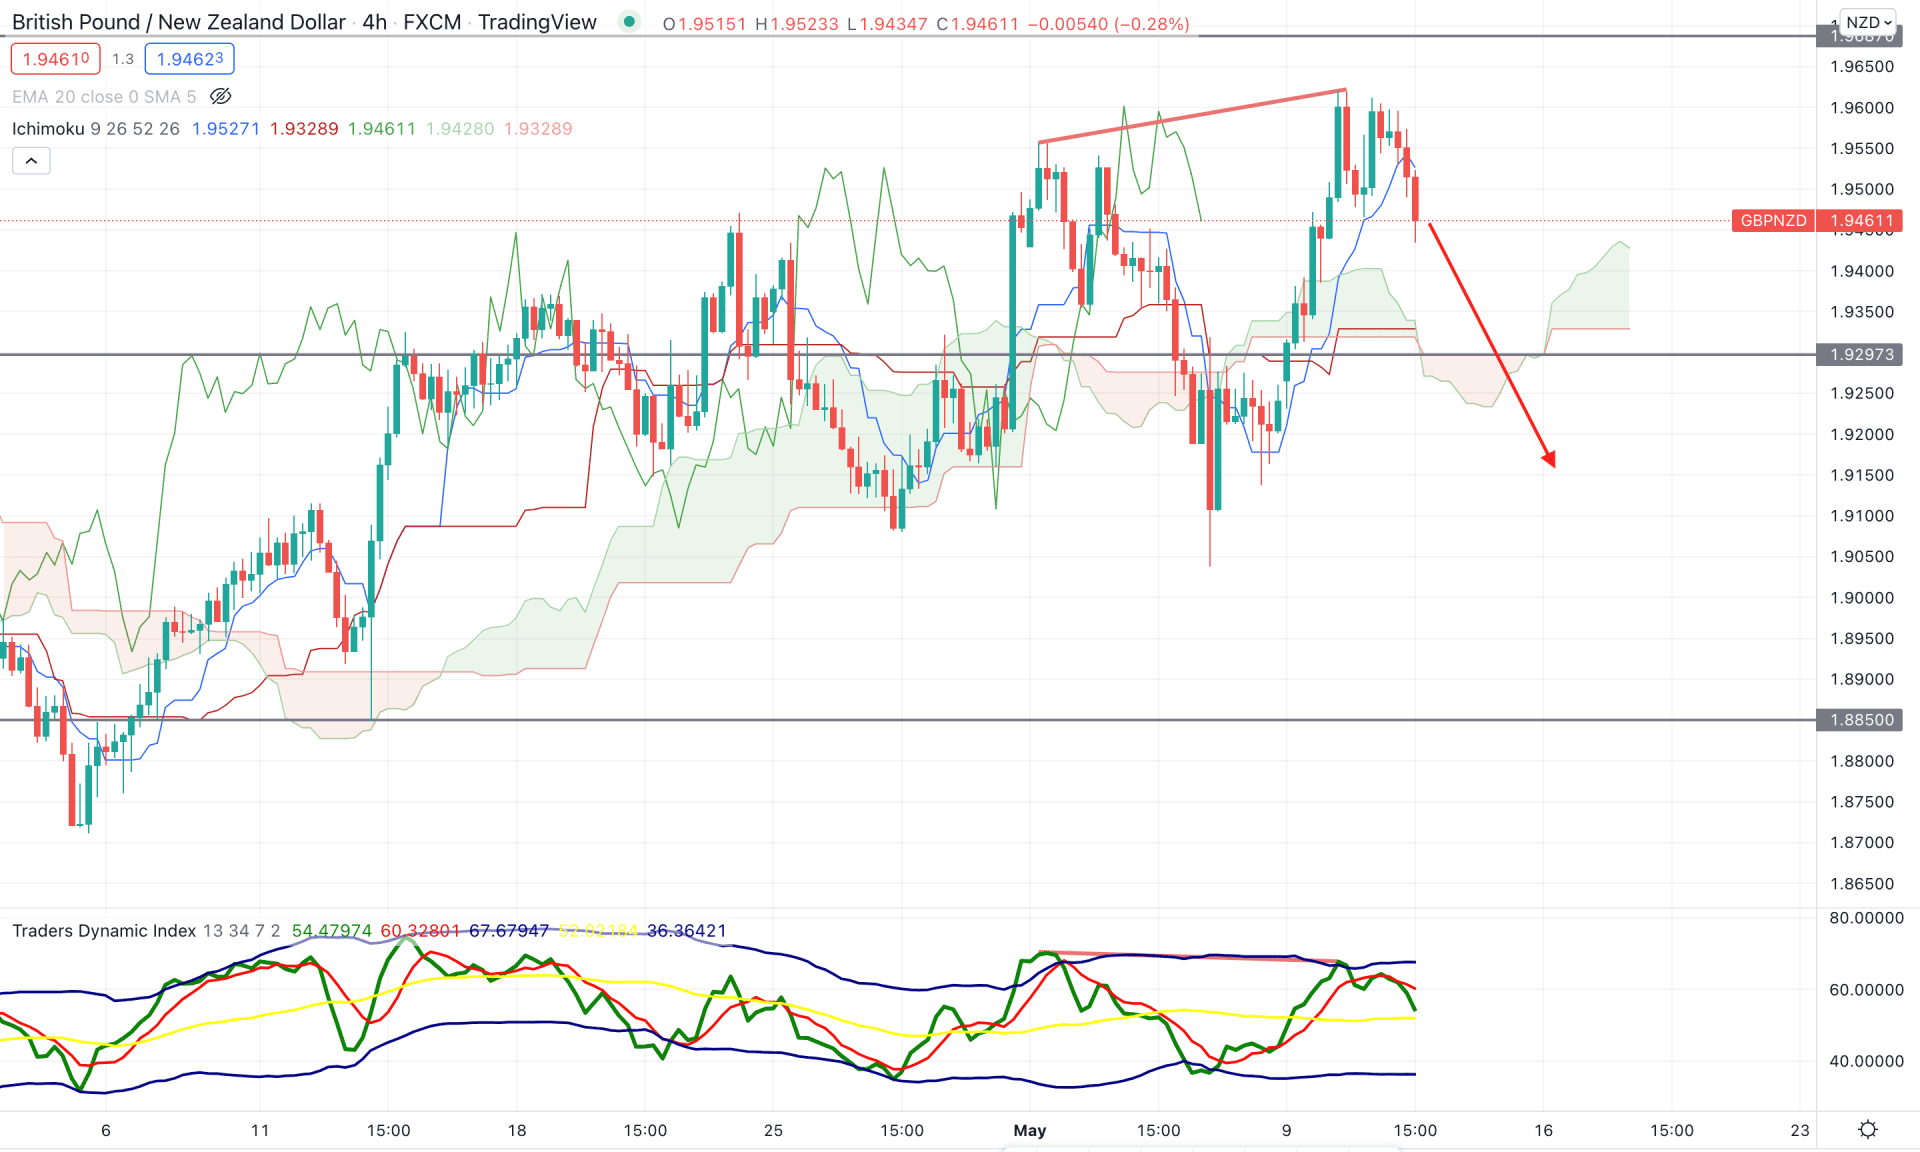
In the GBPNZD H4 chart, the price trades above the Ichimoku Kumo Cloud, while the gap between the Senkou Span A and Senkou Span B in the future cloud is strong. Moreover, the most recent price moved below the dynamic Tenkan Sen with an H4 close, while the static 1.9687 resistance level is above the current price.
In the indicator window, the Traders Dynamic Index (TDI) formed a divergence with the price in the indicator window in the indicator window. At the same time, the recent TDI line aimed lower after testing the upper band level. Moreover, the price is overextended from the dynamic Kijun Sen, while the gap between the Tenkan Sen and Kijun Sen is high.
Therefore, based on the H4 price pattern, a bullish trend continuation is possible if the price shows any buyers' interest in the dynamic Kijun Sen line. On the other hand, the best approach is to wait for a breakout below the 1.9297 level with an H4 close to extend the selling pressure towards the 1.8850 level.
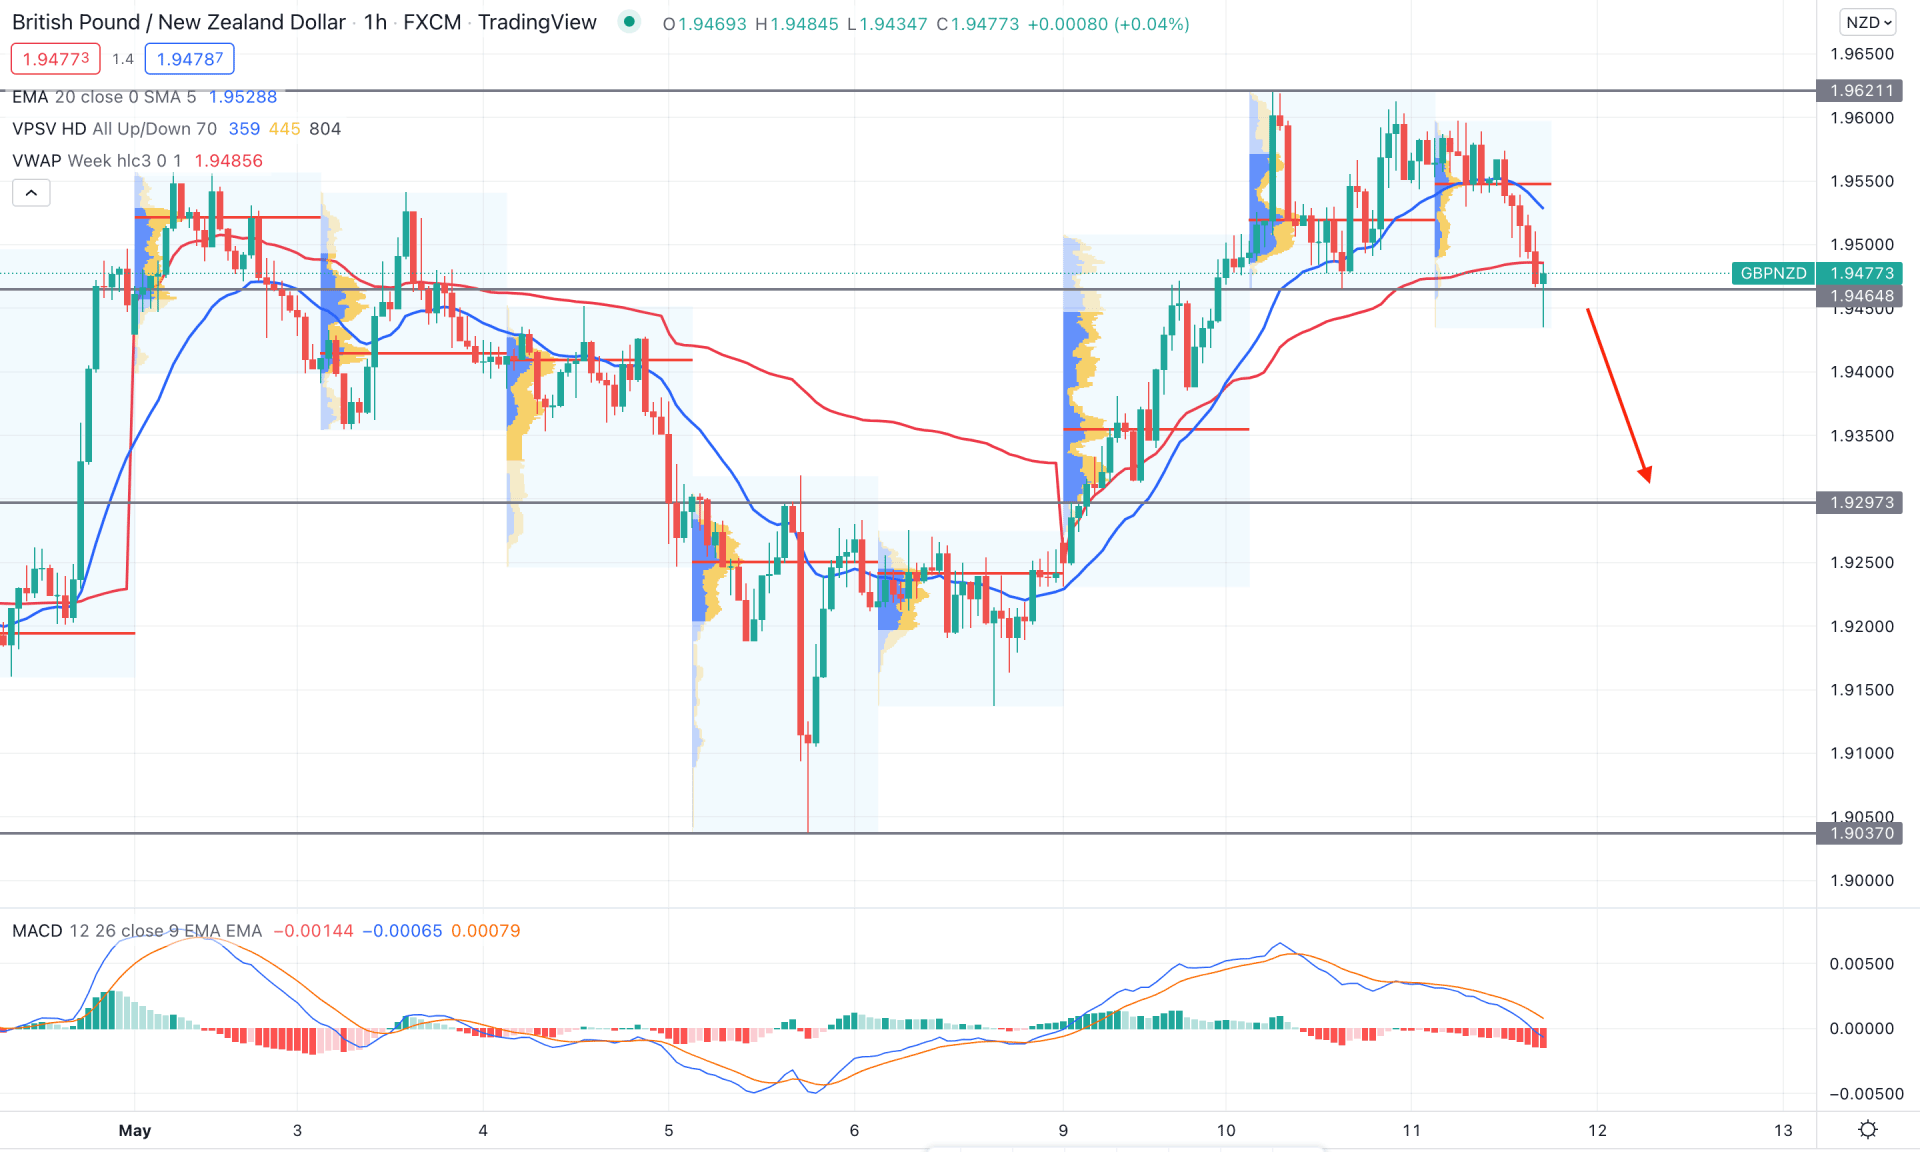
In the GBPNZD intraday chart, the price became extremely corrective as it reached the 1.9621 intraday resistance level. Therefore, bears gained strong momentum in this area and took the price below the dynamic 20 EMA. Moreover, the selling pressure came with the support from volume, where the most recent intraday high volume level is at 1.9546 level.
The above image shows how the MACD Histogram turned bearish while the MACD line reached the neutral level. Meanwhile, the dynamic weekly VWAP is above the current price that may work as a dynamic resistance.
However, the intraday price struggled to form a stable bearish pressure below the 1.9468 support level. Therefore, the bearish pressure may extend if an H1 candle closes below the 1.9440 area. On the other hand, a strong bullish rebound with an H1 close above the dynamic 20 EMA would extend the buying pressure towards the 2.0140 area.
As per the current market context, GBPNZD is more likely to move down as the long-term trend is bearish, and the recent price action shows bearish rejection from the channel resistance. However, the intraday market is volatile, where close attention to trade management is needed to join the bearish rally.