Published: January 11th, 2022
GBPJPY retreated lower during the Asian session but rebounded immediately after the London open. The earlier gain was supported by the overnight bounce from the 156.00 level. The key price driver is the Omicron sentiment, where the current hope is to keep the GBP favorable than the JPY. Moreover, the Bank of England might raise the interest rate where further upside pressure in the GBP is visible.
UK Prime Minister Boris Johnson said they are looking to reduce the quarantine period to 5-7 days besides showing significant progress in seeing Omicron. On the other hand, the number of cases is still increasing, a negative factor for the country. In 2022, BoE sees three to four rate hikes while the current selling pressure in the US Dollar increased investors’ attention to see a goodish lift to the GBPJPY cross.
On the other hand, the sign of stability in the equity market undermined the JPY but provided a bid tone to the GBPJPY price. However, investors should monitor how the price reacts on the current horizontal resistance area where a new swing low might provide a bearish opportunity in this pair.
Let’s see the upcoming price direction from the GBPJPY technical analysis:
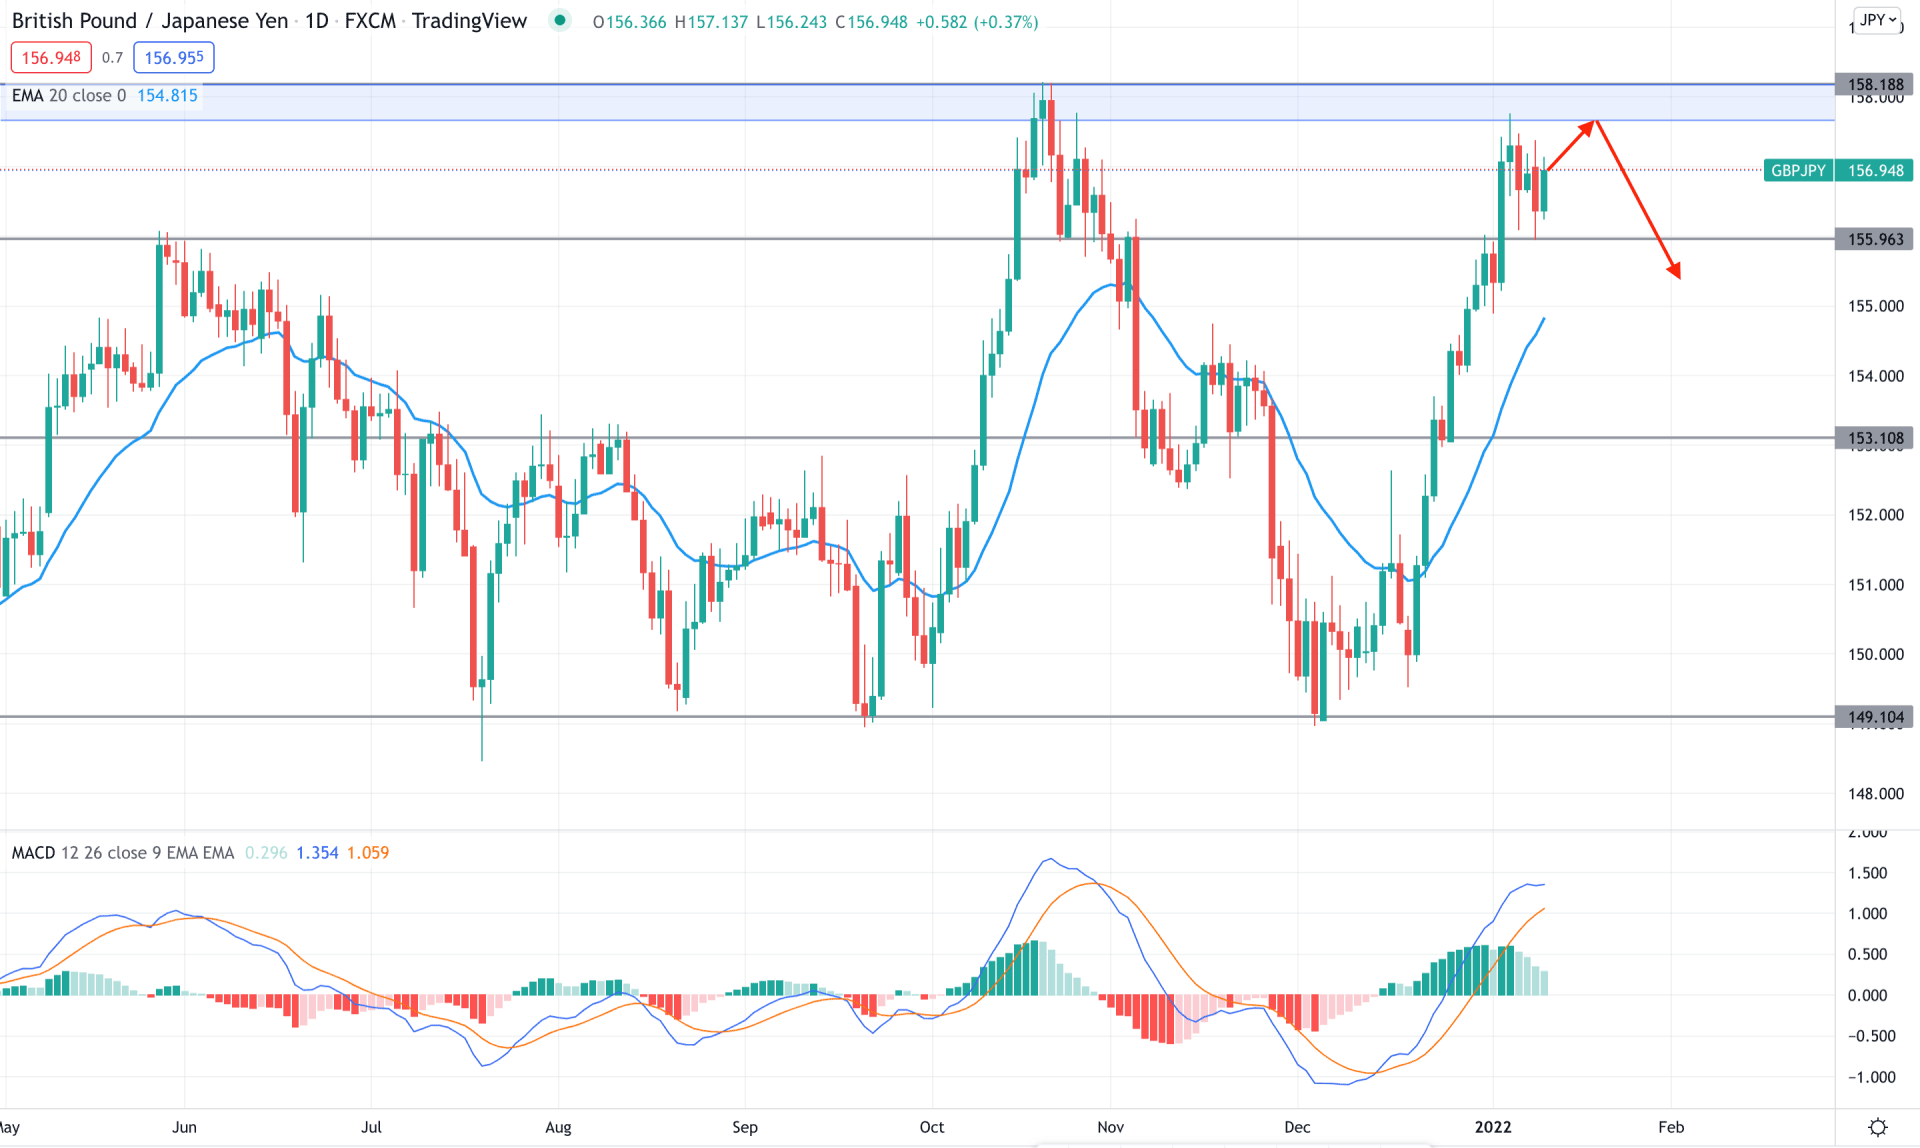
GBPJPY is considered a volatile pair that usually provides higher movement among other JPY crosses. In recent months, there is no exception to this where the price provided 800 pips profit to bulls and bears. However, the recent bullish pressure from the 149.00 level became corrective after reaching the 158.18 to 157.70 supply zone. Therefore, investors should closely monitor how the price trades at these areas where a bearish correction is pending until bulls break the resistance level with a daily close.
The above image shows how the price trades above the dynamic 20 EMA while the bullish MACD Histogram loses its momentum. Moreover, the MACD line is above the Histogram and shows a corrective momentum. Nevertheless, the price still trades between the 158.18 to 156.00 range, where a bearish breakout is needed to rely on the selling opportunity.
Based on the daily context, there are two bearish opportunities- the first is a bearish rejection from the 158.18 resistance level, and the second is after the breakout below the 156.00 level. In both cases, investors need confirmation from lower timeframes while a breakout and a daily close above the 158.18 level may invalidate the current opportunity.
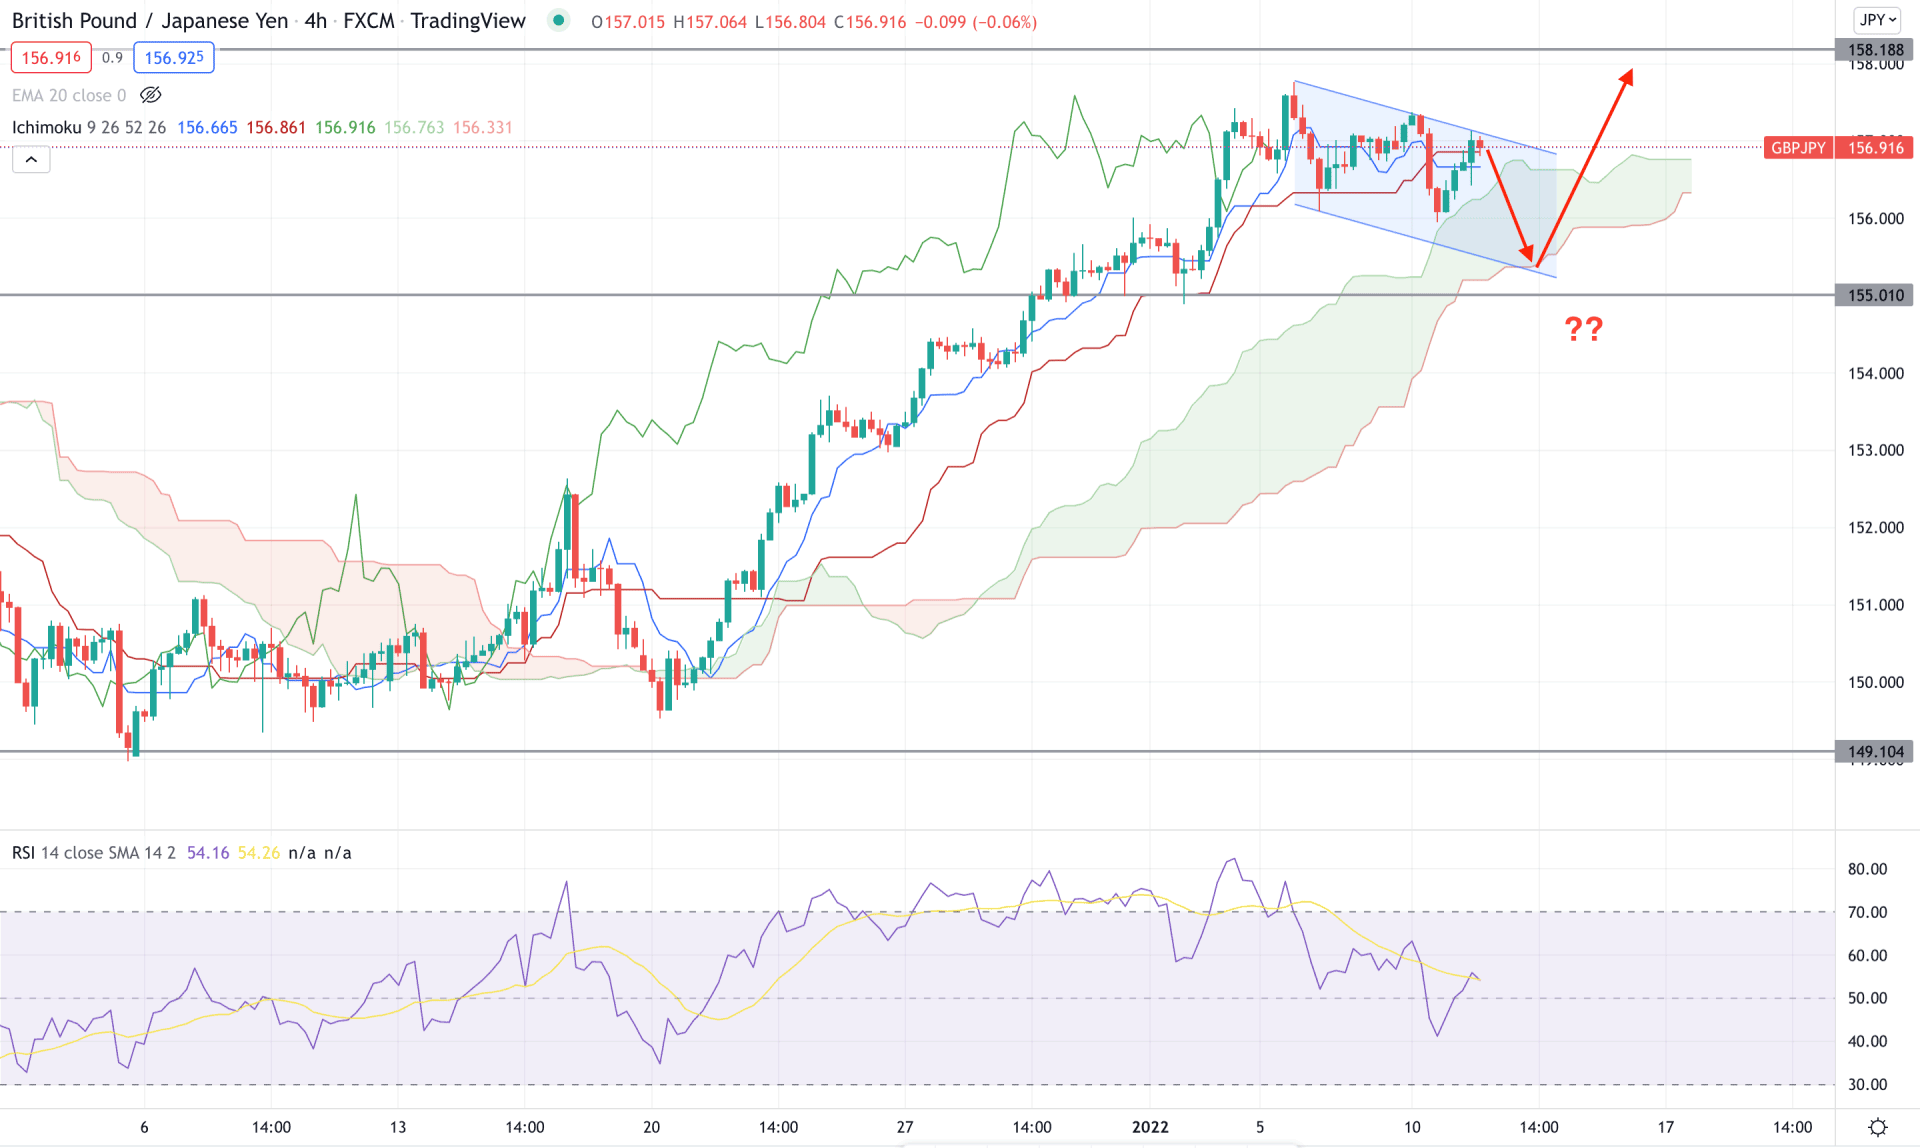
In the H4 chart, the GBPJPY price is trading within a bullish trend while the current price is above the Kumo Cloud with intense buying pressure. However, in the most recent chart, the future cloud is bullish but corrective while the Lagging span is within the price. Therefore, a deep correction is pending in the price within the Kumo Cloud with a corrective momentum.
The above image shows how the price trades within a bearish channel where a correction to the channel support is pending. On the other hand, the RSI moved down from the overbought 70 level and became corrective at 50 areas. Based on this price structure, bears should wait for the price to form a bearish H4 close below the 155.00 level with a hope of a correction towards the 150.00 level. On the other hand, a bullish rejection from 155.00 to 155.60 would be a buying opportunity in this pair.
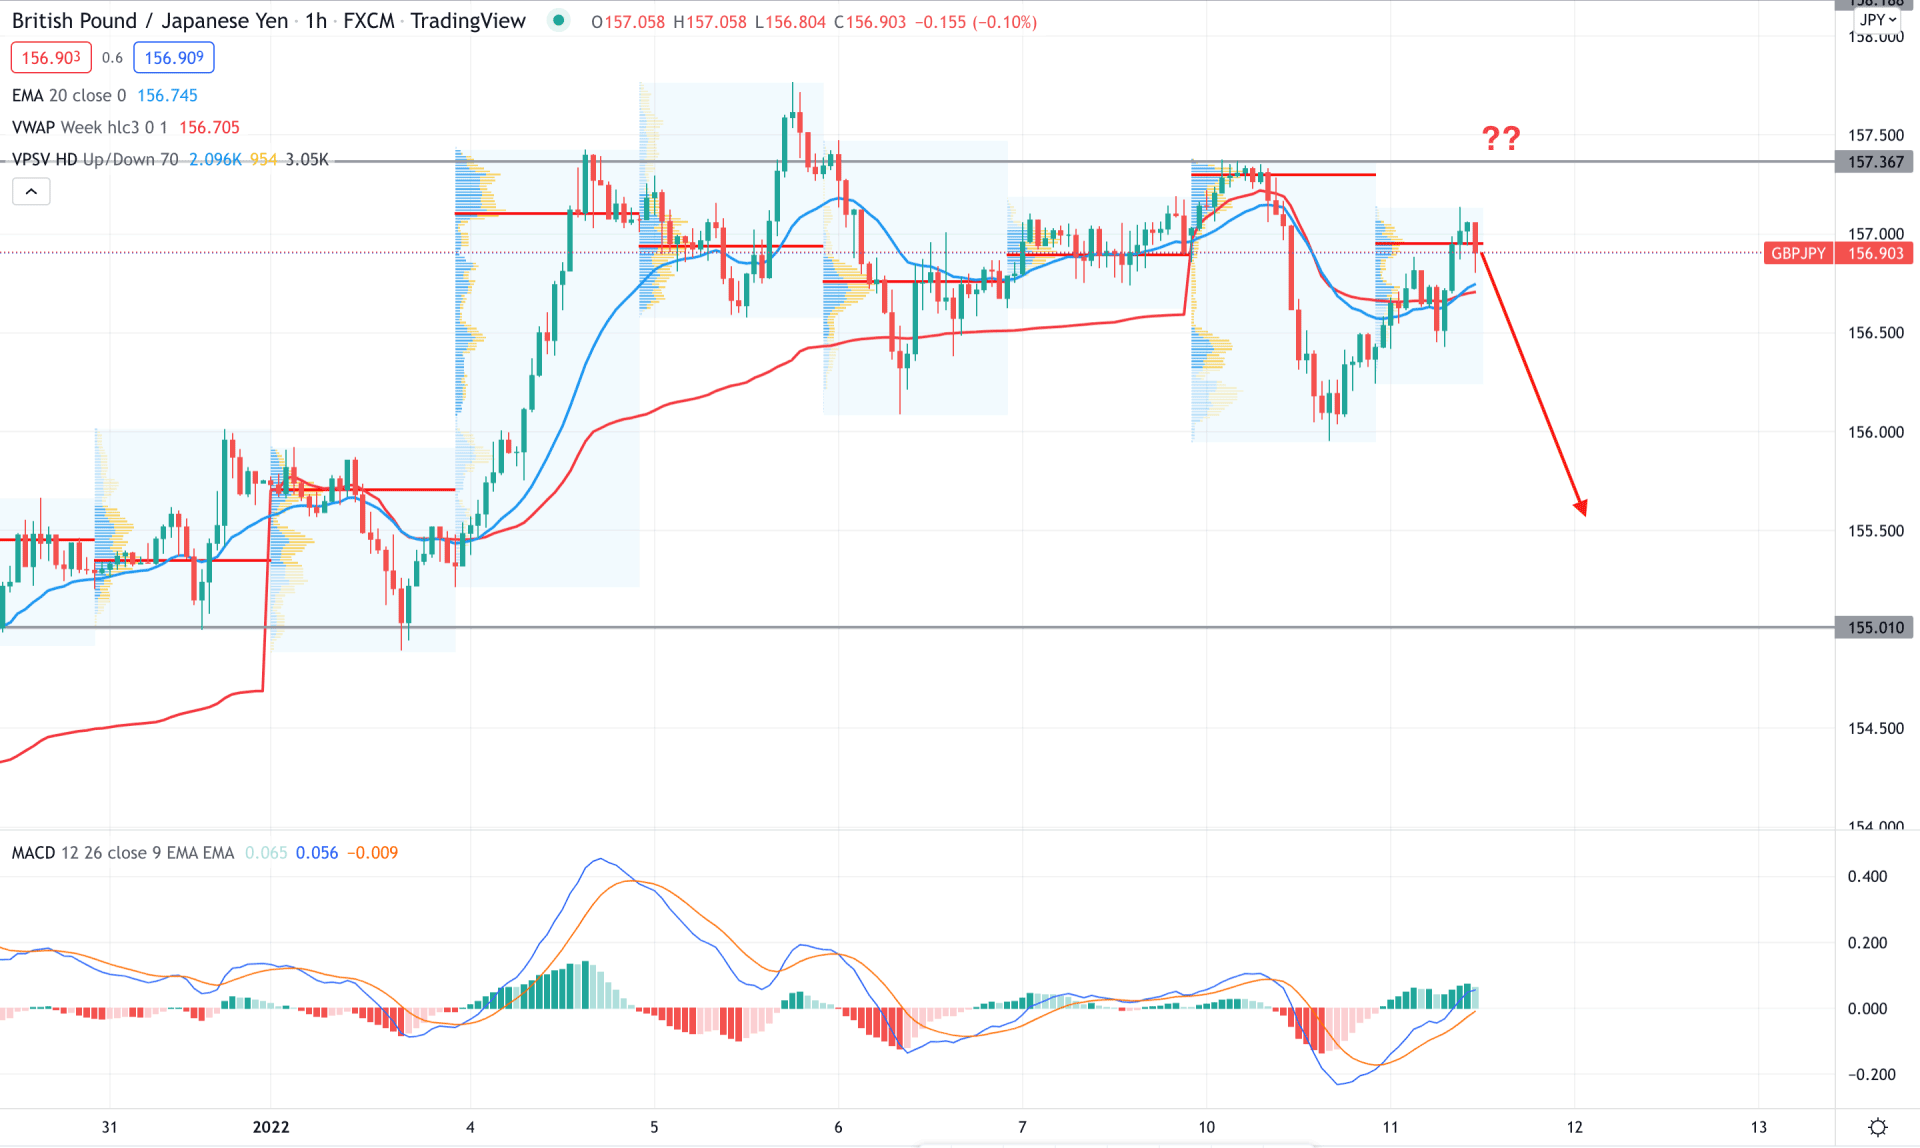
In the intraday chart, the GBPJPY is trading within a corrective momentum where the current price is above the dynamic 20 EMA. Moreover, the most recent high volume level is at 156.96 level from where the price is showing rejection. In that case, a bearish H1 close below the dynamic 20 EMA would be a selling opportunity in this pair.
In the above image, we can see that the MACD histogram is bullish and aiming higher while dynamic 20 EMA and weekly VWAP are below the price. In that case, a bearish H1 close below the weekly VWAP would open the bearish opportunity towards the 155.00 level. On the other hand, a bullish rejection from dynamic levels with an H1 close above the 157.56 resistance would open a buying opportunity in this pair.
According to the current observation, investors should monitor how the GBPJPY trades at the current supply zone, where a bearish opportunity is valid if the price comes below the Kumo cloud in the H4 chart.