
Published: May 5th, 2021
GBPJPY is the most volatile currency pairs that usually provides decent impulsive movements. The Great Britain Pound is the 4th most traded currency globally, where the Japanese Yen is 3rd. This week, the key price mover for this pair is the BoE Monetary Policy Report, where the current projection is a hawkish statement from the BoE Policymakers.
The UK government is stronger than Japan in the Covid-19 recovery, making the GBP stranger than the JPY. Therefore, investors should closely focus on the monetary policy statement this week, where any hawkish tone may take the GBPJPY price higher. However, the price became volatile at the $152.00 level that may make buyers remain cautious. Let’s find the upcoming price direction from the GBPJPY technical analysis!
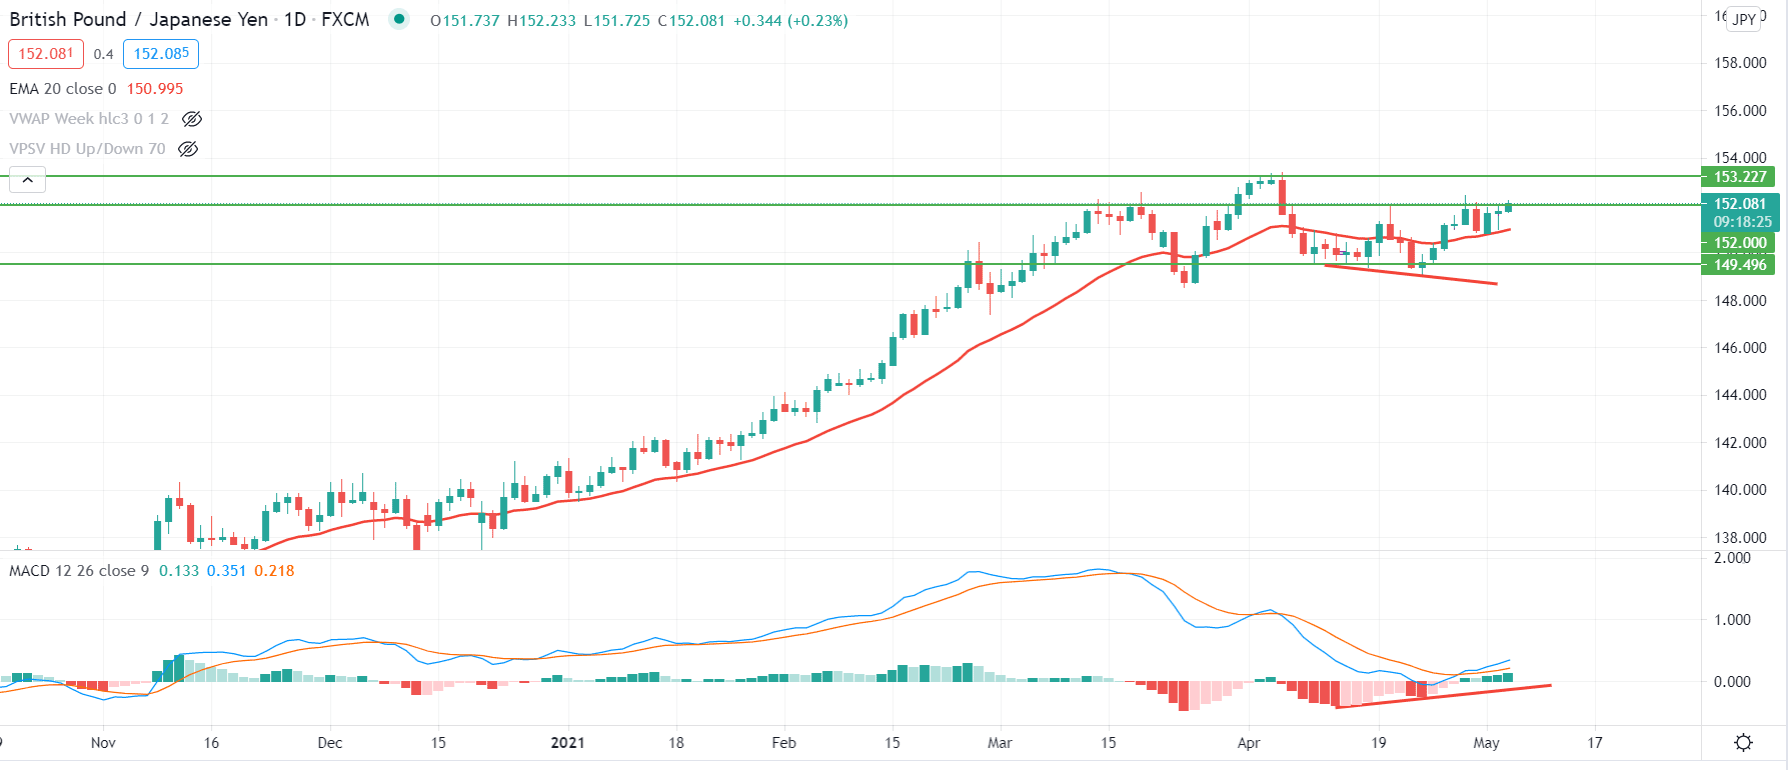
GBPJPY is moving upside within a strong uptrend where the price was carried by dynamic 20 EMA from 138.00 to 152.00 level before making a swing low at 148.56 level. Later on, the price tried to move lower but failed to break below the 148.56 level, indicating an upcoming bullish possibility in the price.
In the above image, we can see the daily chart of GBPJPY, where the most recent price shows volatility by violating the dynamic level multiple times. However, the price failed to move below the 149.50 support level with a daily close. Therefore, a potential hidden divergence formed in MACD, and the price moved above the dynamic 20 EMA.
Currently, the price is approaching 152.00 level with a bullish two bar reversal and an inside bar. Besides, the 20 EMA carry is providing more support to the price that may increase the bullishness in the chart. In this situation, a bullish daily close above the 152.00 level may take the price higher above the 153.00 level.
On the other hand, any bearish daily close below the dynamic 20 EMA may alter the current market structure. In that case, the price may come down towards the 149.50 support area.
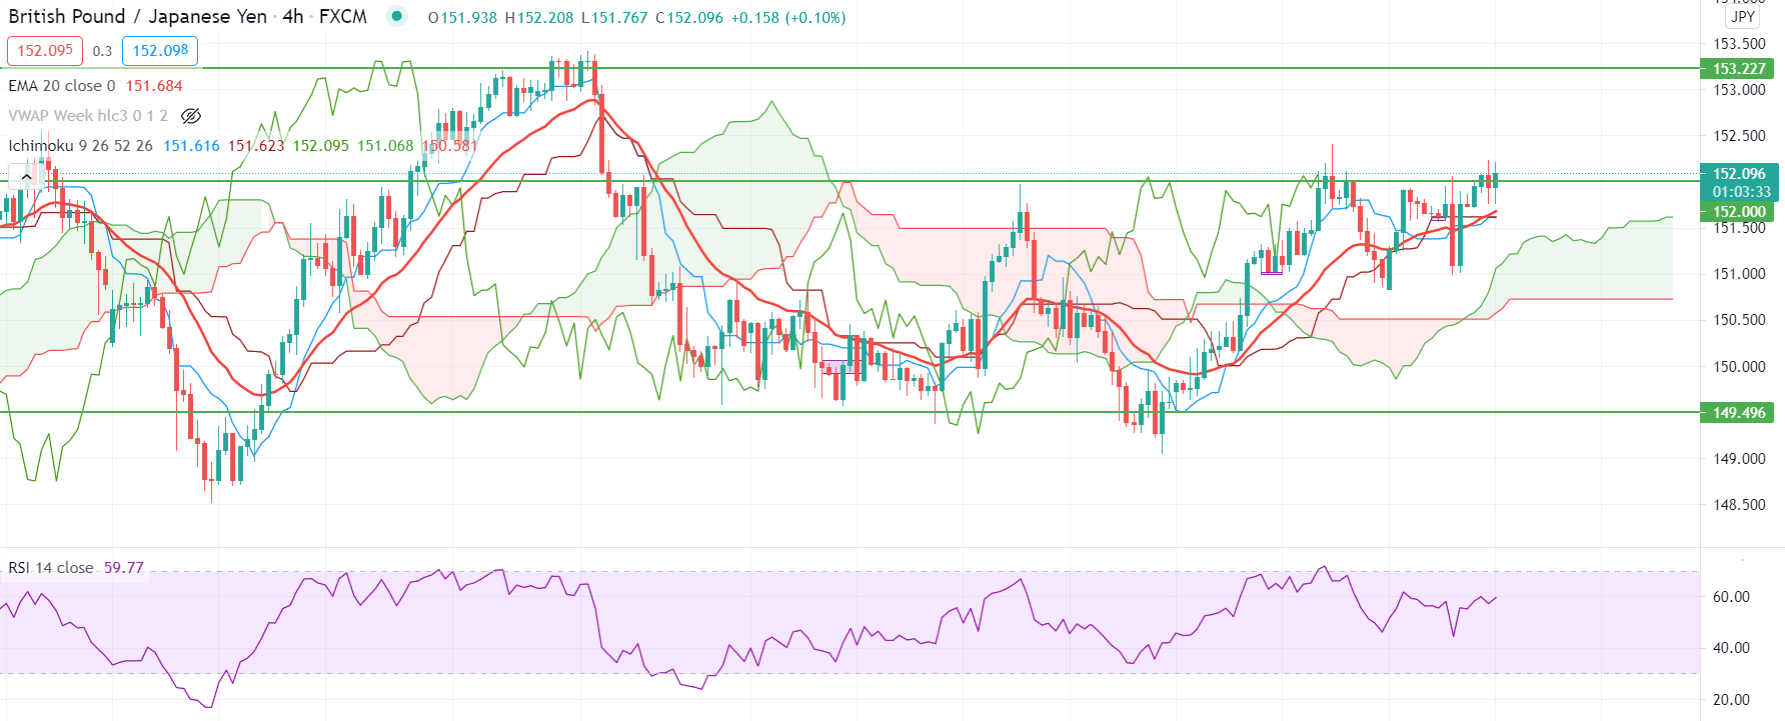
Based on the Ichimoku Cloud in the H4 timeframe, the price is moving within a correction as it breaks below and above the Kumo Cloud multiple times.
At the current price, the Tenkan Sen and Kijun Sen provide support by remaining below the price with an appropriate candlestick rejection. Moreover, in the future cloud, the Senkou Span A is above the Senkou Span B and pointing up, which indicates an upcoming bullish pressure in the price.
In this market condition, the overall outlook is bullish as long as the price trading above the dynamic Kijun Sen and Senkou Span A. In that case, the primary target would be the 153.32 resistance level from where the correction may happen.
Conversely, if the price comes below the Kumo Cloud, it may move lower towards 149.50 and 149.00 support levels.
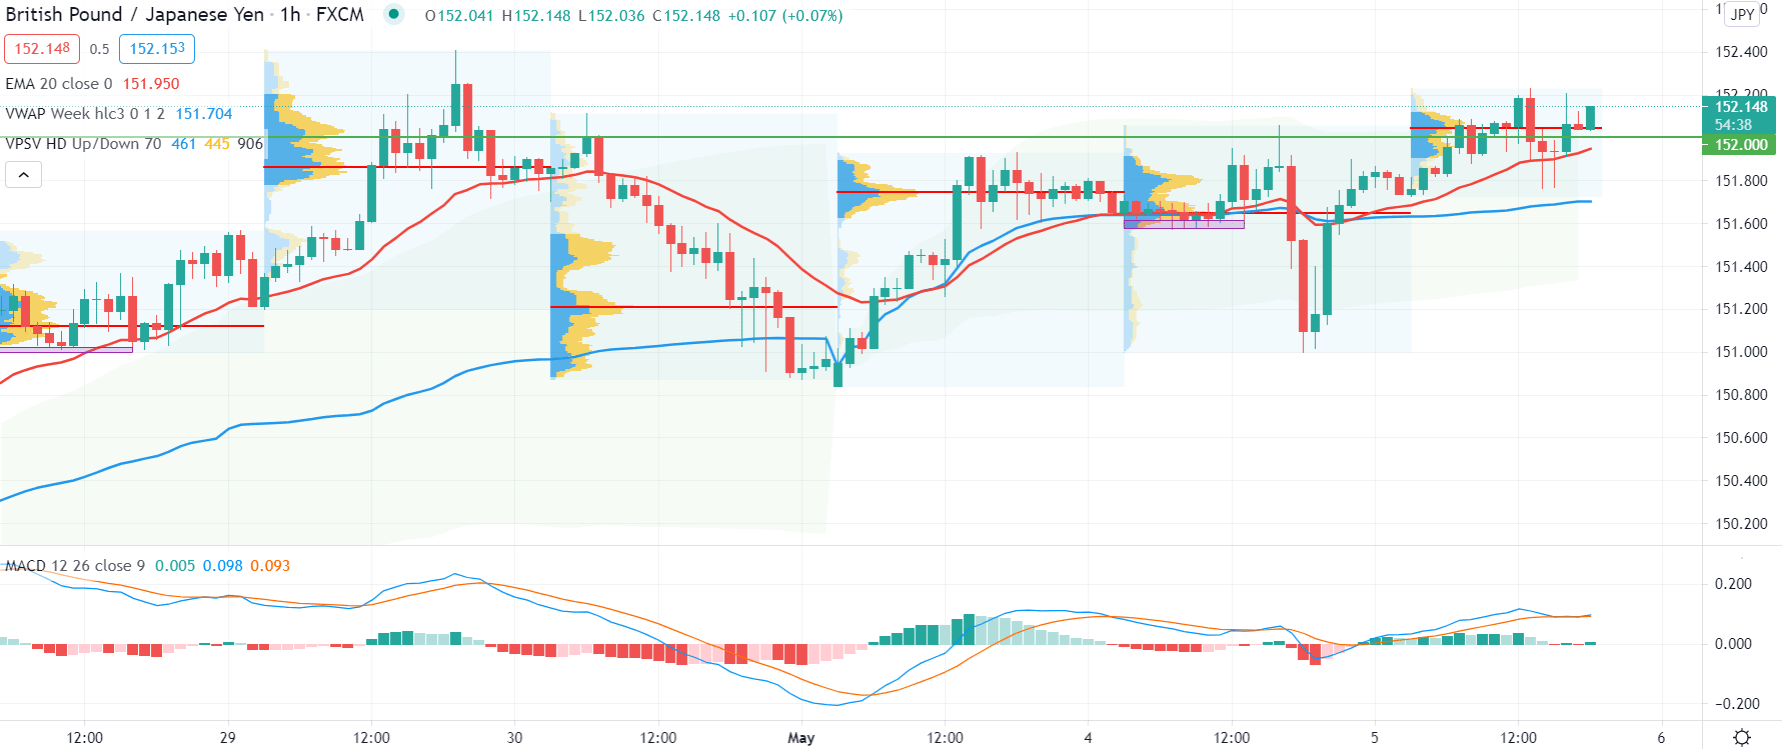
In the intraday chart, the current high volume area is at 152.05, which is below the current market price. Moreover, the previous high volume levels made higher highs, indicating buyers’ dominance in the price.
In the above image, we can see the H1 chart of GBPJPY where the price is trading above the dynamic 20 EMA and vwap. Therefore, as long as the price is trading above the vwap support, we may expect another bullish leg upside. Moreover, the MACD Histogram is bullish and pointing up.
On the other hand, if the price comes below the intraday high volume and vwap level with a bearish H1 close it may move lower towards the 151.00 level.
As of the above discussion, we can say that the GBPJPY has a higher possibility to continue the bullish pressure towards the recent swing high of 153.32 level. The price is getting support from the Ichimoku Cloud in the H4 timeframe and dynamic vwap from the H1 timeframe. Moreover, a bullish daily close above the 152.00 level may take the price higher above the 153.32 resistance level.
On the other hand, investors should closely monitor the 152.00 level where a strong bullish rejection with a bearish daily close may alter the current market structure. In that case, the next target would be at 149.50 level.