
Published: February 2nd, 2022
In the latest UK preliminary PMI data, investors have seen a drop in manufacturing sectors from 57.9 to 56.9 in November while a slide to service sectors from 53.6 to 53.3 in December. However, the Markit noted an increase in business confidence that might show solid growth in job sectors. On the other hand, the inflationary pressure remained at the record high that might push the Bank of England to raise the interest rate in this week's meeting. The reading to supply chain constraints showed some improvement that might influence the UK economy to lower costs for business and consumers.
This week's BoE meeting may show a 25 bp rate hike, pushing the bank rate to 0.50%. Moreover, the hawkish tone regarding the stoppage of reinvestment of maturing bonds would tighten the economic policy, strengthening the GBP.
On the other hand, the safe-haven nature of CHF remained questionable as the SNB stood sidelined although the EURCHF price reached the multi-year lows. In this situation, the Sterling might take a chance by breaking the trendline resistance that will confirm the inverse head and shoulder formation.
Let’s see the upcoming price direction from the GBPCHF technical analysis:
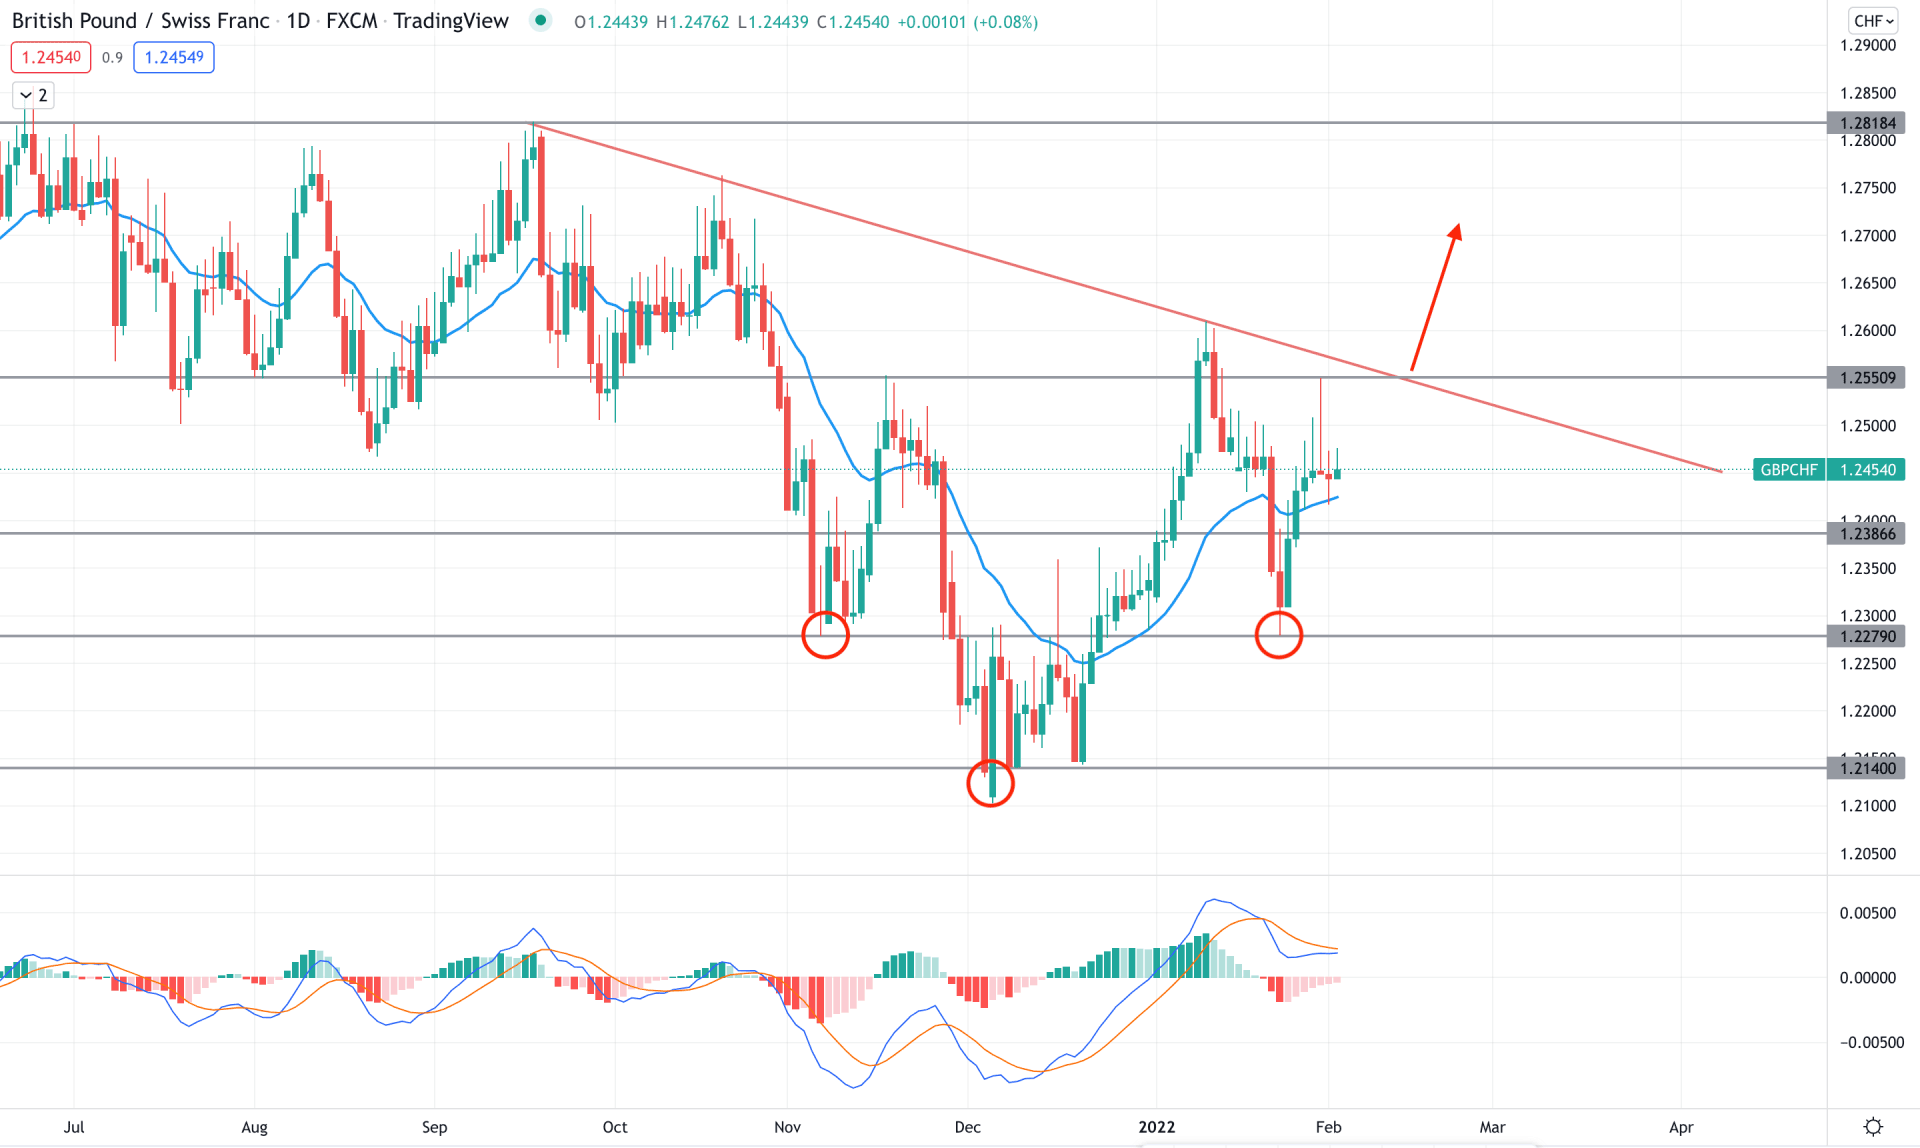
GBPCHF bearish pressure from 1.2818 showed weakness as recent swing lows of 1.2279 and 1.2140 became questionable after breaking the structure at 1.2550. Later on, bears tried to regain the momentum but failed to breach the 1.2279 static level that formed a potential inverse head and shoulder pattern that is yet to confirm by breaking out from the trendline.
The above image shows how daily candles moved above the dynamic 20 EMA while the MACD Histogram became corrective at the neutral zero area. Therefore, the neutral sentiment needs a confirmation of breakout by breaking out above the 1.2550 level before considering the upcoming price pressure as bullish.
On the other hand, any bearish rejection from 1.2550 or a daily candle close below the dynamic 20 EMA might eliminate the current market structure, increasing the bearish pressure towards the 1.2279 level in the coming days. Investors should closely monitor how the BoC rate decision is coming where a hawkish tone with a rate hike would increase the breakout possibility for bulls.
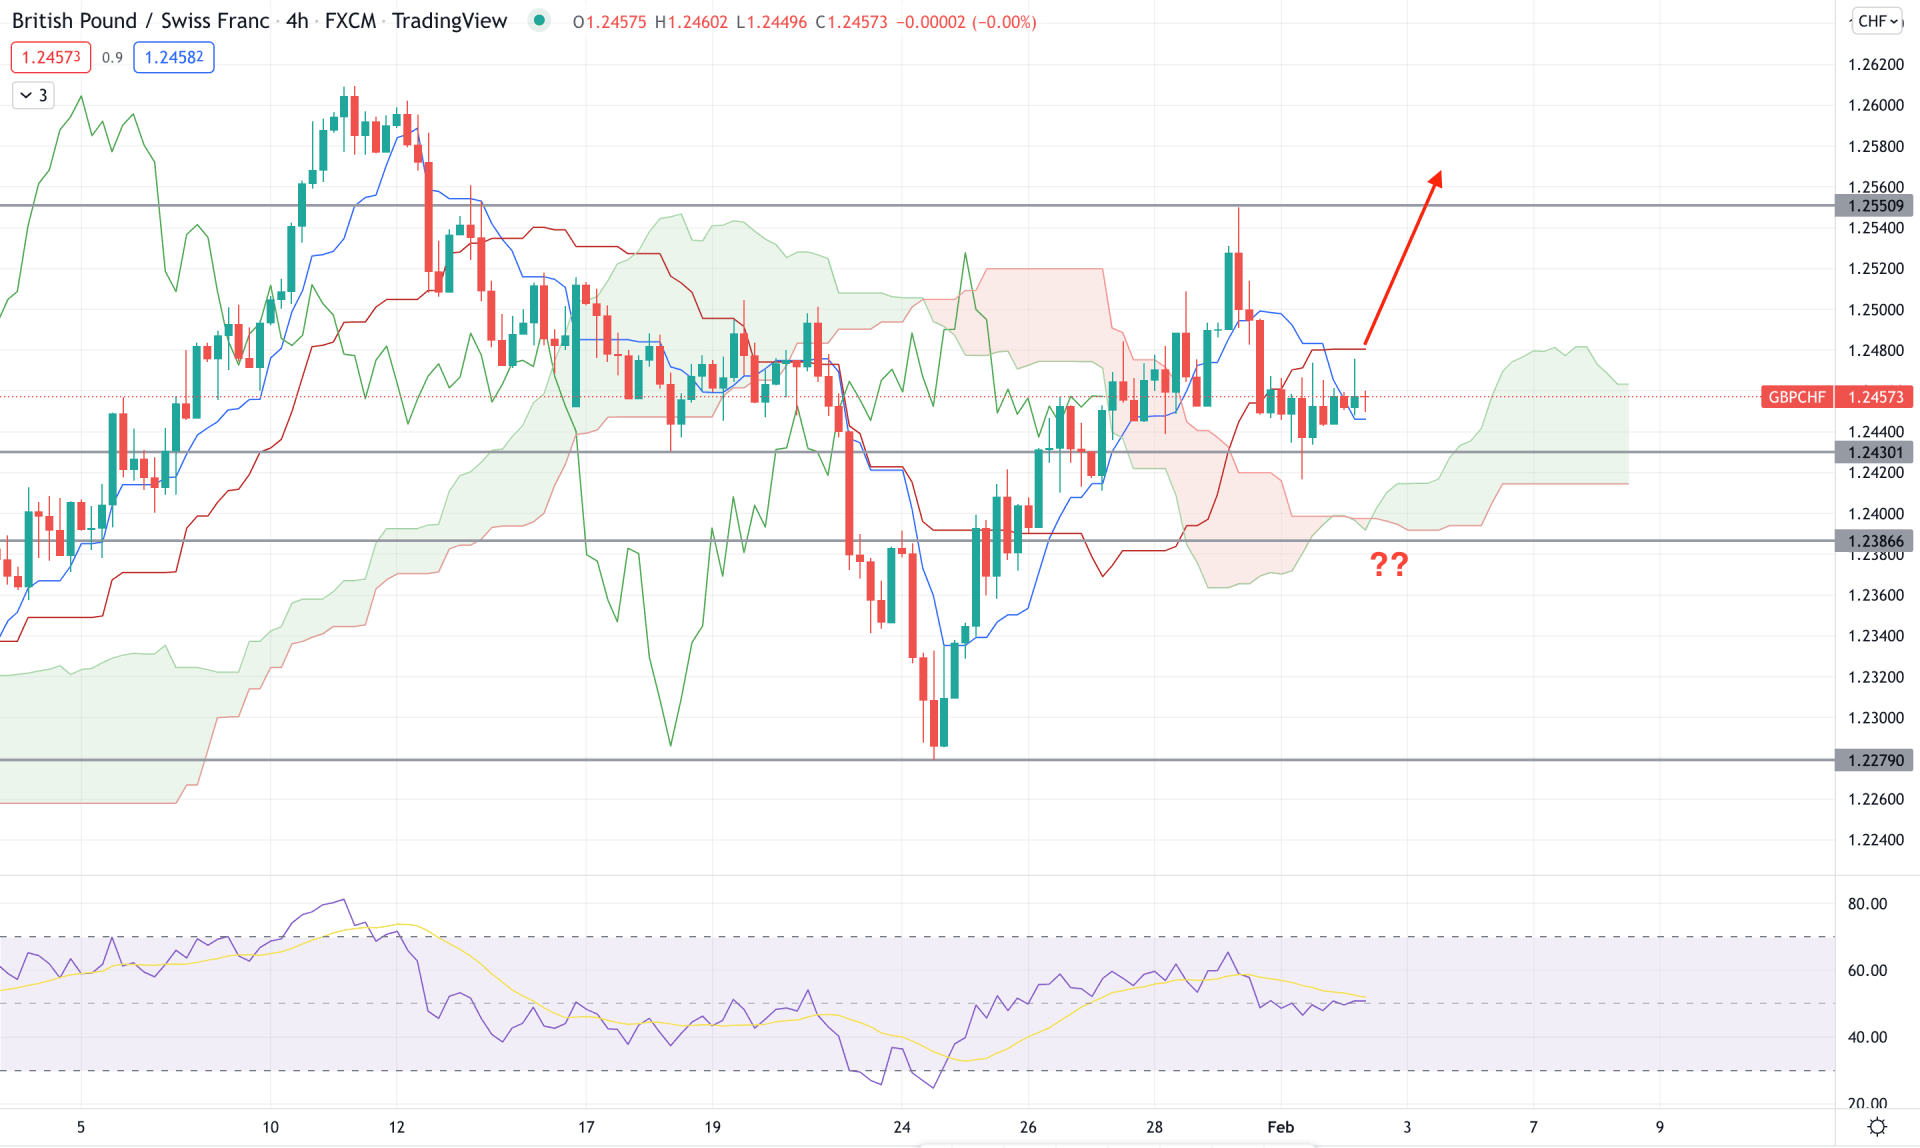
According to Ichimoku cloud, the GBPCHF H4 chart is trading within a bullish trend where the current price is above the Kumo Cloud while the future cloud is bullish. Senkou Span A is above the senkou Span B in the future cloud, while the Lagging Span aims higher from the support level.
The above image represents the corrective structure in the RSI line that moves sideways at 50 level, without testing the overbought 70 area. On the other hand, there is a bearish crossover in Tenkan and Kijun lines while the price remained corrective.
Therefore, based on the H4 price structure, a bullish H4 candle above the dynamic Kijun Sen would increase the buying pressure towards the 1.2650 area. On the other hand, investors should closely monitor how the price trades at the 1.2400 level, where a bearish H4 below 1.2386 might alter the current market structure and initiate a selling pressure towards the 1.2300 area.
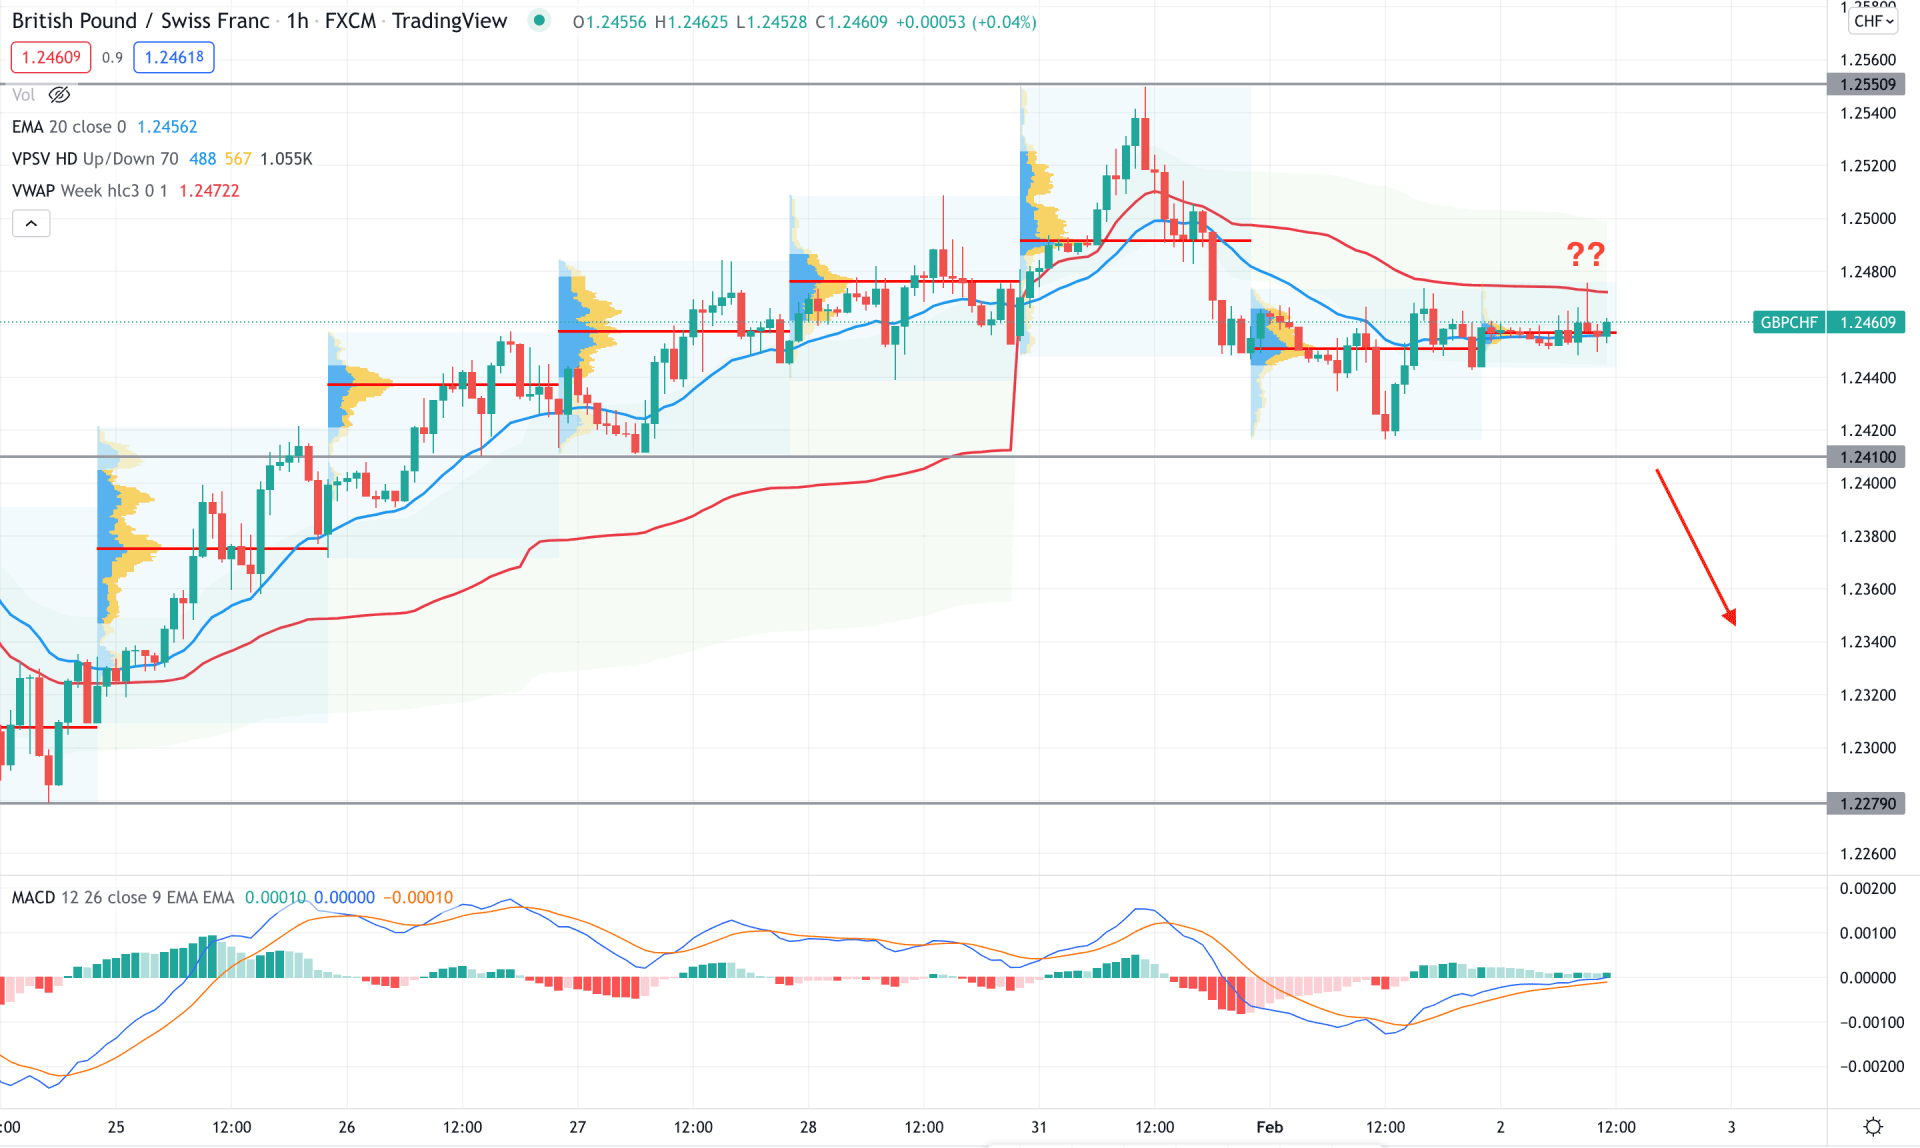
GBPCHF is trading within a corrective pressure in the intraday chart as the current price faces resistance from dynamic 20 EMA and weekly VWAP. Moreover, the recent change in volume is not enough to consider the current trend as solid.
The above image shows a contradictory picture of the hourly chart where the MACD Histogram is bullish but the price trades below the dynamic VWAP. Therefore, investors should spend some time to find a breakout before taking any trading decisions.
As the current price is below the dynamic VWAP, a bearish H1 candle below the 1.2410 would increase the selling pressure towards the 1.2300 area. On the other hand, a bullish H1 close above the dynamic 20 EMA needs more confirmation from the H4 chart before opening a buy trade.
As per the current market context, GBPCHF is more likely to show a price direction from the 1.2550 level. Any sign of a trendline breakout would complete the inverse head and shoulder pattern that might eliminate the existing bearish trend. On the other hand, any selling opportunity in the lower timeframe would provide higher return trades.