
Published: April 19th, 2022
The March employment report showed a tightening labor market in the UK while the claimant count change came lower to -46.9K. Moreover, the ILO unemployment dropped to 3.8%, while average wages are rigging due to the skill shortage. The CPI number showed that the UK inflation is at the 30 year high, increasing to the headline number at 7% yearly against the 6.7% expectation. The main reason behind the higher inflation is the surge in gas and electricity prices.
On the other hand, the Reserve Bank of Australia showed a hawkish tone in this week's meeting minutes, where the RBA indicated a growth in the economy from the pandemic level. However, several negative results from China, except for the recent upbeat result in GDP, are the main reason for the AUD’s weakness. As a result, GBPAUD bulls regained the momentum from the recent 2000 pips bearish rally with an inverse head and shoulder formation and a neckline break. As a result, bulls are likely to extend the recovery by testing the 1.8900 psychological level in the coming days.
Let’s see the upcoming price direction from the GBPAUD technical analysis:
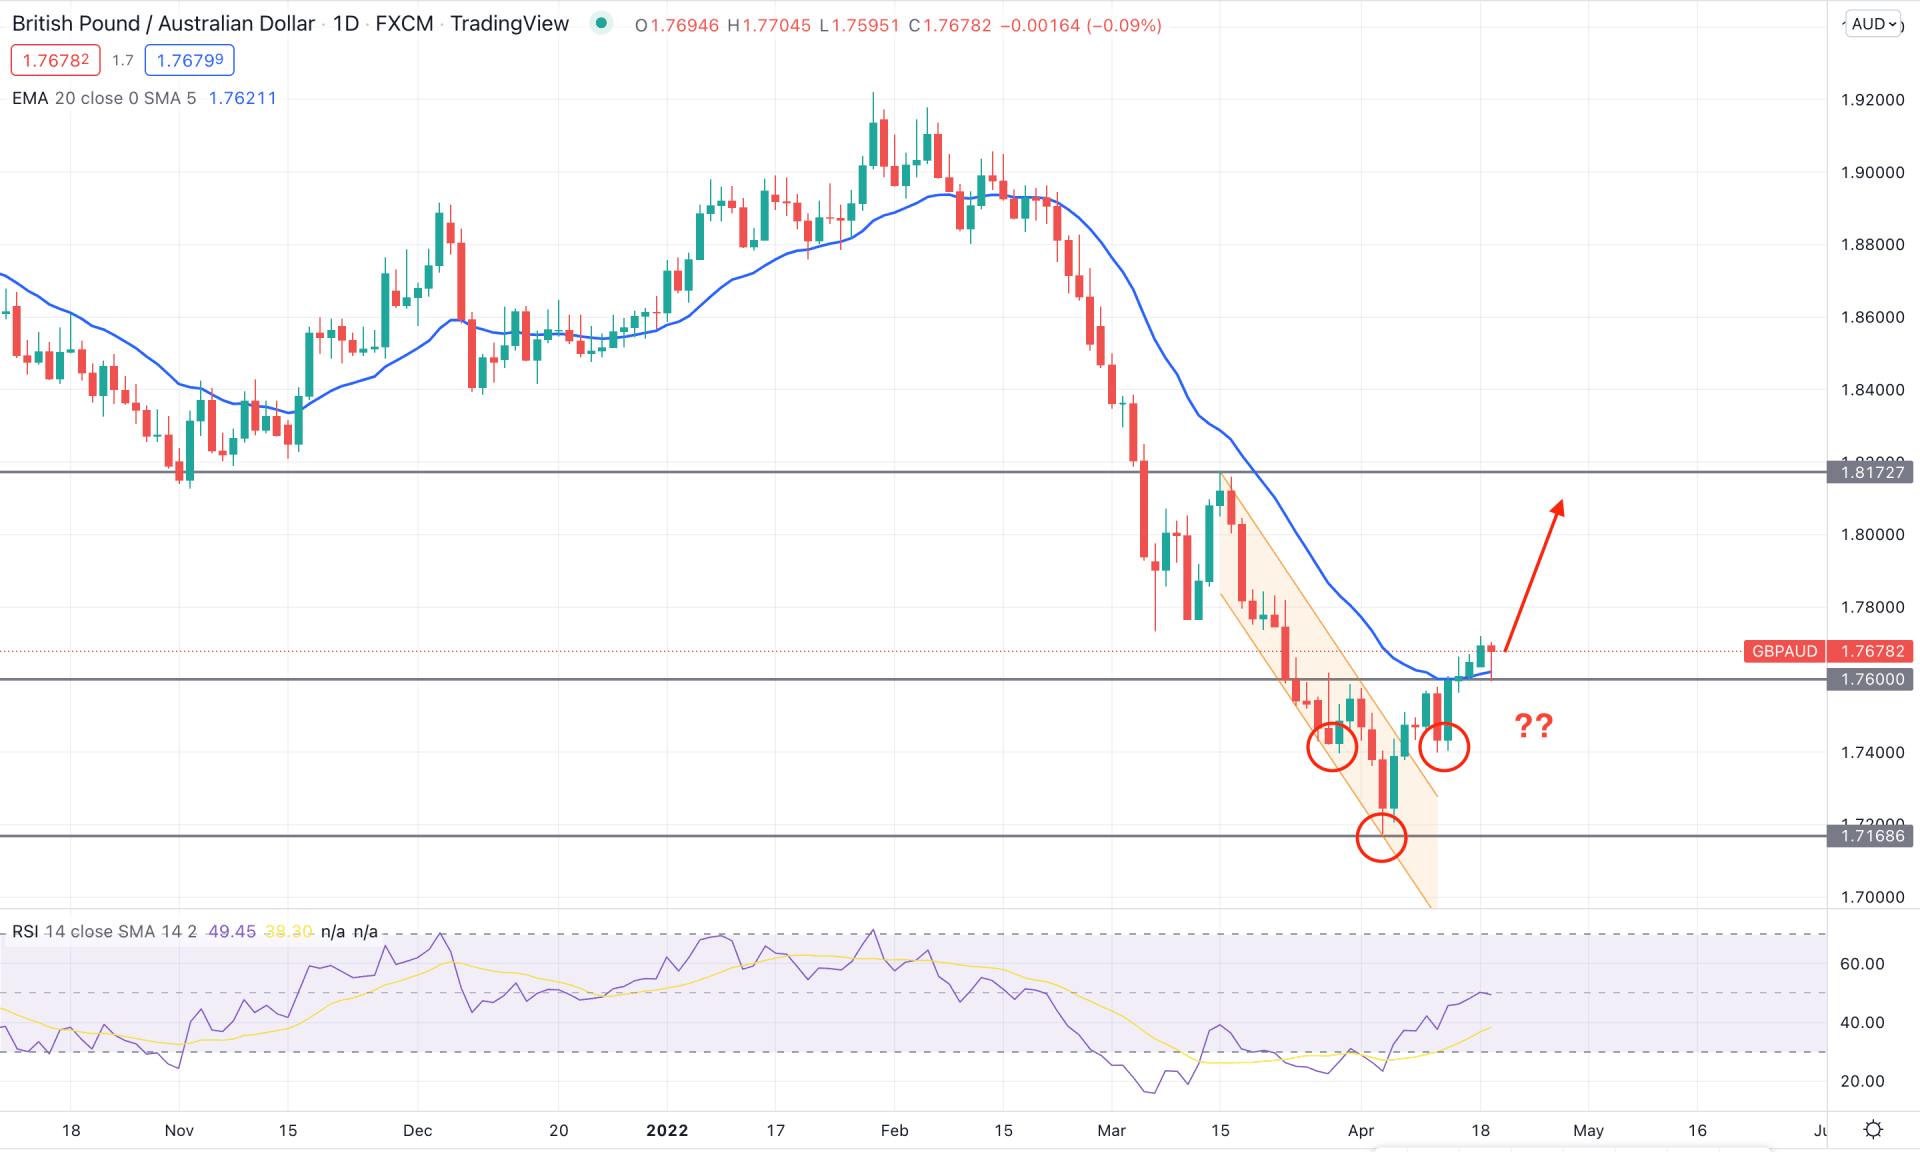
In the GBPAUD daily chart, the selling pressure from January 2022 high to April 2022 low became questionable from the bearish channel breakout that pushed the price beyond the dynamic 20 EMA. Moreover, the inverse head and shoulder formation in the recent chart with a neckline breakout increases the possibility of the bullish reversal. Moreover, in the weekly chart, the RSI level reached the overbought 30 levels and rebounded higher with multiple bullish rejection candlestick formations.
The above image shows how the price showed the neckline breakout and retested the 1.7800 support level before aiming higher. Meanwhile, the RSI level rebounded and reached the neutral 50 level, where a further stable position above it will increase the possibility of testing the overbought 70 level.
Based on the daily price structure, the recent inverse head and shoulder formation and neckline breakout is the primary sign of a bullish trend reversal where the aim is to test the 1.8172 resistance level. However, the major trend is still bearish, where any violation of the 1.7600 neckline would resume the current bearish trend. In that case, the main aim is to test the near-term swing low of 1.7168 level in the coming days.
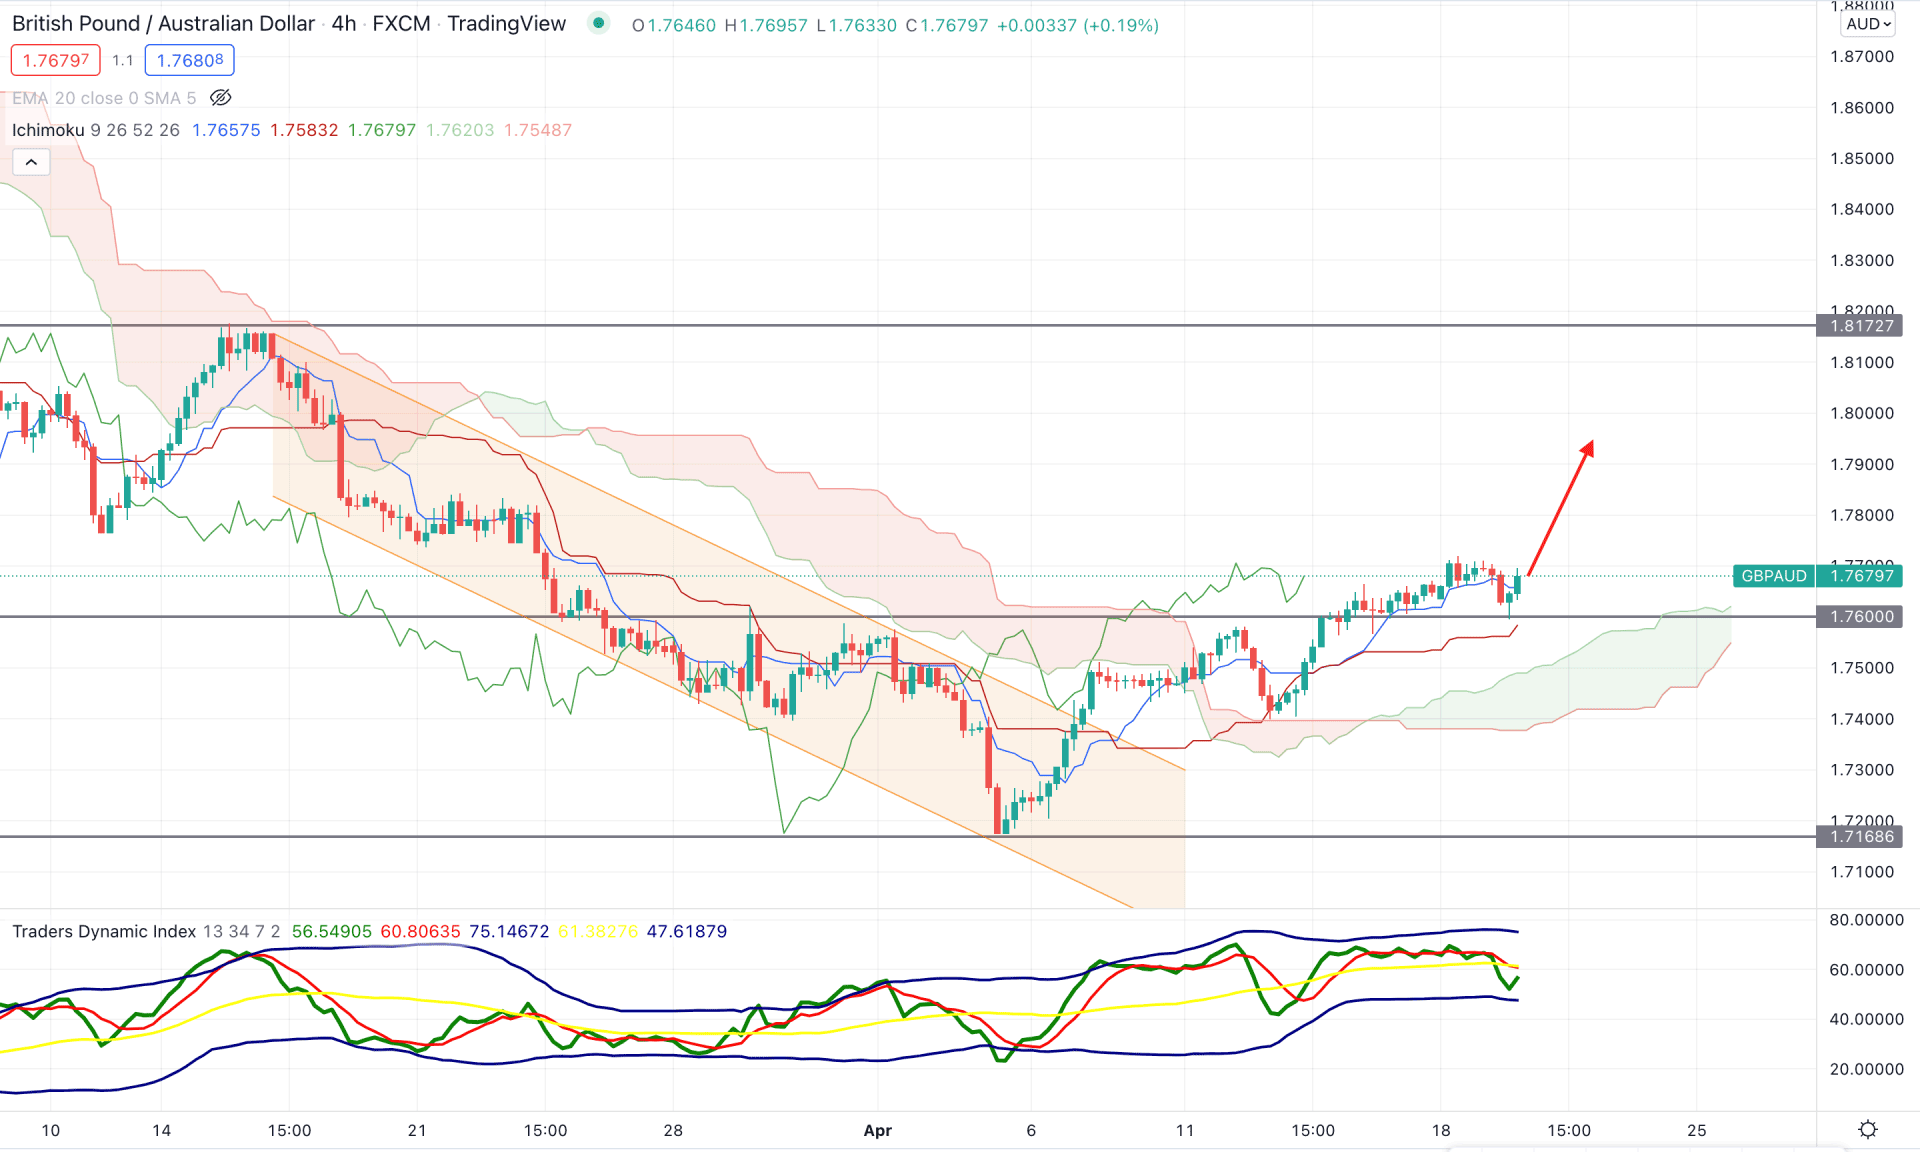
According to the Ichimoku Cloud, the recent price formed a bearish channel breakout before aiming higher to the Kumo Cloud with a V-shape recovery. As a result, the future cloud turned bullish, and Senkou Span A started to move higher from the Senkou Span B, indicating a strong bullishness to the price. Moreover, the price increased above the 1.7600 key support level and held the position above it for more than 2-3 trading days. Therefore, as bears showed no interest in taking an immediate rebound in the price, it may make another swing higher before showing any bearish correction.
The Traders' Dynamic Index, which measures the strength of bulls or bears, did not reach the upper band before moving lower to the 50 level. It is a sign that an upside pressure is pending in the chart where any rebound in the TDI line above the 50 level would indicate an increased buyers activity. Meanwhile, the dynamic Tenkan Sen and Kijun Sen are working as minor support to the price where any bullish rejection from these levels would be a potential buying point in this pair.
Based on the current structure, an upside pressure is likely to happen as long as bulls hold the price above the 1.7600 static support level. On the other hand, the break below the 1.7500 level would increase the selling possibility toward the 1.768 level in the coming days.
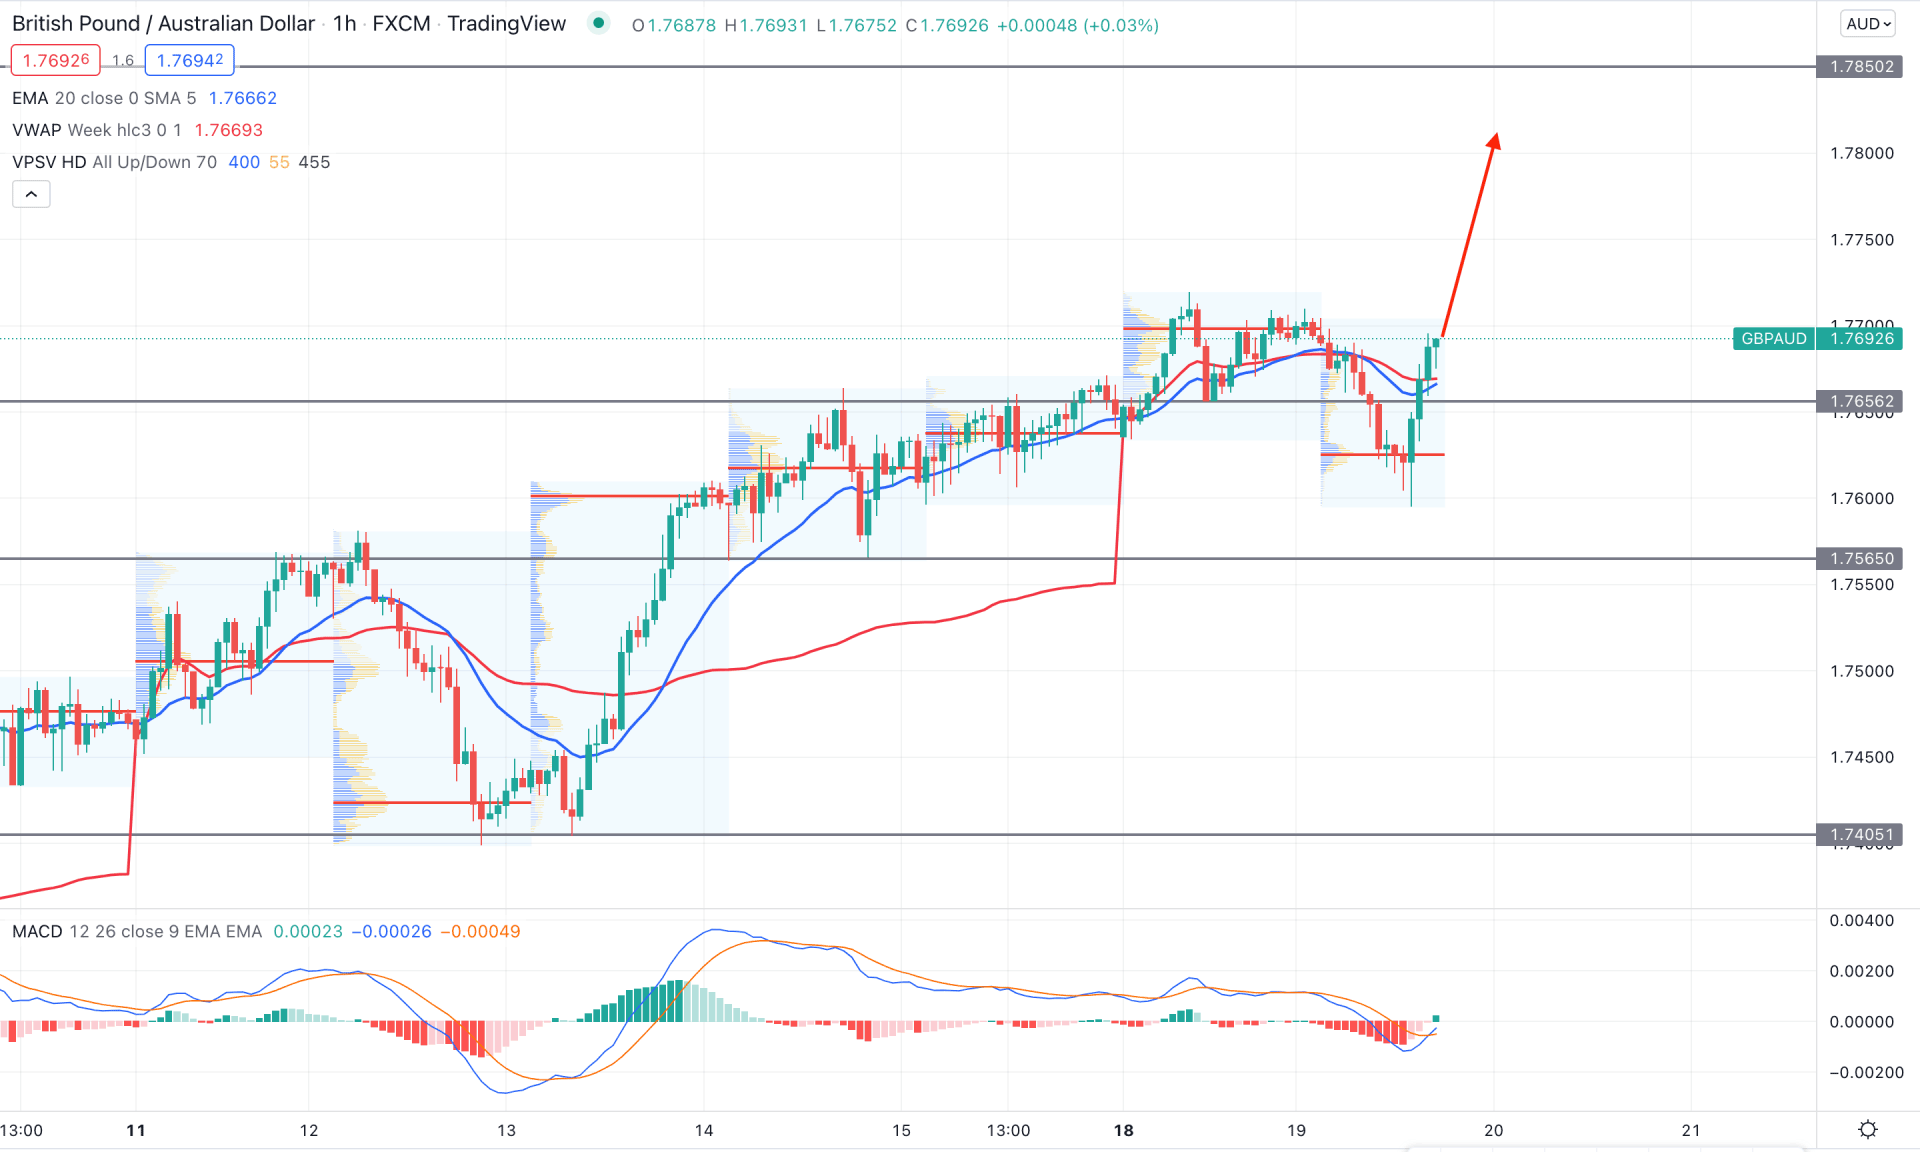
GBPAUD is trending up where the most recent high volume level is at 1.7624, from where an intense buying pressure came. Moreover, the buying pressure came with an impulsive momentum that took the price above the dynamic 20 EMA. Investors may consider the upcoming price pressure as bullish as long as it trades above the 1.7600 static support level.
The above image shows how the MACD Histogram turned bullish with a crossover in the MACD line. Investors may consider the upcoming price pressure as bullish until it breaks below the 1.7565 level with a bearish H1 close based on the intraday structure. The alternative approach is to open a short position after finding the bearish H1 close below the 1.7565 level towards the target of 1.7400 level.
Based on the current multi-timeframe analysis, GBPAUD has a higher possibility of extending the buying pressure in the coming days. In that case, the primary aim is to test the 1.7850 resistance level. However, investors should remain cautious about the broader market direction, which is still bearish. Any rebound in the price and daily candle below the 1.7565 would increase the selling possibility in the coming days.