
Published: April 13th, 2020
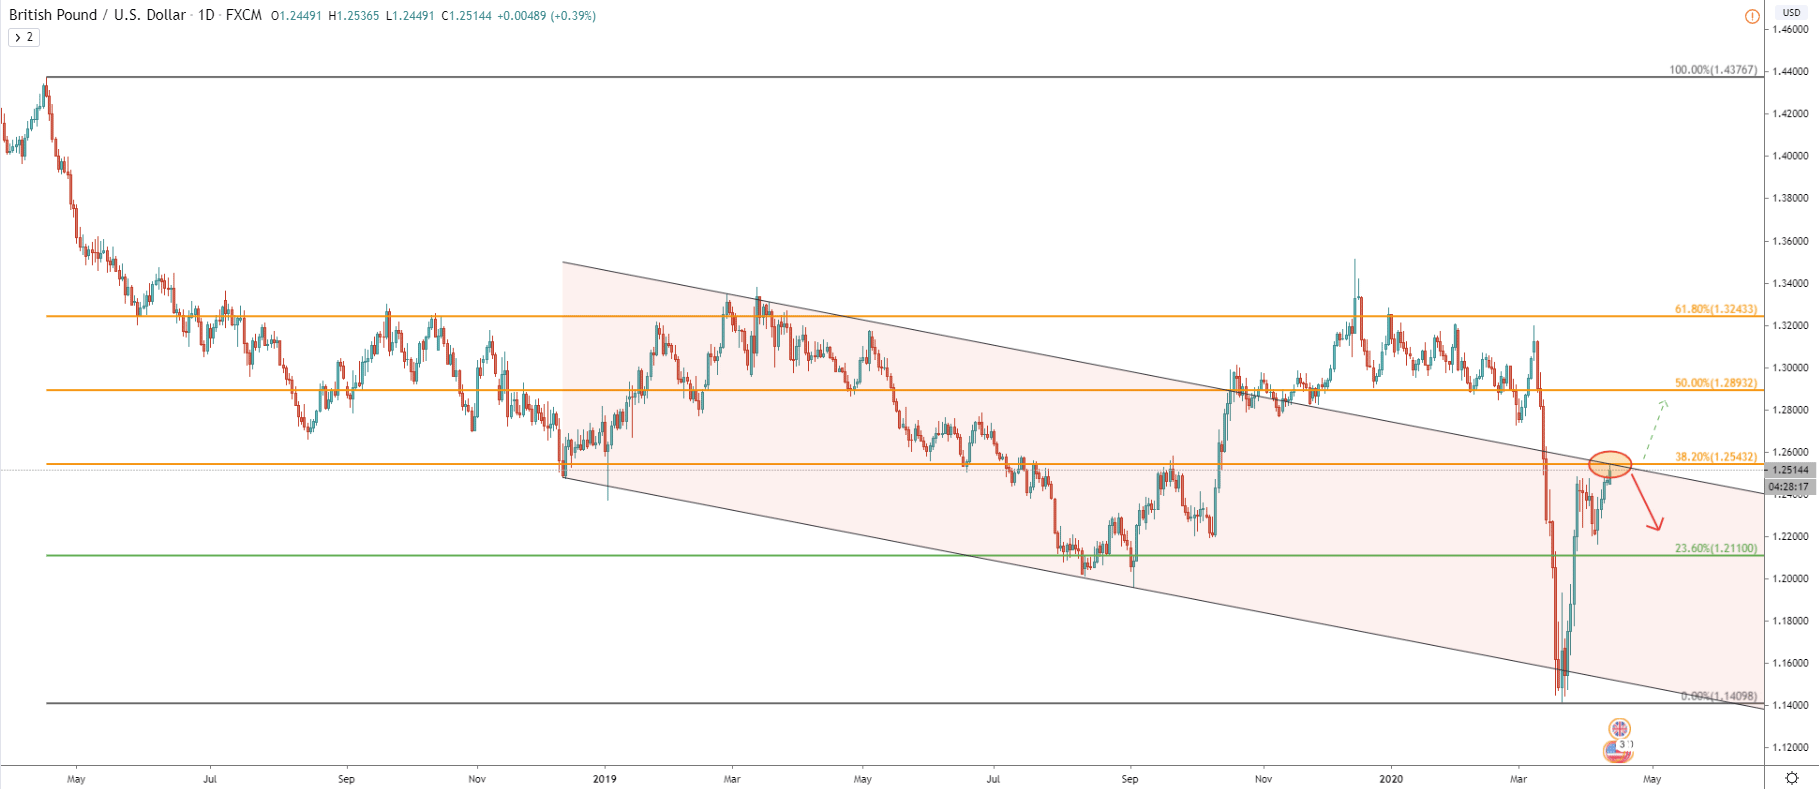
The daily chart shows that the pair has reached a critical resistance level today while hitting 38.2% Fibonacci retracement level at 1.2543. The Fibonacci resistance has been rejected along with the upper trendline of the descending channel. This is the important timing for the GBP/USD because soon we are likely to see where the price is most likely to move this week. Currently, the resistance is being rejected and daily closing price will show whether bears are still in control. Therefore, if daily close will remain below the resistance, GBP/USD should be expected to go south, on the other hand, if daily close will be above, price is likely to move north. The downside target is seen at 1.2100, which is 23.6% Fibs, and the upside target is seen at 1.2893, which is the 50% Fibs.
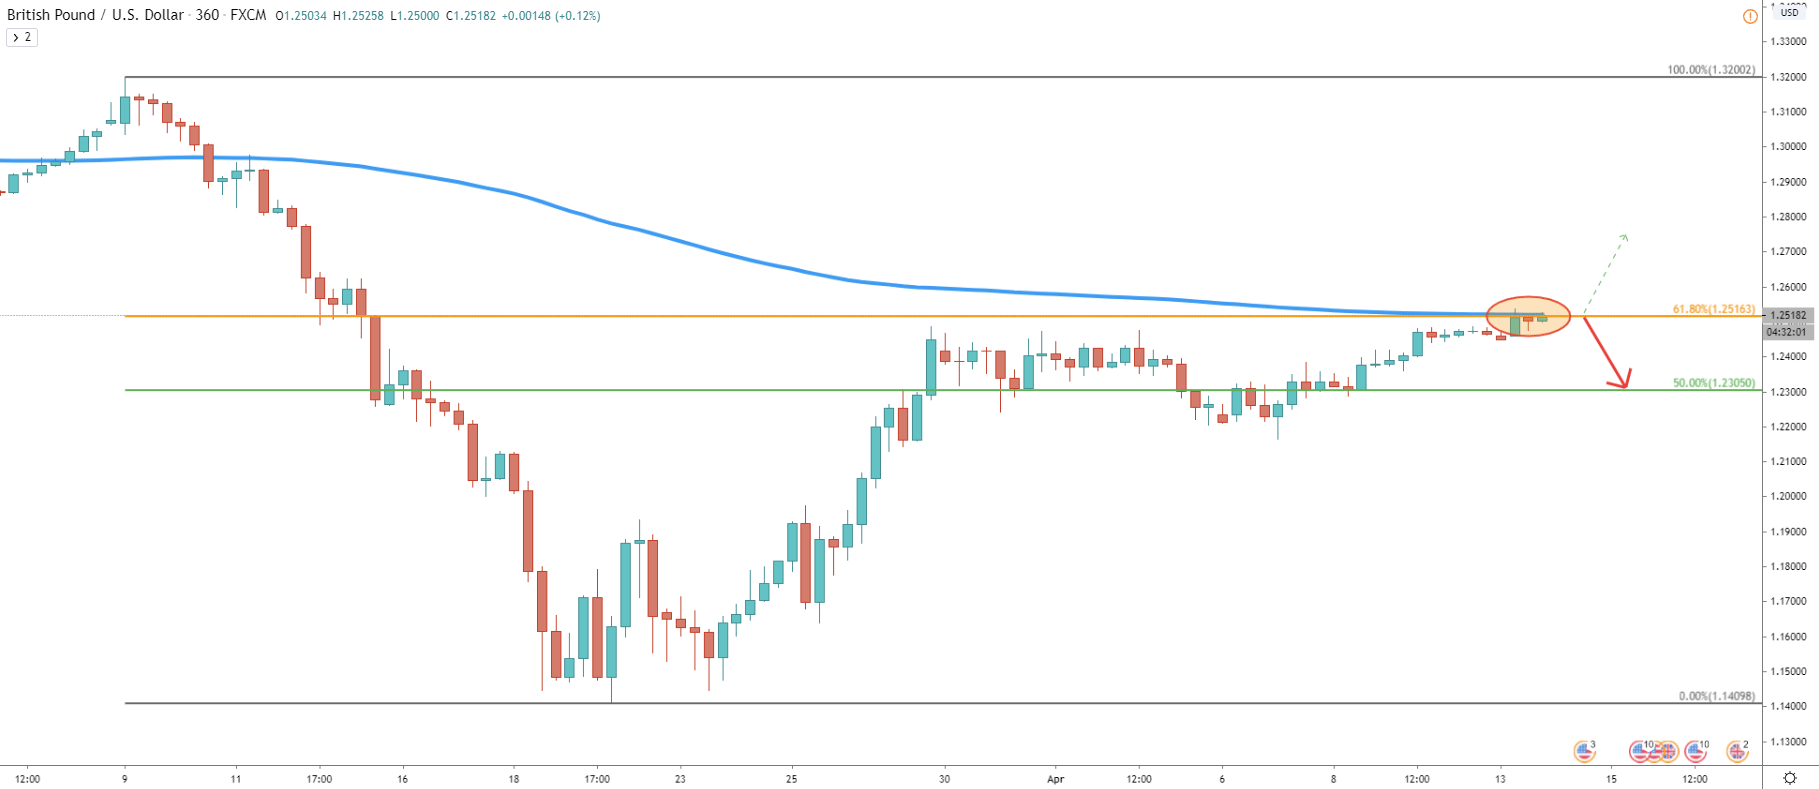
Here we see that price has reached and rejected the 200 EMA and at the same time closed below the 61.8% Fibonacci retracement level. Once again, it makes 1.2500 -1.2540 a key resistance area in the medium and even long term. Still, it seems that the probability of the downtrend remains more attractive as the price should least test the nearest support level at 1.2305 that is 50% Fibs.
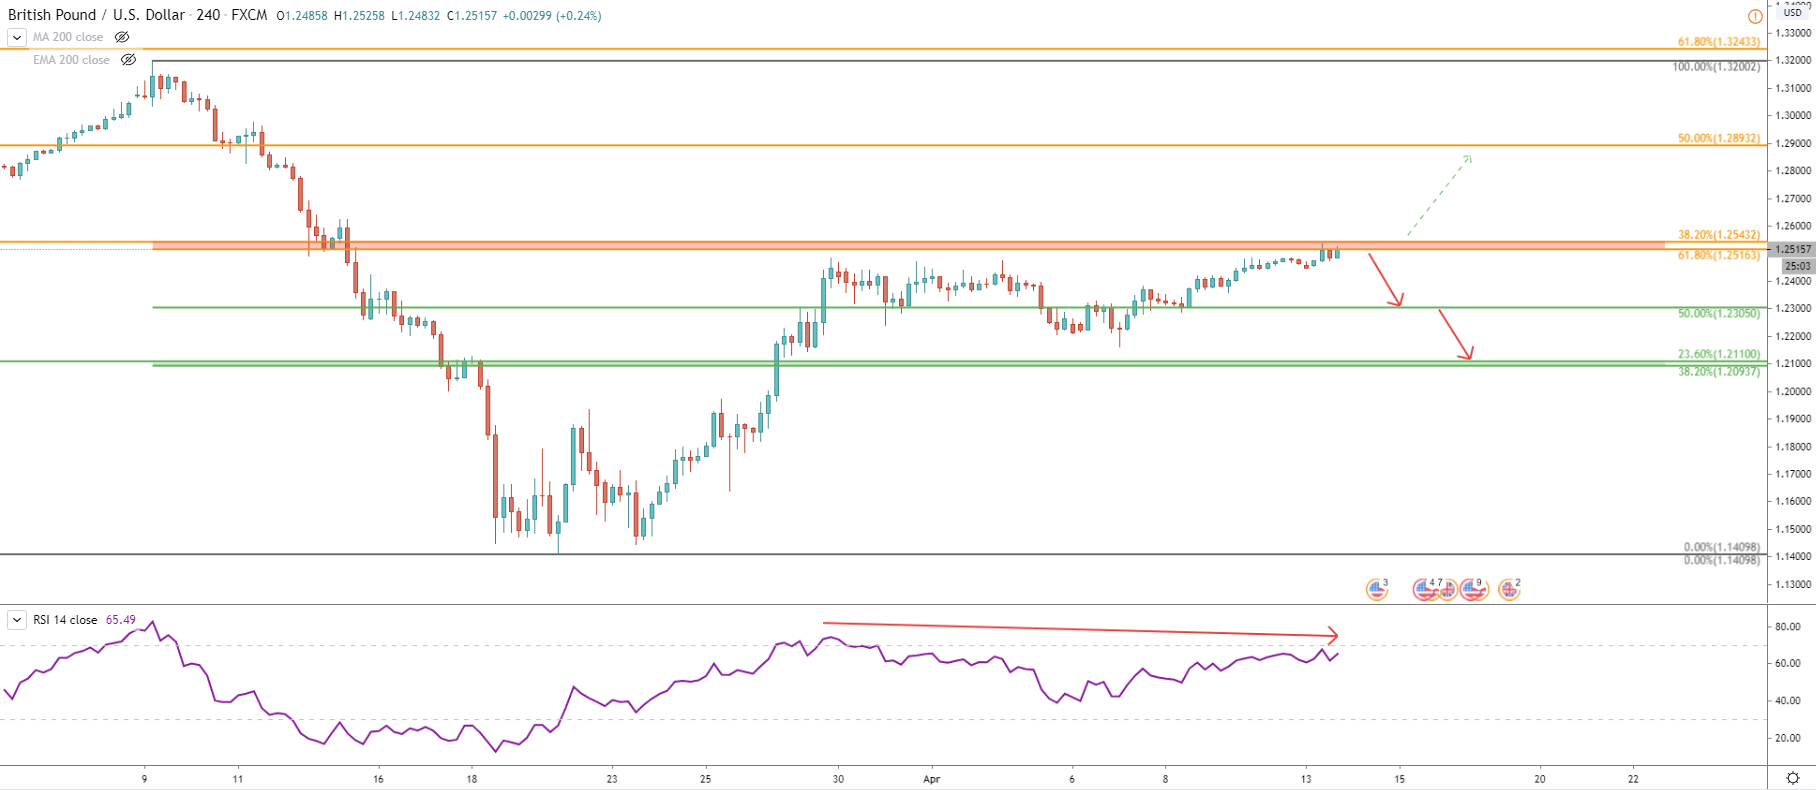
Here comes the 4H chart with more Fibonacci levels, combined from the previous two charts. We can see more cleanly the resistance area between 1.2516 and 1.2543, which is formed by 61.8% and 38.2% Fibs. At the same time, we can witness a bearish divergence formed by the RSI oscillator, suggesting the potential wave to the downside.
As per Fibs, there are two support levels to watch, first and nearest is at 1.2305, which is also corresponds to the psychological support level at 1.2300. The second and most important support area is between 1.2094 and 1.21100. This price zone also corresponds to the psychological support at 1.2100. Overall, a potential decline of either 200 or 400 pips can be expected in the very near future.
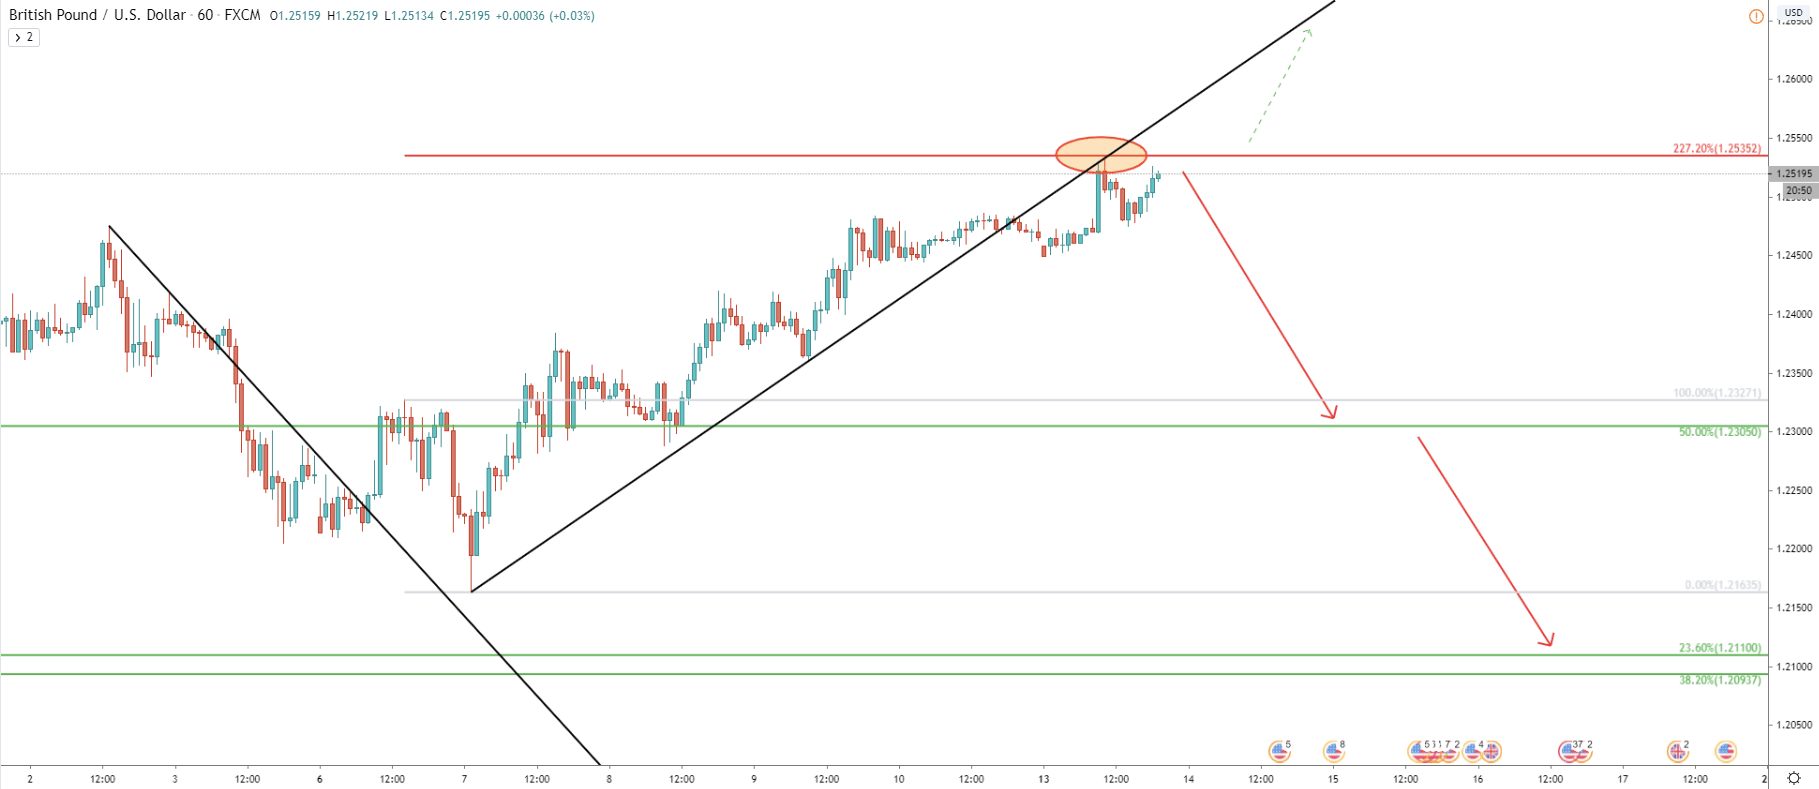
On the 1H chart, the price has reached and rejected the uptrend trendline, which first acted as the support but currently acting as the resistance. At the same time, 227.2% Fibonacci retracement level at 1.2535 has been rejected cleanly, once again proving the importance of current resistance area.
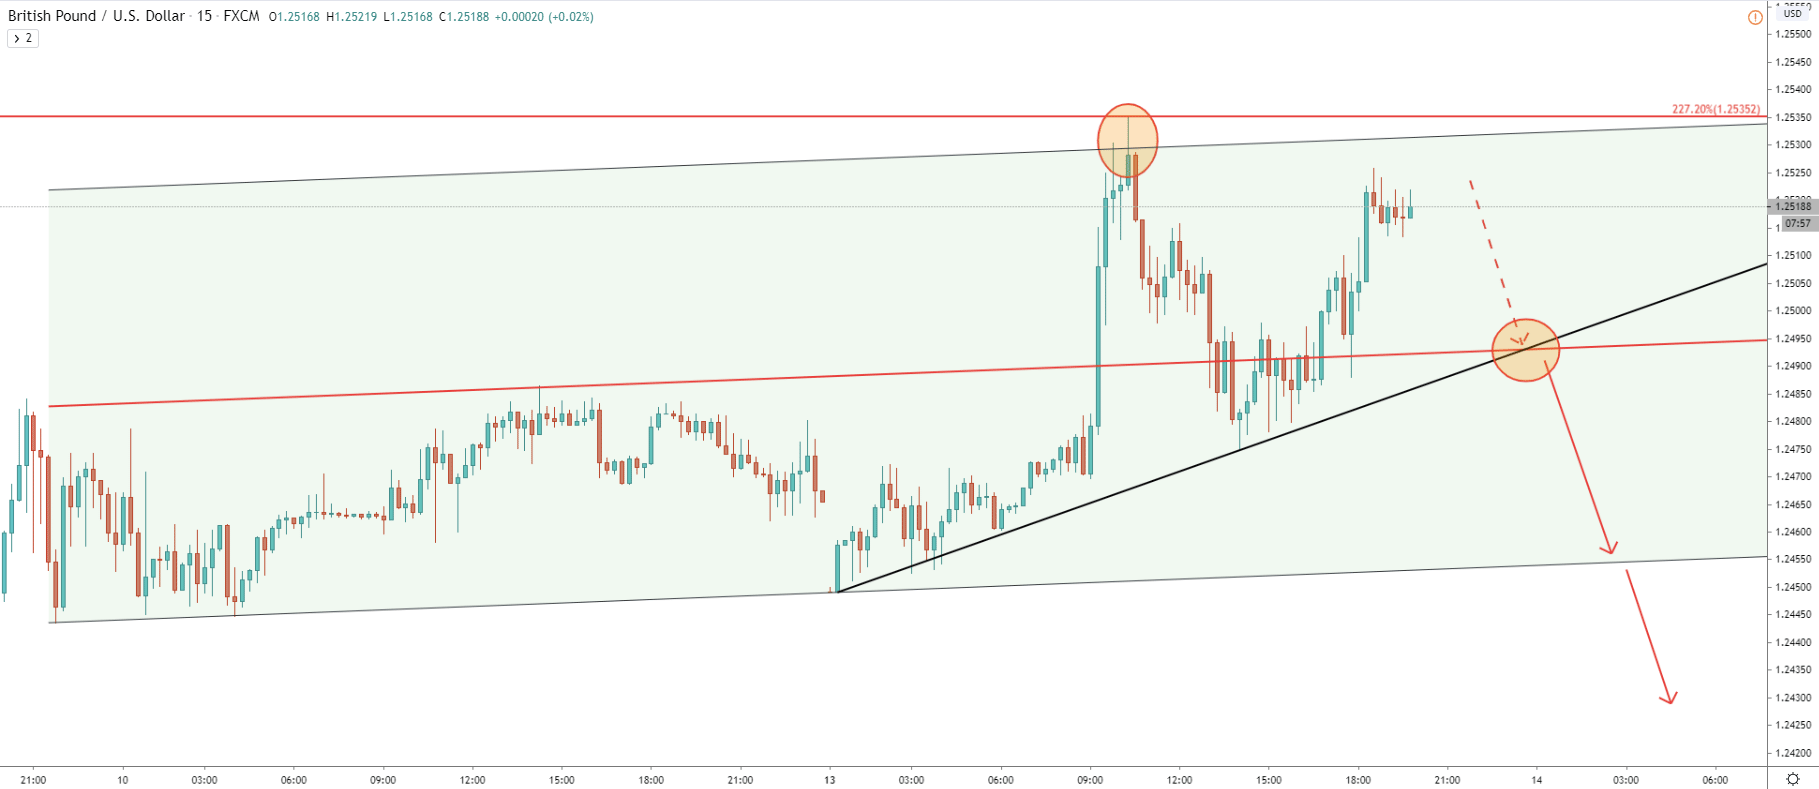
On the 15M chart, the price has reached the top of the ascending channel and did reject it. It seems that the best thing to do right now is to monitor lower timeframes in general and 15M chart in particular for the break and close below the uptrend trendline. Such price action could be treated as a confirmation of bear domination, resulting in a steep price drop over the course of the next 48 hours.
GBP/USD is currently trading at the key resistance area, which plays a very important role in further price development. As long as the daily close will remain below the 1.2535 level, GBP/USD will start taking on board more and more sellers. This eventually will provide a strong downside pressure.
As per the 4h chart, there are only two major support levels and the downside targets. The first is at 1.2305 and the second is at 1.2110. This makes it either a 200 or a 400 pips potential downside move.
As long as resistance at 1.2535 holds there will be more selling going on, but as soon as we’ll see a daily break and close above this price, it should immediately attract more buyers. At this stage, volatility is expected to increase substantially and GBP/USD is very likely to establish a long term uptrend.
Support: 1.2305, 2.2110, 1.2094
Resistance: 1.2535