
Published: November 10th, 2020
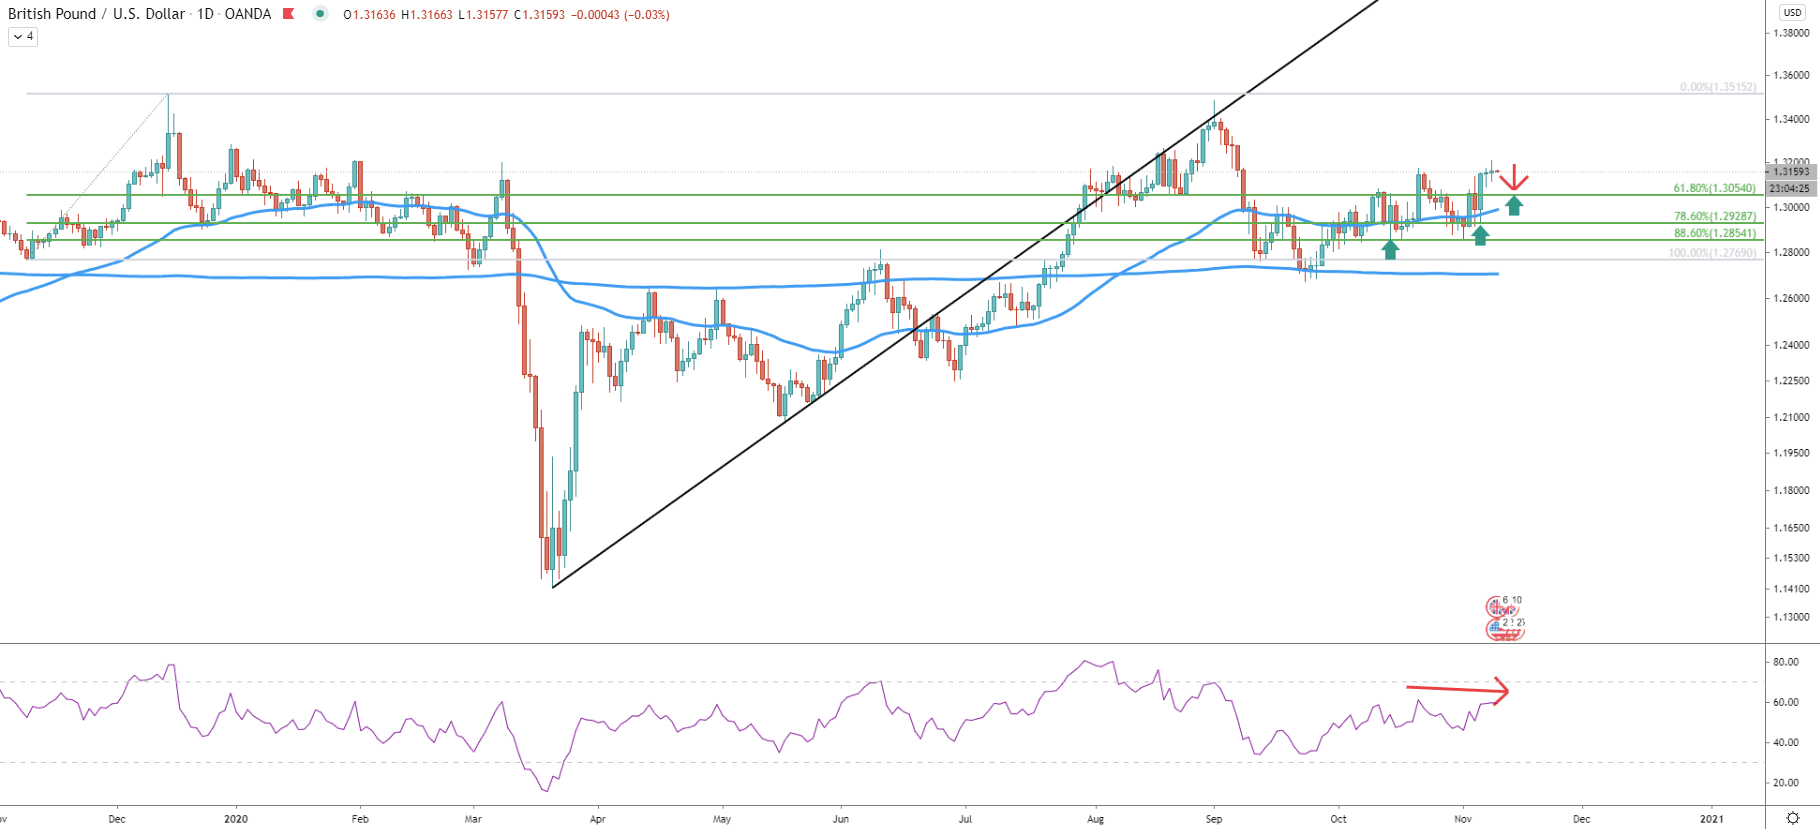
On March 19, GBP/USD tested 1.3515, which was the 540-days high, making it a very important resistance level. Therefore, the Fibonacci retracement indicator was applied to the last wave up, prior to the price hitting 1.3515. It can be seen that during the past two months, retracement levels from that Fibonacci indicator played an important role.
In October, the price has bounced cleanly off the 88.6% Fib support, which is located at 1.2854. Then the price went up and on yet another pullback rejected the 78.6% Fibs at 1.2928. This is quite a common tendency before price moves up strongly. And considering that the 200 EMA has been rejected on the daily timeframe, the long term trend remains strongly bullish.
Nonetheless, yet another pullback towards the 61.8% Fibs at 1.3054 can be expected prior to the uptrend continuation. This support level is also confirmed by the 50 Exponential Moving Average, which is likely to be tested if GBP/USD will correct down once again. Speaking of the potential correction, it is supported by the rejection of the uptrend trendline as well as the formation of the bearish divergence by the RSI oscillator.
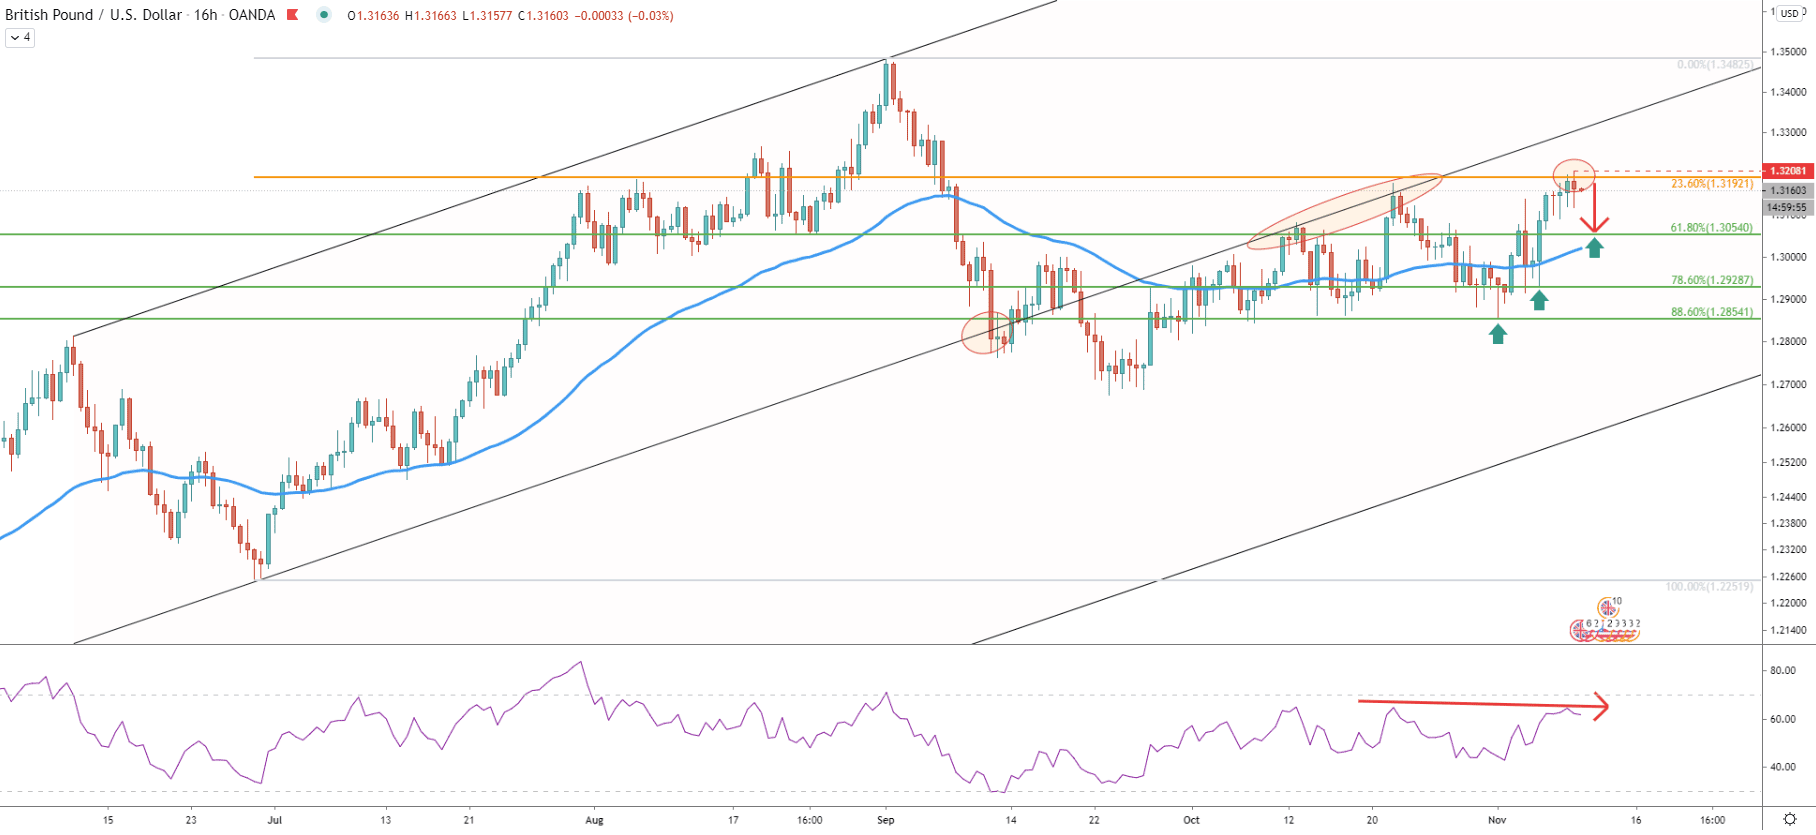
The ascending channel has been broken and GBP/USD tested the 1.2675 low on September 23. But then the price went up towards the 1.3200 psychological resistance, where it rejected the 23.6% Fibs applied to the last wave up before the pair tested 1.3482 high. At the same time, while correcting up, GBP/USD twice rejected the lower trendline of the descending channel, which clearly has been acting as the resistance. And Finally, today RSI has formed a bearish divergence, which has also been formed on the daily chart.
Fibonacci retracement indicator was applied to the downside move which took place in September. It shows that 61.8% Fibs at 1.3174 have been rejected. And the most recent price action shows that the double top has been formed because there was no daily close above the 1.3174 resistance. Besides, the resistance uptrend trendline has been rejected and another ascending channel has been broken. Not to mention a double bearish divergence formed by the RSI, which makes it already a 3rd bearish divergence.
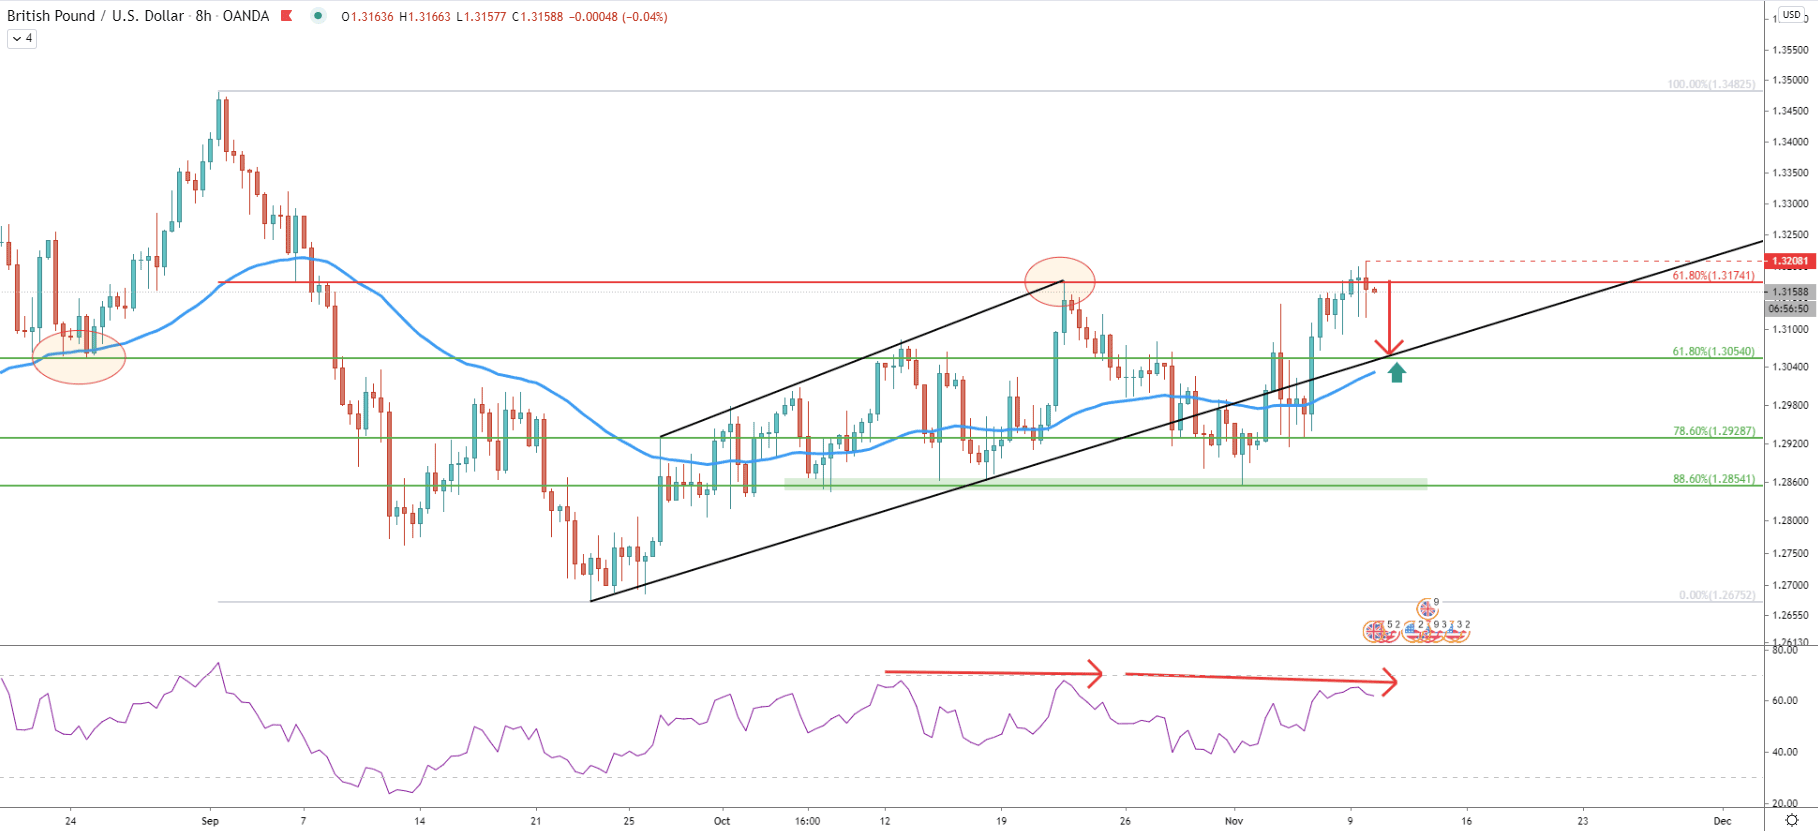
Today GBP/USD tested the 1.3208 high. This could be the critical resistance level because as long as the price remains below, the bearish forecast will continue to be valid. Currently, further decline is still expected, and on this chart, Fibonacci was applied to the previous downside correction prior to the double top formation. It shows that 61.8% Fibs at 1.3054 corresponds exactly to the 61.8% Fibs as per the daily chart. Also, it corresponds to the middle trendline of the ascending channel as well as 50 EMA, making it an extremely strong demand area.
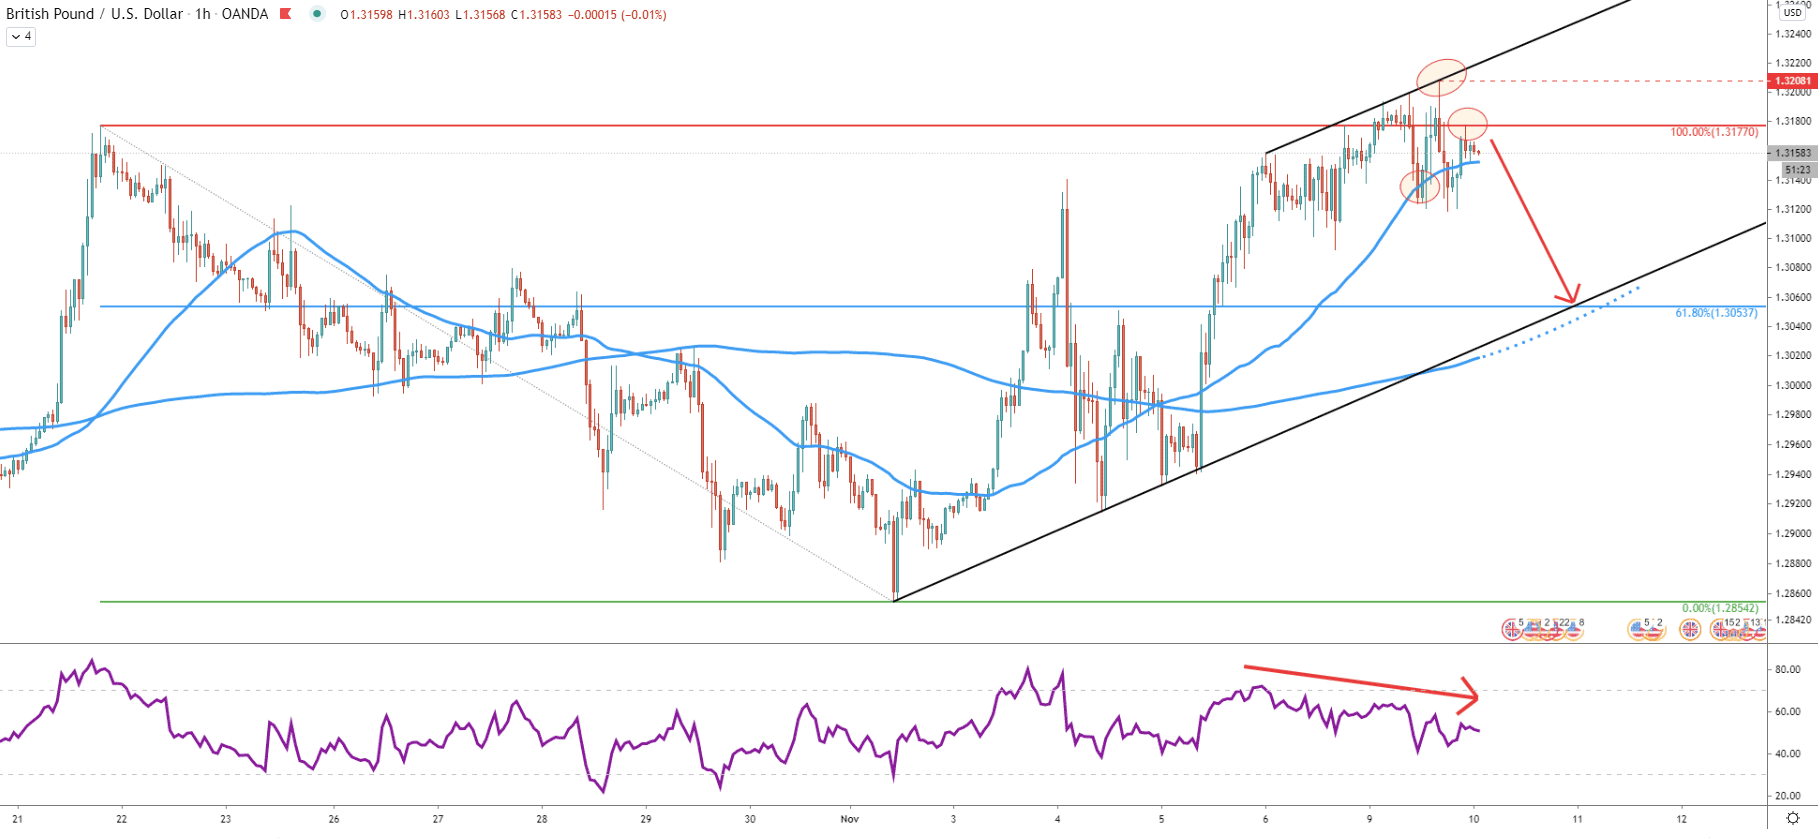
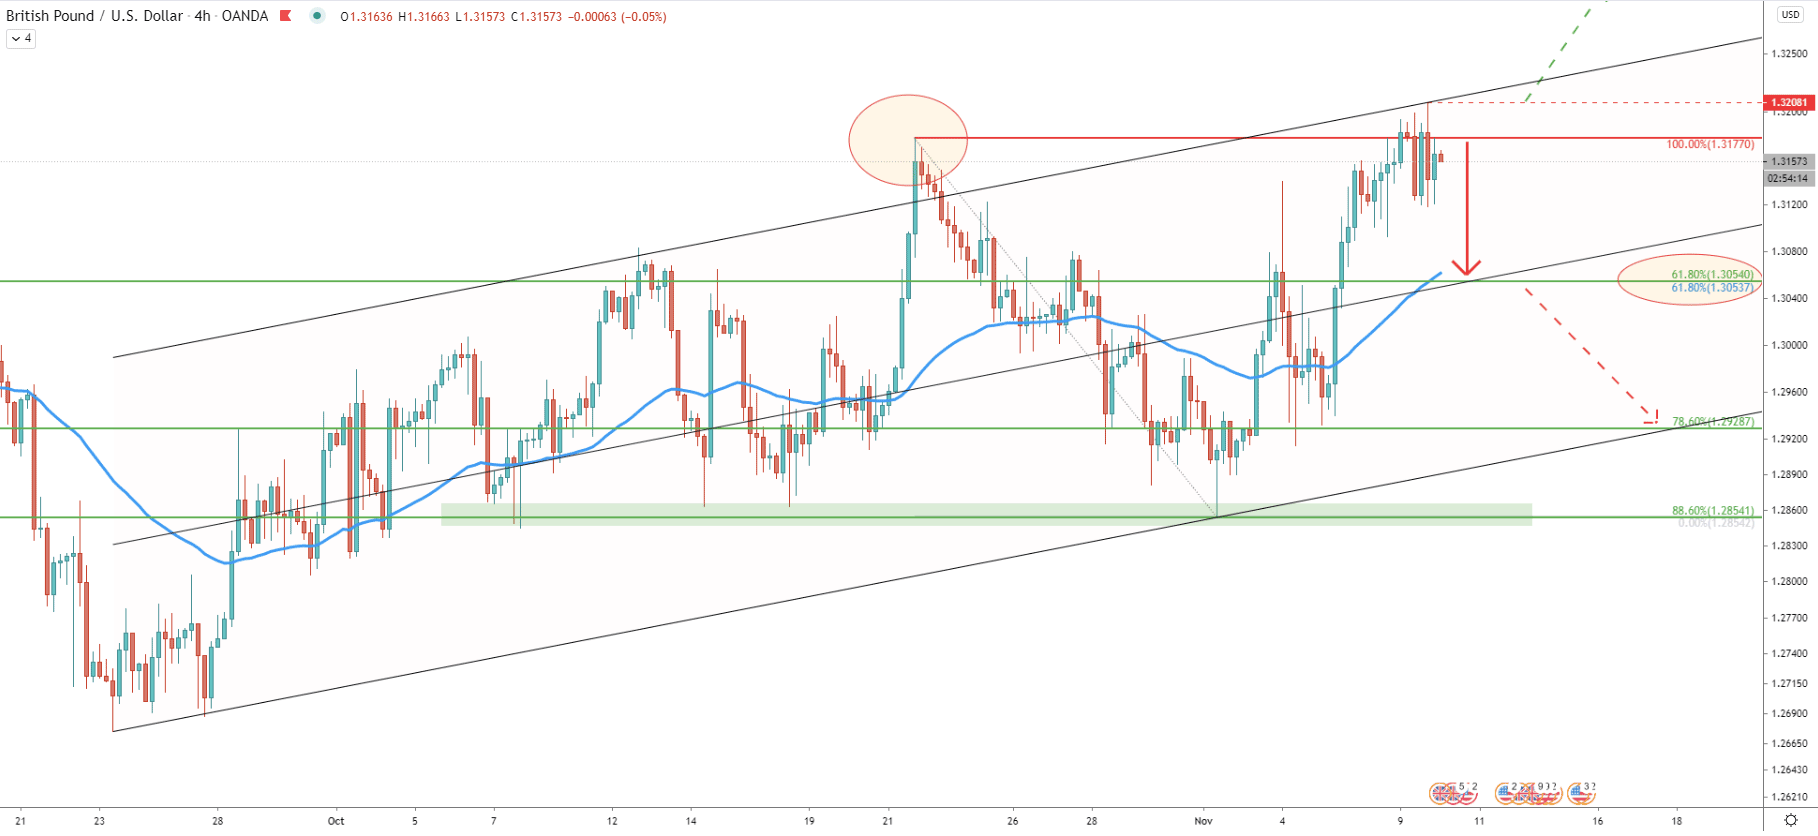
Finally comes an hourly chart, where yet another bearish divergence formation can be witnessed. Almost every timeframe analyzed in this chart shows the bearish divergence, suggesting a strong or increased selling pressure. The resistance trendline has been rejected and today there was a clean bounce off the previously established resistance at 1.3177. Prior to that, GBP/USD broke below the 50 Exponential Moving Average and it certainly looks like the beginning of a downside move. On this chart, the target corresponds to the simple uptrend treeline as well as the 200 EMA.
The bearish divergence has been formed on multiple timeframes while the pair has produced a double top near the cryptical psychological level at 1.3200. The 50 EMA has been broken on the hourly chart, suggesting that this might be a fast move to the downside of around 100 pips.
As per the daily and 4-hour chart, the key support is located at 1.3054 and confirmed by 2 Fibonacci retracement levels as well as 2 x 200 EMAs, uptrend trendline, and the middle trendline of the ascending channel.
Only a break above the recently printed high at 1.3208 will immediately invalidate the bearish forecast. In this scenario the uptrend will continue with a high probability, potentially pushing the price up to the next psychological level at 1.3300.
Support: 1.3118, 1.3054
Resistance: 1.3177, 1.3208