
Published: November 2nd, 2020
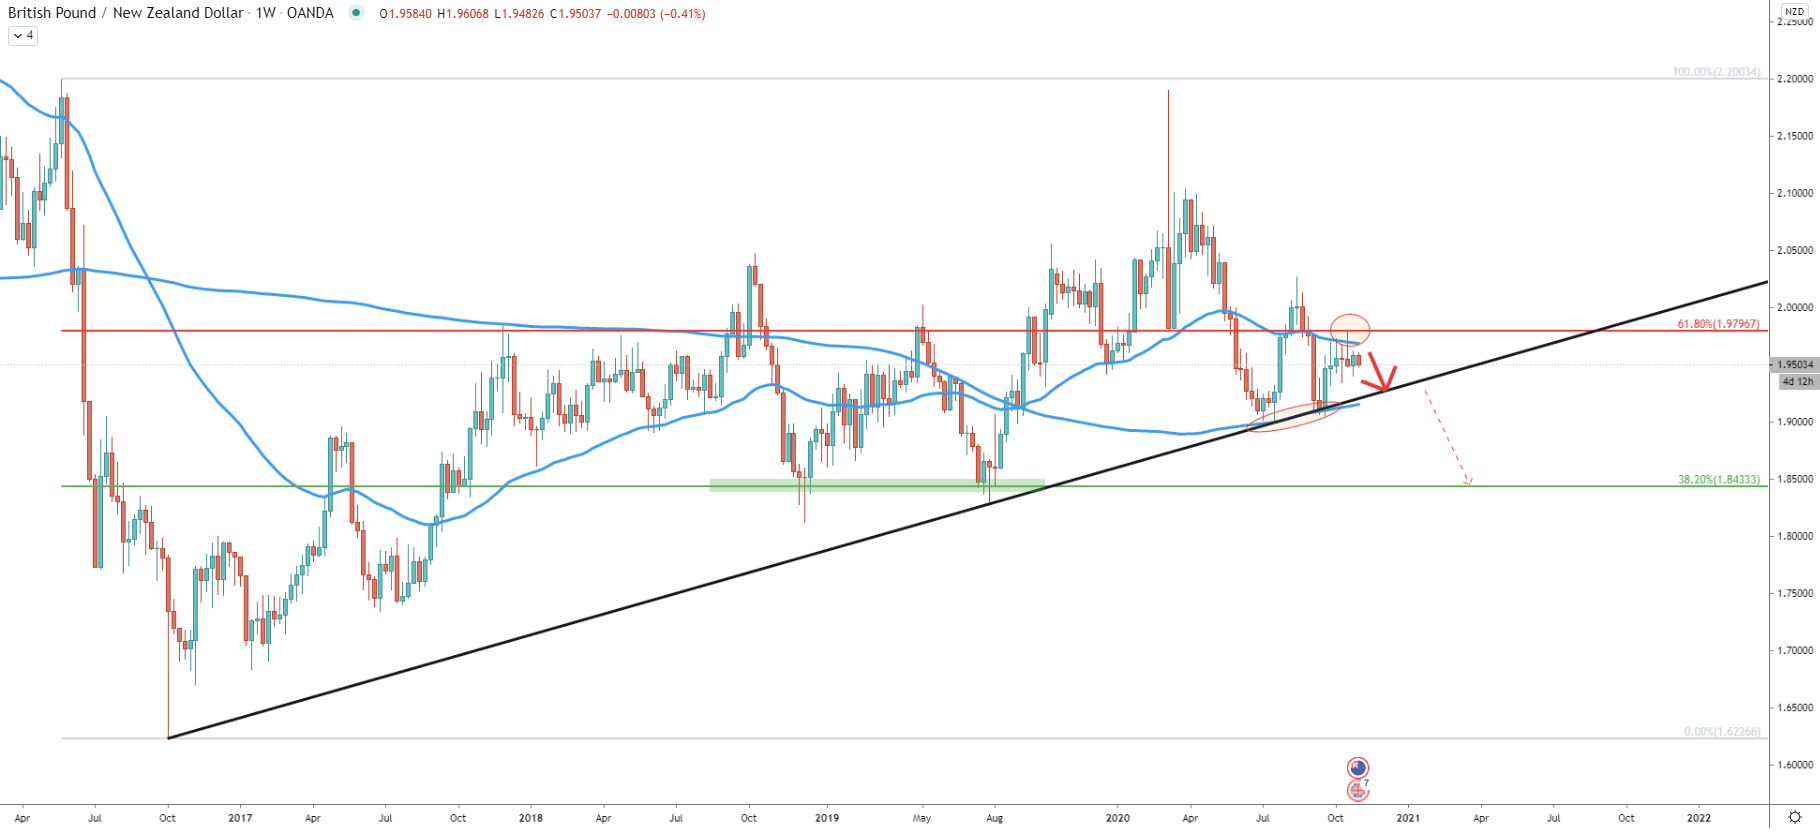
The weekly chart shows that GBP/NZD has been stuck between support and resistance for the past 3 months. The resistance is presented by a 61.8% Fibonacci retracement level at 1.9796, which was rejected cleanly a couple of weeks ago. At the same time, the 50 Exponential Moving Average has been rejected throughout the past 6 weeks, making 1.9800 a key psychological as well as technical supply zone.
In regards to the support, it has been confirmed by the simple uptrend trendline, which got rejected twice already. Along with it, the 200 Exponential Moving Average was also respected while the price failed to close below. Overall, GBP/NZD has been trapped between two Moving Averages and currently remains on the top of the range. This might result in an increased selling pressure throughout this week, resulting in the price drop towards the uptrend trendline and 200 EMA support area.
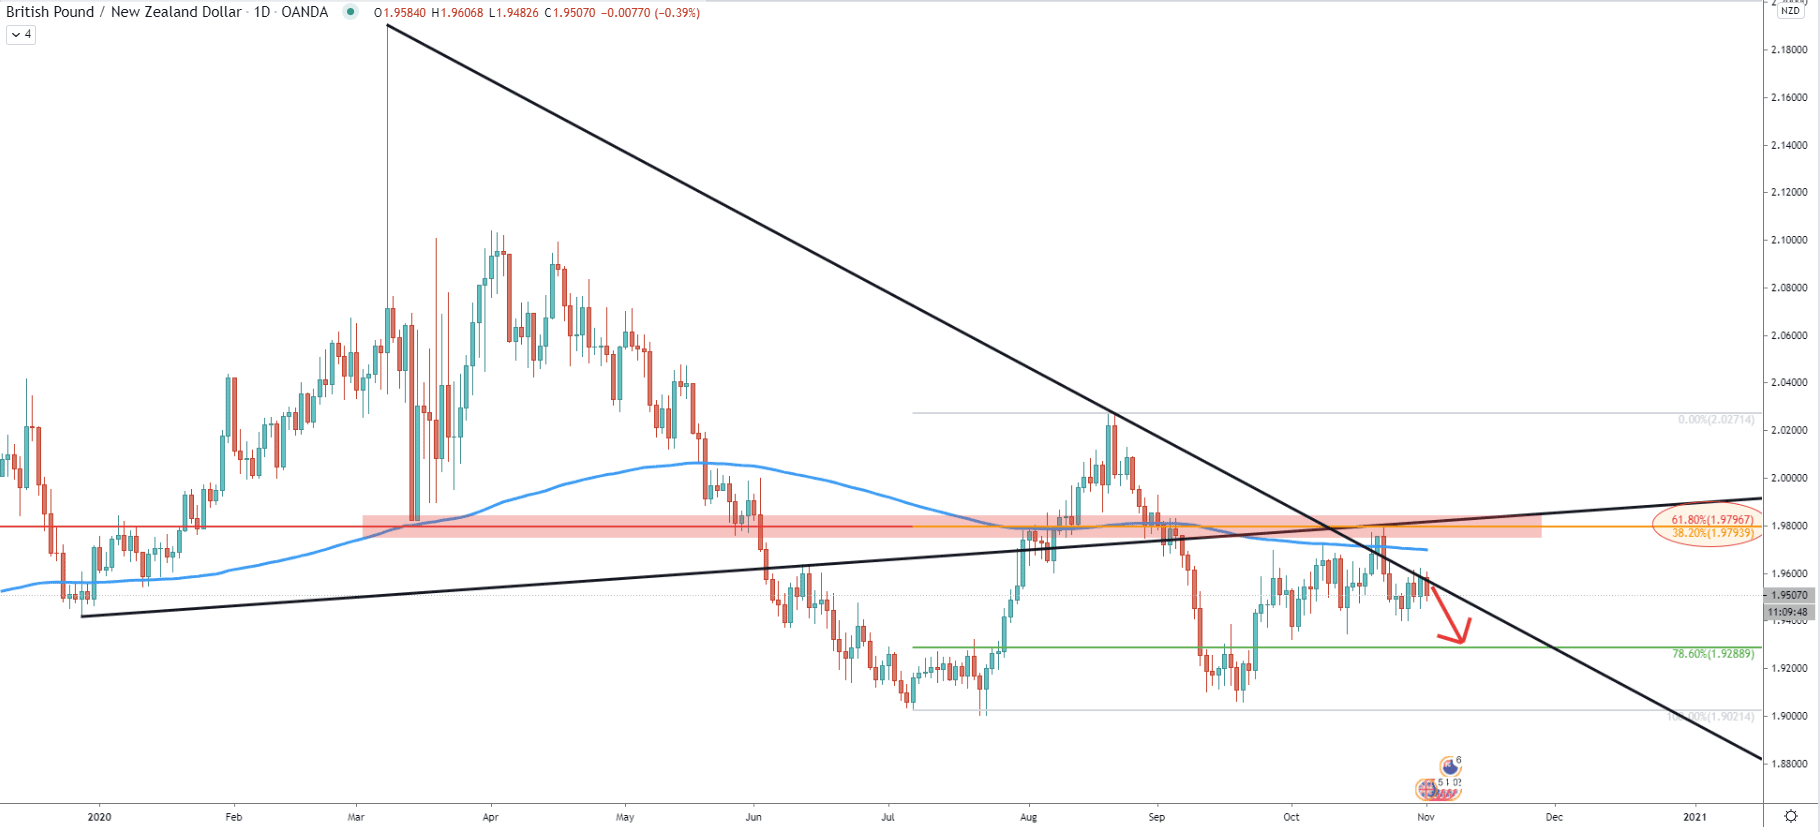
On the daily timeframe, GBP/NZD rejected the average-price uptrend trendline as well as the simple trendline and the 200 EMA on October 22. Besides, it has rejected previously discussed Fibs along with the 38.2% Fib at 1.9794. This shows that the pair has rejected at least 5 resistance indicators simultaneously, emphasizing the strength of the supply zone.
Based on the Fibonacci retracement indicator applied to the last corrective wave up occurred between July and August, the nearest support could be located at 1.9288, which is 78.6% Fibs. It makes a potential downside move of 200 pips, which might occur as soon as this week.
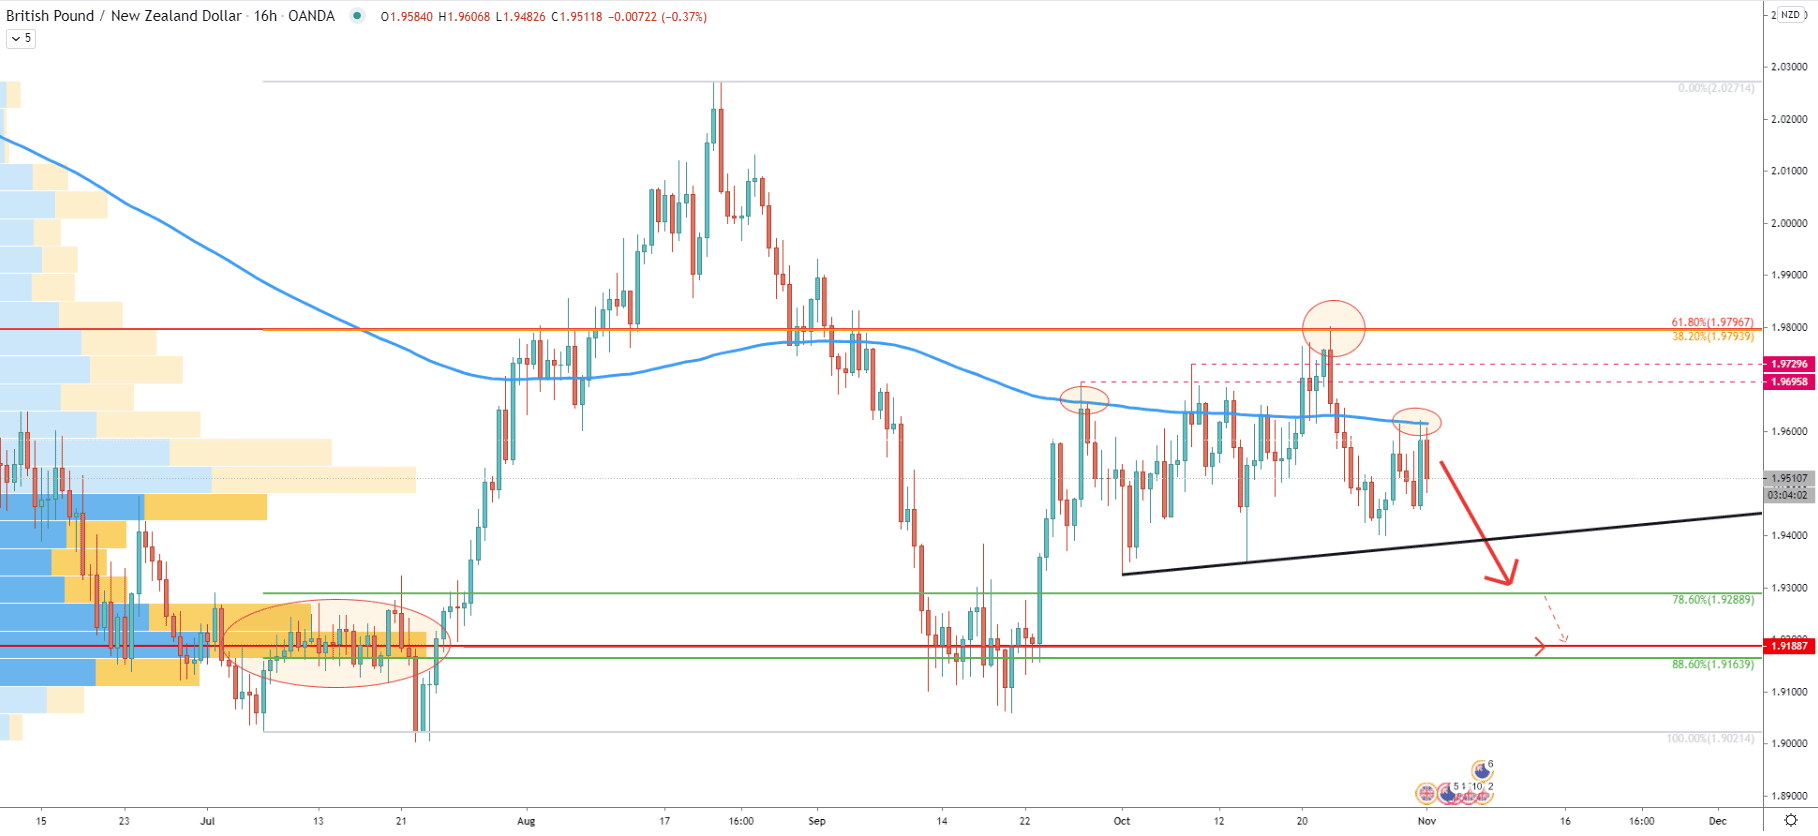
On the 16-hour chart, GBP/NZD price has been rejecting the 200 EMA as well. Price has attempted to produced spikes above, although failed to close above these spikes with confidence. Last week, on Friday, GBP/NZD rejected the 200 EMA yet again, which could have been the end of the consolidation phase started in early October. Besides, the support uptrend trendline hasn’t been tested yet and can be the nearest obstacle for GBP/NZD on the way down.
While the nearest support is seen at 1.9288, if broken, the price can be expected to decline further, potentially towards the 88.6% Fibs at 1.9164. This support area is also confirmed by the Volume Profile indicator, showing that at 1.9188 most trading volume has been recorded based on the visible data on the chart.
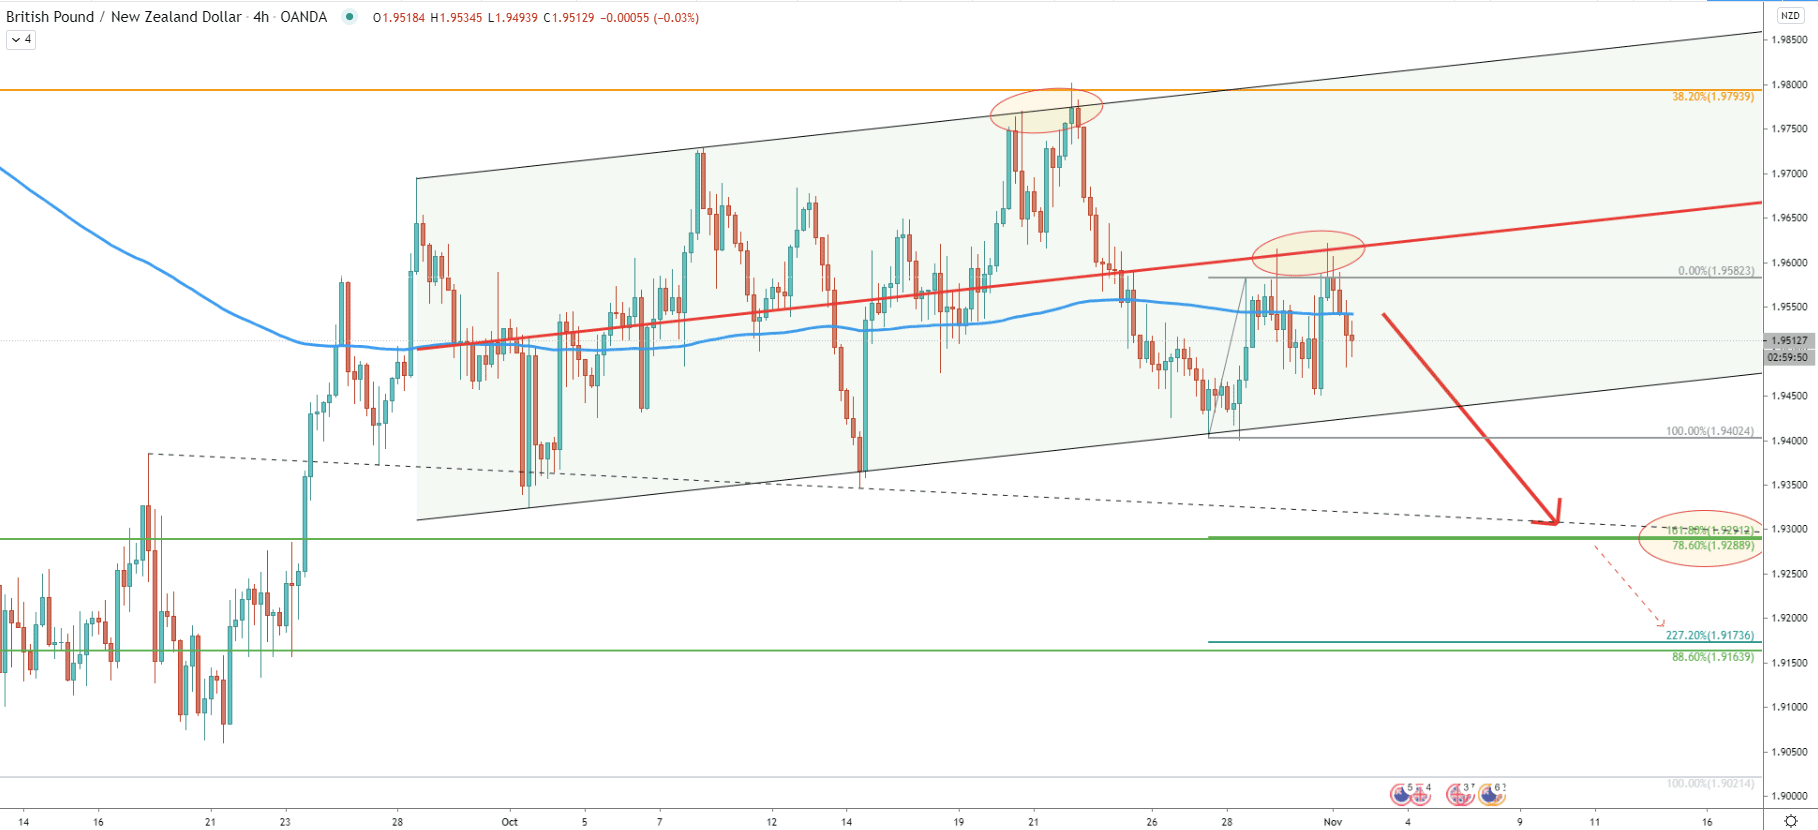
GBP/NZD continues to trade within the ascending channel. Throughout October 20-22 the top of the channel has been rejected twice, after which the price went up and broke below the 200 EMA. Last week’s price has been rejecting the 200 EMA as well as the middle trendline of the channel, both of which are still acting as resistance.
It could be that starting from today GBP/NZD will move towards the 1.9288 support, which on this chart is confirmed by 78.6% as well as 161.8% Fibs applied to the current corrective move up. Also, the second downside target near 1.9170 is confirmed by 88.6% and 227.2% Fibs, making it another key demand zone for GBP/NZD.
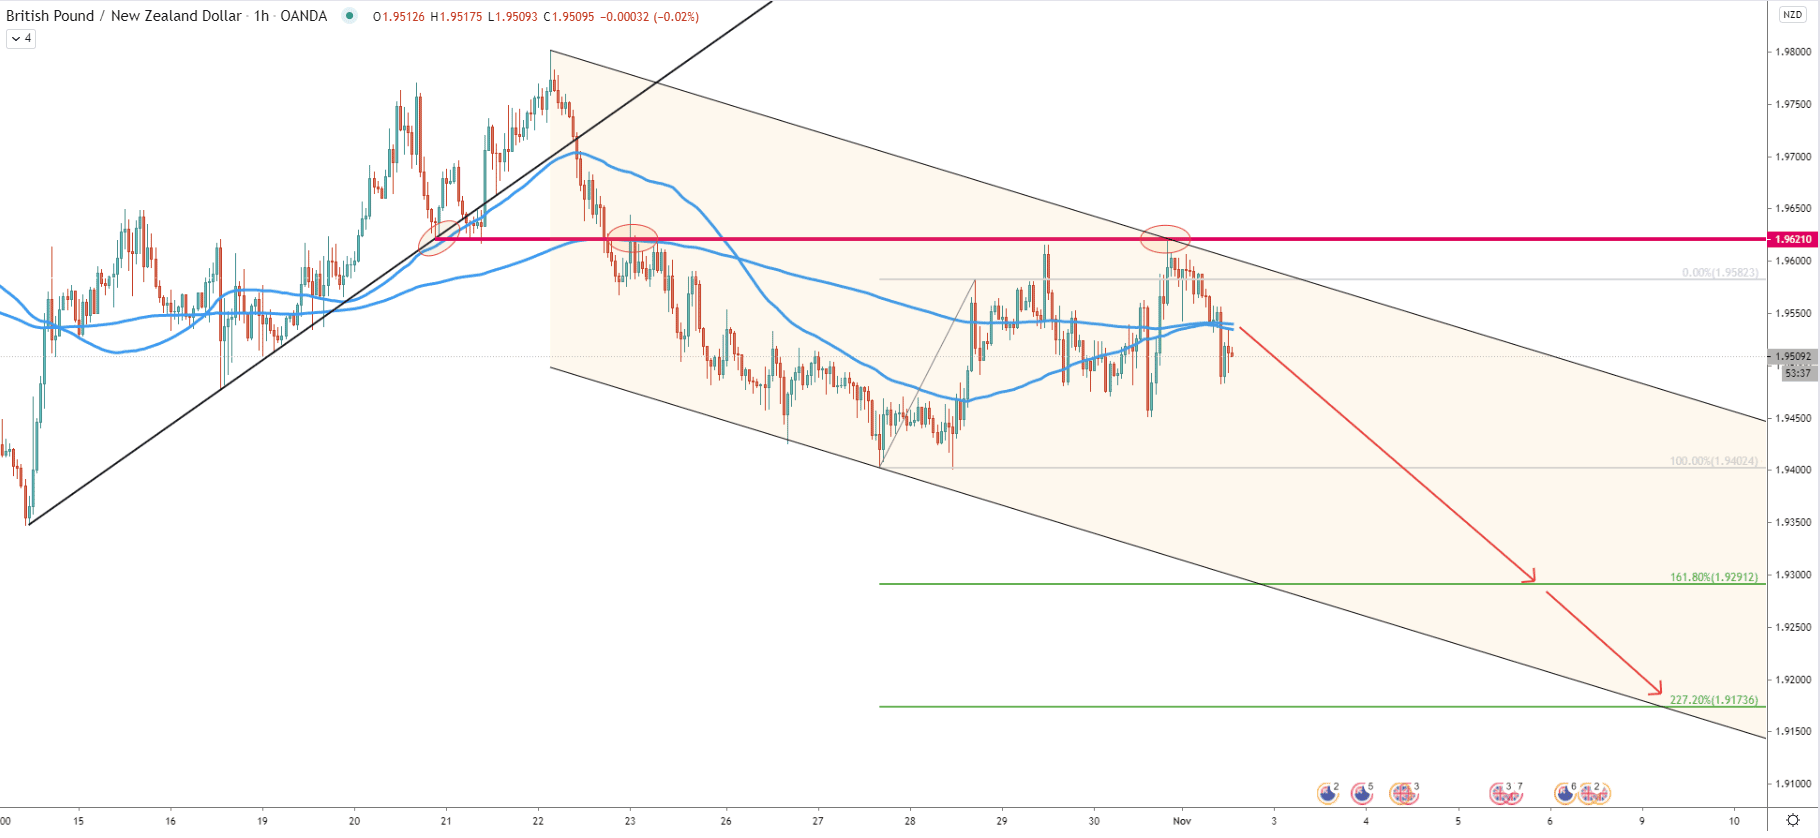
The hourly chart shows, that the previous key support at 1.9621, where the uptrend trendline, as well as 200 EMA, was rejected for the last time prior to the break below, has been acting as the resistance. This resistance got rejected cleanly on October 30, and since then the price went down and broke below 50 and 200 EMAs. Today there was a clean bounce off the 50 EMA, which means as long as the price remains below 1.9534, sellers will be in complete control. The first warning sight could be 1h and/or 4h close above the 1.9534 resistance, in which case the consolidation phase might continue.
GBP/NZD keeps on rejecting all possible resistance indicators, showing that bears are strongly defending the key supply area near the 1.9800 psychological level. As long as the price remains below this resistance, sellers will be attempting to push the price lower, potentially by at least 200 pips.
As per the 4-hour chart, there are two downside target levels. First is the 1.9300 psychological support confirmed by 2 Fibs. The second is near the 1.9170 area and also confirmed by two Fibs.
Break above 1.9800 resistance will immediately invalidate the bearish forecast. In this scenario, GBP/NZD might initiate a fast upside wave, and eventually result in the trend reversal to the upside.
Support: 1.9288, 1.9188
Resistance: 1.9621, 1.9800